You are not logged in.
This means you
CAN ONLY VIEW reports that were published prior to Sunday, February 25, 2024.
You
MUST UPGRADE YOUR MEMBERSHIP if you want to see any current reports.
AFTER MARKET UPDATE - WEDNESDAY, OCTOBER 28TH, 2020
Previous After Market Report Next After Market Report >>>
|
|
|
|
DOW |
-943.24 |
26,519.95 |
-3.43% |
|
Volume |
1,092,193,730 |
+37% |
|
Volume |
3,912,482,100 |
+27% |
|
NASDAQ |
-432.28 |
10,999.07 |
-3.78% |
|
Advancers |
266 |
9% |
|
Advancers |
475 |
14% |
|
S&P 500 |
-28.79 |
3,467.31 |
-0.82% |
|
Decliners |
2,755 |
91% |
|
Decliners |
2,918 |
86% |
|
Russell 2000 |
-47.21 |
1,543.28 |
-2.97% |
|
52 Wk Highs |
14 |
|
|
52 Wk Highs |
21 |
|
|
S&P 600 |
-27.03 |
874.84 |
-3.00% |
|
52 Wk Lows |
98 |
|
|
52 Wk Lows |
135 |
|
|
The major indices have clearly seen the latest uptrend come under heavy distributional pressure while leadership has waned. Disciplined investors limit exposure in rough markets and always raise cash by selling individual holdings on a case by case basis as technical weakness is noted.
|
 |
Major Indices Suffered More Damaging Distributional Pressure
Kenneth J. Gruneisen - Passed the CAN SLIM® Master's Exam
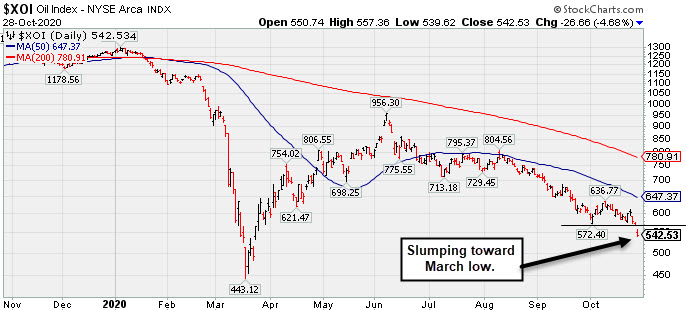
The S&P 500 fell for a third straight day, dropping 3.5%. The Dow slumped 943 points, while the Nasdaq Composite tumbled 3.7%. The reported volume totals were higher than the prior session on the NYSE and on the Nasdaq exchange, indicative of institutional selling perssure termed "distribution". Breadth was clearly negative as decliners led advancers by more than a 10-1 margin on the NYSE and near a 6-1 margin on the Nasdaq exchange. There were 8 high-ranked companies from the Leaders List that hit new 52-week highs and were listed on the BreakOuts Page, versus the total of 17 on the prior session. For the third consecutive session new 52-week lows totals swelled and outnumbered shrinking new 52-week highs totals on the NYSE and on the Nasdaq exchange. The major indices have seen their uptrend again come under pressure (M criteria) with uncertainty raising some concerns. Investors are reminded to always make buying and selling decisions based based on the strict criteria and rules of the fact-based investment system. 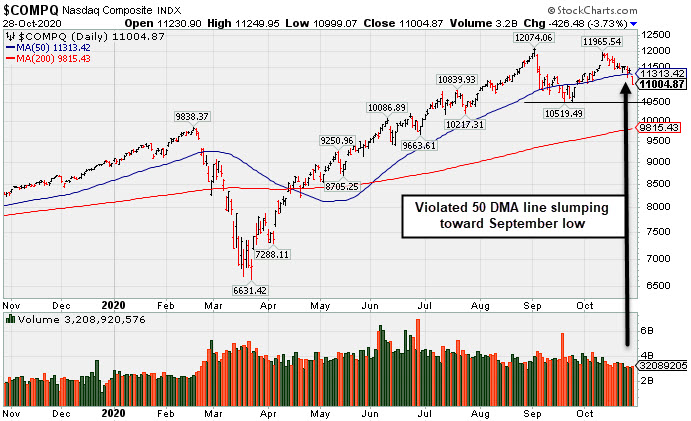 PICTURED: The Nasdaq Composite Index is slumping below its 50-day moving average (DMA) line toward the September low.
Stocks finished broadly lower on Wednesday, as a resurgence in coronavirus infections and hospitalizations dampened investor sentiment. Worries that fresh mitigation efforts would stem economic activity reemerged after Germany and France both announced nationwide lockdown measures. Meanwhile, U.S. fiscal stimulus negotiations have reportedly ceased this week, with President Trump noting the White House would work on a relief bill after the November 3 election. The Cboe volatility Index, commonly referred to Wall Street’s so-called fear gauge, jumped to the highest level since June.
All 11 S&P 500 sectors fell more than 2%. Information Technology stocks led laggards with a 4.3% decline. The Communication Services also underperformed, with the oft-cited FAANG group falling 3.5%. In earnings, Microsoft MSFT -5.06%) fell after providing soft current-quarter guidance following an earnings beat. MasterCard (MA -8.11%) gapped down violating its 200 DMA line after revenue fell short of expectations amid a slowdown in travel-related spending. United Parcel Service (UPS -8.82%) fell despite a top and bottom line beat. General Electric (GE +4.51%) bucked the downtrend, rising after recording a surprise profit.
Treasuries reversed an earlier advance, with the yield on the 10-year unchanged at 0.77%. In commodities, WTI crude slid 5.8% to $37.29/barrel after an official government report showed a larger-than-expected build in U.S. crude inventories, and virus mitigation efforts dampen near-term oil demand prospects. COMEX gold fell 1.7% to $1876.20/ounce as the U.S. dollar rose 0.6% against a basket of its peers. |
 Kenneth J. Gruneisen started out as a licensed stockbroker in August 1987, a couple of months prior to the historic stock market crash that took the Dow Jones Industrial Average down -22.6% in a single day. He has published daily fact-based fundamental and technical analysis on high-ranked stocks online for two decades. Through FACTBASEDINVESTING.COM, Kenneth provides educational articles, news, market commentary, and other information regarding proven investment systems that work in good times and bad.
Comments contained in the body of this report are technical opinions only and are not necessarily those of Gruneisen Growth Corp. The material herein has been obtained from sources believed to be reliable and accurate, however, its accuracy and completeness cannot be guaranteed. Our firm, employees, and customers may effect transactions, including transactions contrary to any recommendation herein, or have positions in the securities mentioned herein or options with respect thereto. Any recommendation contained in this report may not be suitable for all investors and it is not to be deemed an offer or solicitation on our part with respect to the purchase or sale of any securities. |
|
 |
Commodity-Linked Groups Led Financial, Retail, and Tech Lower
Kenneth J. Gruneisen - Passed the CAN SLIM® Master's Exam
The Retail Index ($RLX -3.31%) and financial indices had a negative influence on the major averages as the Bank Index ($BKX -2.42%) and Broker/Dealer Index ($XBD -1.83%) slumped. The Semiconductor Index ($SOX -3.41%), Networking Index ($NWX -3.37%), and Biotech Index ($BTK -2.02%) suffered unanimous losses. Commodity-linked groups suffered even bigger losses as the Gold & Silver Index ($XAU -6.82%), Oil Services Index ($OSX -6.23%), and Integrated Oil Index ($XOI -4.68%) each slumped badly.
PICTURED: The Integrated Oil Index ($XOI -4.68%) met stubborn resistance near its 50 DMA line in July and August and since then it has been slumping toward the March low.
| Oil Services |
$OSX |
26.30 |
-1.75 |
-6.23% |
-66.40% |
| Integrated Oil |
$XOI |
542.53 |
-26.66 |
-4.68% |
-57.30% |
| Semiconductor |
$SOX |
2,222.41 |
-78.50 |
-3.41% |
+20.16% |
| Networking |
$NWX |
533.81 |
-18.60 |
-3.37% |
-8.50% |
| Broker/Dealer |
$XBD |
294.35 |
-5.48 |
-1.83% |
+1.37% |
| Retail |
$RLX |
3,376.42 |
-115.48 |
-3.31% |
+39.26% |
| Gold & Silver |
$XAU |
135.64 |
-9.92 |
-6.82% |
+26.86% |
| Bank |
$BKX |
74.79 |
-1.85 |
-2.42% |
-34.02% |
| Biotech |
$BTK |
5,248.81 |
-108.07 |
-2.02% |
+3.58% |
|
|
|
 |
|
|
|
Color Codes Explained :
Y - Better candidates highlighted by our
staff of experts.
G - Previously featured
in past reports as yellow but may no longer be buyable under the
guidelines.
***Last / Change / Volume data in this table is the closing quote data***
Symbol/Exchange
Company Name
Industry Group |
PRICE |
CHANGE
(%Change) |
Day High |
Volume
(% DAV)
(% 50 day avg vol) |
52 Wk Hi
% From Hi |
Featured
Date |
Price
Featured |
Pivot Featured |
|
Max Buy |
 ADBE
-
NASDAQ
ADBE
-
NASDAQ
Adobe Inc
COMPUTER SOFTWARE and SERVICES - Application Software
|
$456.97
|
-21.59
-4.51% |
$470.97
|
2,675,005
85.68% of 50 DAV
50 DAV is 3,122,000
|
$536.88
-14.88%
|
9/10/2020
|
$488.46
|
PP = $536.88
|
|
MB = $563.72
|
 Most Recent Note - 10/28/2020 6:07:48 PM
G - Gapped down and slumped further below its 50 DMA line ($489) for a new low close with today's loss on lighter volume. Testing the prior low ($452.52 on 9/18/20) which defines the next important support to watch. Only a prompt rebound above the 50 DMA line would help its outlook improve. Fundamentals remain strong.
>>> FEATURED STOCK ARTICLE : Slump Below 50-Day Moving Average Again Raises Concerns - 10/22/2020 |
View all notes |
Set NEW NOTE alert |
Company Profile |
SEC
News |
Chart |
Request a new note
C
A
S
I |
CRL
-
NYSE
Charles River Labs Intl
DRUGS - Biotechnology
|
$222.00
|
-7.26
-3.17% |
$225.25
|
338,400
108.46% of 50 DAV
50 DAV is 312,000
|
$250.29
-11.30%
|
7/15/2020
|
$192.66
|
PP = $189.95
|
|
MB = $199.45
|
Most Recent Note - 10/28/2020 6:09:22 PM
G - Slumped to close below its 50 DMA line ($224) with today's gap down and big loss on lighter volume. Due to report Sep '20 quarterly results on 10/29/20. Volume and volatility often increase near earnings news. See the latest FSU analysis for more details and an annotated graph.
>>> FEATURED STOCK ARTICLE : Earnings Due; Consolidating Near Prior High and Above 50 DMA Line - 10/27/2020 |
View all notes |
Set NEW NOTE alert |
Company Profile |
SEC
News |
Chart |
Request a new note
C
A
S
I |
AMD
-
NASDAQ
Advanced Micro Devices
ELECTRONICS - Semiconductor - Broad Line
|
$76.40
|
-2.48
-3.14% |
$78.96
|
76,338,694
144.75% of 50 DAV
50 DAV is 52,737,000
|
$94.28
-18.96%
|
8/31/2020
|
$90.42
|
PP = $87.39
|
|
MB = $91.76
|
Most Recent Note - 10/28/2020 6:13:32 PM
G - Suffered a 2nd consecutive loss with heavy volume raising concerns. Weak action came after it reported earnings +128% on +56% sales revenues for the Sep '20 quarter versus the year ago period and announced it will acquire Xilinx Inc (XLNX). Any subsequent deterioration below the recent lows ($73.85 on 9/18/20) would raise greater concerns and trigger a more worrisome technical sell signal. Faces near-term resistance due to overhead supply up to the $94 level.
>>> FEATURED STOCK ARTICLE : Consolidating Just Above 50-Day Moving Average - 10/14/2020 |
View all notes |
Set NEW NOTE alert |
Company Profile |
SEC
News |
Chart |
Request a new note
C
A
S
I |
TER
-
NASDAQ
Teradyne Inc
ELECTRONICS - Semiconductor Equipment and Mate
|
$85.54
|
-1.92
-2.20% |
$86.87
|
1,185,927
51.18% of 50 DAV
50 DAV is 2,317,000
|
$93.44
-8.45%
|
10/21/2020
|
$92.22
|
PP = $93.54
|
|
MB = $98.22
|
Most Recent Note - 10/28/2020 6:14:35 PM
Y - Volume totals have been below average while pulling back on 4 of the past 5 sessions after challenging its all-time high last week. A subsequent gain above the pivot point backed by at least +40% above average volume may trigger a technical buy signal. Reported earnings +53% on +41% sales revenues for the Sep '20 quarter versus the year ago period, its 4th consecutive quarterly comparison with earnings above the +25% minimum earnings guideline (C criteria). Sequential comparisons show encouraging acceleration in its sales revenues growth rate. Its annual earnings (A criteria) history has been strong.
>>> FEATURED STOCK ARTICLE : Challenging All-Time High With Volume-Drive Gain - 10/21/2020 |
View all notes |
Set NEW NOTE alert |
Company Profile |
SEC
News |
Chart |
Request a new note
C
A
S
I |
TREX
-
NYSE
Trex Company Inc
MATERIALS and CONSTRUCTION - General Building Materials
|
$71.72
|
-1.38
-1.89% |
$72.89
|
877,503
114.71% of 50 DAV
50 DAV is 765,000
|
$81.23
-11.71%
|
6/26/2020
|
$54.53
|
PP = $66.47
|
|
MB = $69.79
|
Most Recent Note - 10/27/2020 7:24:16 PM
G - Pulled back further today testing its 50 DMA line ($73.14). Any subsequent losses below it or below the recent low ($63.32 on 9/21/20) would raise concerns and trigger technical sell signals. Fundamentals remain strong.
>>> FEATURED STOCK ARTICLE : Recently Wedged Into New High Territory - 10/16/2020 |
View all notes |
Set NEW NOTE alert |
Company Profile |
SEC
News |
Chart |
Request a new note
C
A
S
I |
Symbol/Exchange
Company Name
Industry Group |
PRICE |
CHANGE
(%Change) |
Day High |
Volume
(% DAV)
(% 50 day avg vol) |
52 Wk Hi
% From Hi |
Featured
Date |
Price
Featured |
Pivot Featured |
|
Max Buy |
NFLX
-
NASDAQ
Netflix Inc
SPECIALTY RETAIL - Music and Video Stores
|
$486.24
|
-2.69
-0.55% |
$494.00
|
5,980,421
95.47% of 50 DAV
50 DAV is 6,264,000
|
$575.37
-15.49%
|
10/14/2020
|
$547.45
|
PP = $557.39
|
|
MB = $585.26
|
Most Recent Note - 10/27/2020 7:26:51 PM
G - Still sputtering since violating its 50 DMA line ($507) last week triggering a technical sell signal. Concerns were raised by noted fundamental and technical deterioration. Reported earnings +18% on +23% sales revenues for the Sep '20 quarter, below the +25% minimum earnings guideline (C criteria). Recent low ($458.60 on 9/18/20) defines the next important near term support where any violation would raise serious concerns and trigger a more worrisome technical sell signal.
>>> FEATURED STOCK ARTICLE : Encountered Distributional Pressure When Poised for Breakout - 10/15/2020 |
View all notes |
Set NEW NOTE alert |
Company Profile |
SEC
News |
Chart |
Request a new note
C
A
S
I |
LGIH
-
NASDAQ
L G I Homes Inc
Bldg-Resident/Comml
|
$112.19
|
-0.98
-0.87% |
$114.15
|
115,763
44.35% of 50 DAV
50 DAV is 261,000
|
$132.98
-15.63%
|
10/1/2020
|
$123.17
|
PP = $124.04
|
|
MB = $130.24
|
Most Recent Note - 10/27/2020 7:31:13 PM
G - Color code is changed to green while sputtering below its 50 DMA line ($116.81). A rebound above the 50 DMA line is needed for its outlook to improve. Members were cautioned with recent notes - "Recent gains above the new pivot point lacked the +40% above average volume needed to clinch a proper new (or add-on) technical buy signal."
>>> FEATURED STOCK ARTICLE : Hovering Near High But Recent Gains Lacked Great Volume - 10/19/2020 |
View all notes |
Set NEW NOTE alert |
Company Profile |
SEC
News |
Chart |
Request a new note
C
A
S
I |
NOW
-
NYSE
Servicenow Inc
Computer Sftwr-Enterprse
|
$484.05
|
-15.76
-3.15% |
$489.92
|
1,772,300
131.97% of 50 DAV
50 DAV is 1,343,000
|
$533.37
-9.25%
|
8/20/2020
|
$453.34
|
PP = $454.79
|
|
MB = $477.53
|
Most Recent Note - 10/28/2020 6:11:10 PM
G - Gapped down today for a loss with above average volume while testing support at its 50 DMA line ($482). Subsequent losses below the 50 DMA line and prior low ($432.85 on 9/08/20) would raise concerns and trigger technical sell signals.
>>> FEATURED STOCK ARTICLE : Record High With Light Volume Behind 3rd Consecutive Gain - 10/13/2020 |
View all notes |
Set NEW NOTE alert |
Company Profile |
SEC
News |
Chart |
Request a new note
C
A
S
I |
VEEV
-
NYSE
Veeva Systems Inc Cl A
Computer Sftwr-Medical
|
$287.27
|
-15.08
-4.99% |
$297.32
|
833,334
102.75% of 50 DAV
50 DAV is 811,000
|
$313.99
-8.51%
|
10/6/2020
|
$287.71
|
PP = $298.86
|
|
MB = $313.80
|
Most Recent Note - 10/28/2020 6:04:42 PM
Y - Gapped down today for a big loss on higher (near average) volume amid widespread market weakness. Recently slumped back below its pivot point raising some concerns. The 50 DMA line ($281) defines important near-term support where a violation would trigger a technical sell signal. Fundamentals remain strong.
>>> FEATURED STOCK ARTICLE : Recently Slumped Back Below Prior Highs - 10/26/2020 |
View all notes |
Set NEW NOTE alert |
Company Profile |
SEC
News |
Chart |
Request a new note
C
A
S
I |
TEAM
-
NASDAQ
Atlassian Corp Plc Cl A
Comp Sftwr-Spec Enterprs
|
$208.86
|
-4.15
-1.95% |
$211.51
|
1,835,165
115.78% of 50 DAV
50 DAV is 1,585,000
|
$216.30
-3.44%
|
10/12/2020
|
$193.77
|
PP = $199.60
|
|
MB = $209.58
|
Most Recent Note - 10/27/2020 7:28:58 PM
G - Posted a gain today with light volume for its best-ever close and its color code is changed to green after rising back above its "max buy" level. Prior highs in the $199 area define initial support to watch above its 50 DMA line.
>>> FEATURED STOCK ARTICLE : TEAM Perched Within Close Striking Distance of New Highs - 10/12/2020 |
View all notes |
Set NEW NOTE alert |
Company Profile |
SEC
News |
Chart |
Request a new note
C
A
S
I |
Symbol/Exchange
Company Name
Industry Group |
PRICE |
CHANGE
(%Change) |
Day High |
Volume
(% DAV)
(% 50 day avg vol) |
52 Wk Hi
% From Hi |
Featured
Date |
Price
Featured |
Pivot Featured |
|
Max Buy |
|
|
|
THESE ARE NOT BUY RECOMMENDATIONS!
Comments contained in the body of this report are technical
opinions only. The material herein has been obtained
from sources believed to be reliable and accurate, however,
its accuracy and completeness cannot be guaranteed.
This site is not an investment advisor, hence it does
not endorse or recommend any securities or other investments.
Any recommendation contained in this report may not
be suitable for all investors and it is not to be deemed
an offer or solicitation on our part with respect to
the purchase or sale of any securities. All trademarks,
service marks and trade names appearing in this report
are the property of their respective owners, and are
likewise used for identification purposes only.
This report is a service available
only to active Paid Premium Members.
You may opt-out of receiving report notifications
at any time. Questions or comments may be submitted
by writing to Premium Membership Services 665 S.E. 10 Street, Suite 201 Deerfield Beach, FL 33441-5634 or by calling 1-800-965-8307
or 954-785-1121.
|
|
|