You are not logged in.
This means you
CAN ONLY VIEW reports that were published prior to Friday, February 23, 2024.
You
MUST UPGRADE YOUR MEMBERSHIP if you want to see any current reports.
AFTER MARKET UPDATE - MONDAY, OCTOBER 28TH, 2019
Previous After Market Report Next After Market Report >>>
|
|
|
|
DOW |
+132.66 |
27,090.72 |
+0.49% |
|
Volume |
776,698,610 |
-0% |
|
Volume |
1,948,301,820 |
+3% |
|
NASDAQ |
+82.87 |
8,325.99 |
+1.01% |
|
Advancers |
1,558 |
54% |
|
Advancers |
1,982 |
63% |
|
S&P 500 |
+16.87 |
3,039.42 |
+0.56% |
|
Decliners |
1,301 |
45% |
|
Decliners |
1,157 |
37% |
|
Russell 2000 |
+13.22 |
1,571.93 |
+0.85% |
|
52 Wk Highs |
154 |
|
|
52 Wk Highs |
167 |
|
|
S&P 600 |
+8.42 |
976.54 |
+0.87% |
|
52 Wk Lows |
22 |
|
|
52 Wk Lows |
54 |
|
|
 |
S&P 500 Index Hits New Record High
Kenneth J. Gruneisen - Passed the CAN SLIM® Master's Exam
The Dow added 132 points, while the S&P 500 rose 0.6%. The Nasdaq Composite was up 1%. Monday's volume totals reported were mixed, higher than the prior session total on the Nasdaq exchange but lighter on the NYSE. Advancers led decliners by an 8-7 margin on the NYSE and 3-2 on the Nasdaq exchange. There were 79 high-ranked companies from the Leaders List that hit a new 52-week high and were listed on the BreakOuts Page, versus the total of 62 on the prior session. New 52-week highs outnumbered new 52-week lows on the NYSE and on the Nasdaq exchange. The major indices (M criteria) are in a "confirmed uptrend" after enduring distributional pressure in recent weeks. The Featured Stocks Page provides the most timely analysis on high-ranked leaders. Charts used courtesy of www.stockcharts.com
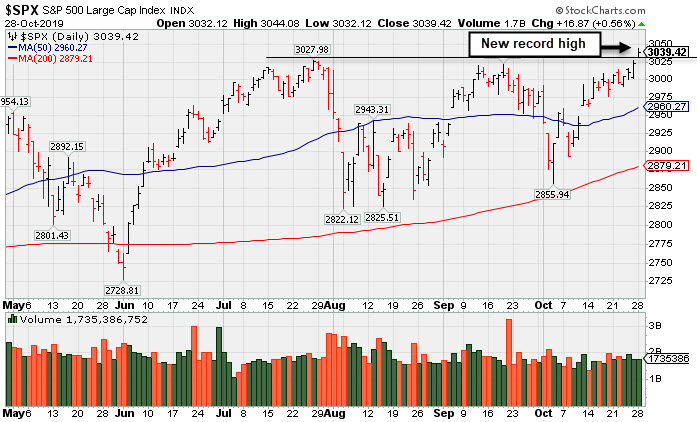
PICTURED: The S&P 500 Index hit a new record high.
Stocks advanced Monday, with the S&P 500 notching a fresh record closing high. Positive developments on the U.S.-China trade front and generally strong corporate earnings results helped boost risk sentiment, sending Treasury yields to six-week highs. President Trump commented that Washington is “ahead of schedule” in working to solidify part of a trade deal with Beijing.
In corporate news, Microsoft (MSFT +2.46%) rose after beating out Amazon (AMZN +0.89%) to win a $10 billion cloud computing contract with the Department of Defense. Tiffany & Co. (TIF +31.63%) rose following reports that the luxury retailer has been in merger discussions with Louis Vuitton parent LVMH. In earnings, HSBC (HSBC -3.62%) fell after the lender missed Wall Street profit estimates and slashed its forward guidance. AT&T (T +4.28%) rose after topping analyst expectations for monthly bill-paying subscribers.
Treasuries weakened, with the yield on the 10-year note up four basis points to 1.84%. In commodities, WTI crude lost 1.5% to $55.81/barrel, snapping a four-day winning streak as weak industrial profit data out of China overshadowed trade optimism. COMEX gold fell 0.6% to $1,490.40/ounce.
On the data front, wholesale inventories declined by 0.3% in September, missing projections for a slight uptick. Separate releases revealed the Chicago Fed’s National Activity Index worsened last month, as did manufacturing activity in the Dallas Fed region. An additional report showed the advance goods trade deficit narrowed in September.
|
 Kenneth J. Gruneisen started out as a licensed stockbroker in August 1987, a couple of months prior to the historic stock market crash that took the Dow Jones Industrial Average down -22.6% in a single day. He has published daily fact-based fundamental and technical analysis on high-ranked stocks online for two decades. Through FACTBASEDINVESTING.COM, Kenneth provides educational articles, news, market commentary, and other information regarding proven investment systems that work in good times and bad.
Comments contained in the body of this report are technical opinions only and are not necessarily those of Gruneisen Growth Corp. The material herein has been obtained from sources believed to be reliable and accurate, however, its accuracy and completeness cannot be guaranteed. Our firm, employees, and customers may effect transactions, including transactions contrary to any recommendation herein, or have positions in the securities mentioned herein or options with respect thereto. Any recommendation contained in this report may not be suitable for all investors and it is not to be deemed an offer or solicitation on our part with respect to the purchase or sale of any securities. |
|
 |
Financial, Retail, and Tech Groups Rose
Kenneth J. Gruneisen - Passed the CAN SLIM® Master's Exam
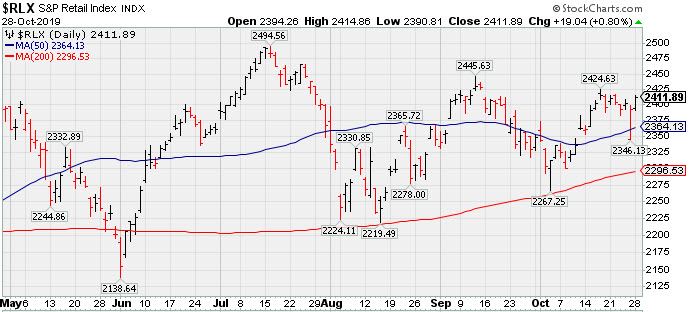
Financial shares had a positive bias as the Broker/Dealer Index ($XBD +1.70%) outpaced the Bank Index ($BKX +0.85%) and the Retail Index ($RLX +0.80%) also rose. The tech sector had a positive bias as the Semiconductor Index ($SOX +1.75%) and the Biotech Index ($BTK +1.83%) both outpaced the Networking Index ($NWX +0.11%). Commodity-linked groups also had a negative bias as the Oil Services Index ($OSX -0.28%) and the Integrated Oil Index ($XOI -0.09%) both inched lower, and the Gold & Silver Index ($XAU -1.84%) was a standout decliner.
PICTURED: The Retail Index ($RLX +0.80%) is consolidating above its 50-day moving average line.
| Oil Services |
$OSX |
67.03 |
-0.19 |
-0.28% |
-16.84% |
| Integrated Oil |
$XOI |
1,246.97 |
-1.11 |
-0.09% |
+7.58% |
| Semiconductor |
$SOX |
1,677.57 |
+28.90 |
+1.75% |
+45.22% |
| Networking |
$NWX |
558.10 |
+0.63 |
+0.11% |
+14.21% |
| Broker/Dealer |
$XBD |
267.01 |
+4.47 |
+1.70% |
+12.50% |
| Retail |
$RLX |
2,411.89 |
+19.04 |
+0.80% |
+23.60% |
| Gold & Silver |
$XAU |
91.82 |
-1.72 |
-1.84% |
+29.95% |
| Bank |
$BKX |
105.60 |
+0.89 |
+0.85% |
+23.09% |
| Biotech |
$BTK |
4,473.46 |
+80.35 |
+1.83% |
+5.98% |
|
|
|
 |
Featured Stocks
Kenneth J. Gruneisen - Passed the CAN SLIM® Master's Exam
See the Featured Stocks with most recent note below. Feel free to contact us if you have a need for any additional information. |
|
|
Color Codes Explained :
Y - Better candidates highlighted by our
staff of experts.
G - Previously featured
in past reports as yellow but may no longer be buyable under the
guidelines.
***Last / Change / Volume data in this table is the closing quote data***
Symbol/Exchange
Company Name
Industry Group |
PRICE |
CHANGE
(%Change) |
Day High |
Volume
(% DAV)
(% 50 day avg vol) |
52 Wk Hi
% From Hi |
Featured
Date |
Price
Featured |
Pivot Featured |
|
Max Buy |
 MLR
-
NYSE
MLR
-
NYSE
Miller Industries Inc
AUTOMOTIVE - Auto Parts
|
$34.50
|
+0.98
2.92% |
$35.28
|
70,120
219.13% of 50 DAV
50 DAV is 32,000
|
$35.26
-2.16%
|
9/24/2019
|
$34.00
|
PP = $35.36
|
|
MB = $37.13
|
 Most Recent Note - 10/28/2019 5:34:09 PM
G - Touched a new high with today's volume-driven gain. Halted its slide recently at its 200 DMA line. Subsequent gains above the pivot point backed by at least +40% above average volume may trigger a technical buy signal. Fundamentals remain strong.
>>> FEATURED STOCK ARTICLE : Tested Support at Long-Term 200-Day Moving Average - 10/9/2019 |
View all notes |
Set NEW NOTE alert |
Company Profile |
SEC
News |
Chart |
Request a new note
C
A
S
I |
CCBG
-
NASDAQ
Capital City Bk Gp
BANKING - Regional - Mid-Atlantic Banks
|
$28.57
|
-0.23
-0.80% |
$29.17
|
31,598
105.33% of 50 DAV
50 DAV is 30,000
|
$29.15
-1.99%
|
9/13/2019
|
$27.03
|
PP = $27.05
|
|
MB = $28.40
|
Most Recent Note - 10/25/2019 12:27:31 PM
G - Hitting yet another new 52-week high with today's 7th consecutive gain, rallying further above its "max buy" level. Prior highs define initial support to watch above its 50 DMA line ($26.16). Due to report earnings news on 10/29/19.
>>> FEATURED STOCK ARTICLE : Perched Near High With Earnings News Due Next Week - 10/14/2019 |
View all notes |
Set NEW NOTE alert |
Company Profile |
SEC
News |
Chart |
Request a new note
C
A
S
I |
AUDC
-
NASDAQ
Audiocodes Ltd
ELECTRONICS - Scientific and Technical Instrum
|
$19.30
|
+0.57
3.04% |
$19.46
|
260,294
130.80% of 50 DAV
50 DAV is 199,000
|
$22.50
-14.22%
|
9/13/2019
|
$19.68
|
PP = $19.84
|
|
MB = $20.83
|
Most Recent Note - 10/25/2019 3:26:55 PM
G - Consolidating above its 50 DMA line ($18.49) but still sputtering below the prior pivot point after slumping back into the prior base. Recent low ($17.54 on 10/08/19) defines the next important support.
>>> FEATURED STOCK ARTICLE : Consolidating Above 50-Day Average But Below Prior Pivot Point - 10/21/2019 |
View all notes |
Set NEW NOTE alert |
Company Profile |
SEC
News |
Chart |
Request a new note
C
A
S
I |
CHDN
-
NASDAQ
Churchill Downs Inc
LEISURE - Gaming Activities
|
$133.76
|
+0.29
0.22% |
$135.32
|
250,756
99.90% of 50 DAV
50 DAV is 251,000
|
$133.91
-0.11%
|
10/8/2019
|
$129.77
|
PP = $132.83
|
|
MB = $139.47
|
Most Recent Note - 10/25/2019 3:25:25 PM
Y - Inching into new all-time high territory with gains lacking great volume conviction. Gains above a stock's pivot point must be backed by at least +40% above average volume to trigger a proper new (or add-on) technical buy signal. Its 50 DMA line ($125.41) acted as support in recent weeks during its consolidation. Jun '19 earnings +10% on +26% sales revenues versus the year ago period were below the +25% minimum earnings guideline (C criteria), noted recently raising fundamental concerns.
>>> FEATURED STOCK ARTICLE : Volume-Driven Gain for Record High Close - 10/8/2019 |
View all notes |
Set NEW NOTE alert |
Company Profile |
SEC
News |
Chart |
Request a new note
C
A
S
I |
LULU
-
NASDAQ
Lululemon Athletica
MANUFACTURING - Textile Manufacturing
|
$205.97
|
-2.03
-0.98% |
$207.53
|
2,417,900
132.27% of 50 DAV
50 DAV is 1,828,000
|
$209.02
-1.46%
|
9/6/2019
|
$201.25
|
PP = $194.35
|
|
MB = $204.07
|
Most Recent Note - 10/28/2019 12:31:21 PM
G - Holding its ground near its all-time high after wedging higher with gains lacking great volume conviction. Its 50 DMA line ($193.44) and recent low ($185.36 on 10/03/19) define important near-term support.
>>> FEATURED STOCK ARTICLE : LULU Stretches to Hit New Record High - 10/18/2019 |
View all notes |
Set NEW NOTE alert |
Company Profile |
SEC
News |
Chart |
Request a new note
C
A
S
I |
Symbol/Exchange
Company Name
Industry Group |
PRICE |
CHANGE
(%Change) |
Day High |
Volume
(% DAV)
(% 50 day avg vol) |
52 Wk Hi
% From Hi |
Featured
Date |
Price
Featured |
Pivot Featured |
|
Max Buy |
CPRT
-
NASDAQ
Copart Inc
SPECIALTY RETAIL - Auto Dealerships
|
$83.98
|
+0.04
0.05% |
$84.64
|
738,728
49.51% of 50 DAV
50 DAV is 1,492,000
|
$85.10
-1.32%
|
9/5/2019
|
$79.13
|
PP = $79.84
|
|
MB = $83.83
|
Most Recent Note - 10/25/2019 5:51:09 PM
G - Reversed and closed lower after it touched a new all-time high today and its color code is changed to green. Its 50 DMA line ($79.84) defines near-term support above the prior low ($76.35 on 10/03/19).
>>> FEATURED STOCK ARTICLE : Reversed Into Red Today After Hitting New All-Time High - 10/22/2019 |
View all notes |
Set NEW NOTE alert |
Company Profile |
SEC
News |
Chart |
Request a new note
C
A
S
I |
BLD
-
NYSE
Topbuild Corp
Bldg-Constr Prds/Misc
|
$98.38
|
-1.68
-1.68% |
$101.31
|
326,932
133.44% of 50 DAV
50 DAV is 245,000
|
$102.81
-4.31%
|
5/17/2019
|
$82.19
|
PP = $87.31
|
|
MB = $91.68
|
Most Recent Note - 10/28/2019 5:33:11 PM
G - Pulled back today with higher volume after wedging into all-time high territory with gains lacking great volume conviction. Earnings rose +39% on +9% sales revenues for the Jun '19 quarter versus the year ago period. Its 50 DMA line ($95) defines important support to watch along with its prior low ($91.31 on 10/03/19).
>>> FEATURED STOCK ARTICLE : Pulling Back After Recently Wedging Into New High Territory - 10/23/2019 |
View all notes |
Set NEW NOTE alert |
Company Profile |
SEC
News |
Chart |
Request a new note
C
A
S
I |
|
|
|
THESE ARE NOT BUY RECOMMENDATIONS!
Comments contained in the body of this report are technical
opinions only. The material herein has been obtained
from sources believed to be reliable and accurate, however,
its accuracy and completeness cannot be guaranteed.
This site is not an investment advisor, hence it does
not endorse or recommend any securities or other investments.
Any recommendation contained in this report may not
be suitable for all investors and it is not to be deemed
an offer or solicitation on our part with respect to
the purchase or sale of any securities. All trademarks,
service marks and trade names appearing in this report
are the property of their respective owners, and are
likewise used for identification purposes only.
This report is a service available
only to active Paid Premium Members.
You may opt-out of receiving report notifications
at any time. Questions or comments may be submitted
by writing to Premium Membership Services 665 S.E. 10 Street, Suite 201 Deerfield Beach, FL 33441-5634 or by calling 1-800-965-8307
or 954-785-1121.
|
|
|