You are not logged in.
This means you
CAN ONLY VIEW reports that were published prior to Monday, February 19, 2024.
You
MUST UPGRADE YOUR MEMBERSHIP if you want to see any current reports.
AFTER MARKET UPDATE - TUESDAY, OCTOBER 27TH, 2020
Previous After Market Report Next After Market Report >>>
|
|
|
|
DOW |
-222.19 |
27,463.19 |
-0.80% |
|
Volume |
795,698,101 |
-4% |
|
Volume |
3,089,035,300 |
-3% |
|
NASDAQ |
+73.16 |
11,432.09 |
+0.64% |
|
Advancers |
915 |
31% |
|
Advancers |
1,314 |
38% |
|
S&P 500 |
-28.79 |
3,467.31 |
-0.82% |
|
Decliners |
2,058 |
69% |
|
Decliners |
2,114 |
62% |
|
Russell 2000 |
-14.50 |
1,590.71 |
-0.90% |
|
52 Wk Highs |
31 |
|
|
52 Wk Highs |
42 |
|
|
S&P 600 |
-12.09 |
901.87 |
-1.32% |
|
52 Wk Lows |
34 |
|
|
52 Wk Lows |
64 |
|
|
 |
Breadth Negative as Major Indices Were Mixed Again
Kenneth J. Gruneisen - Passed the CAN SLIM® Master's Exam
The Dow and S&P 500 fell for a second consecutive day, losing 222 points and 0.3%, respectively. The Nasdaq Composite bucked the downtrend, rising 0.6%. The reported volume totals were lighter than the prior session on the NYSE and on the Nasdaq exchange. Breadth was negative as decliners led advancers by more than a 2-1 margin on the NYSE and near a 3-2 margin on the Nasdaq exchange. There were 17 high-ranked companies from the Leaders List that hit new 52-week highs and were listed on the BreakOuts Page, versus the total of 10 on the prior session. For the second consecutive session new 52-week lows totals outnumbered new 52-week highs totals on the NYSE and on the Nasdaq exchange. The major indices are in a confirmed uptrend (M criteria). New buying efforts may be justified in leading stocks on a case-by-case basis. 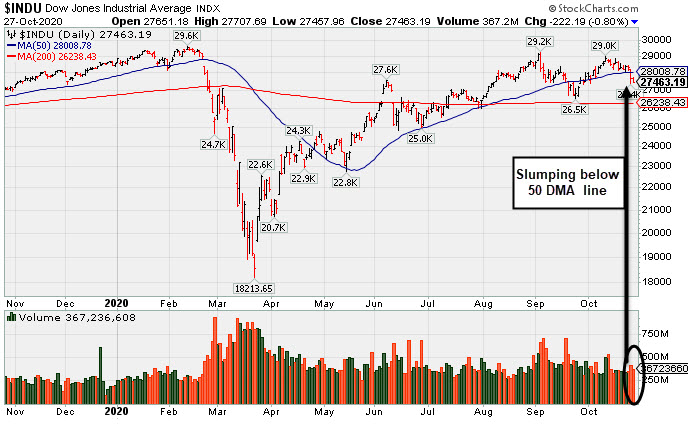 PICTURED: The Dow Jones Industrial Average has recently slumped below its 50-day moving average (DMA) line.
Stocks finished mixed on Tuesday, as investors digested a flurry of corporate updates and assessed economic data. Concerns surrounding a resurgence in coronavirus cases weighed on investor sentiment, with the U.S. reporting the highest seven-day average of new cases since the pandemic began.
Eight of 11 S&P 500 sectors ended in negative territory, with Industrials lagging. Caterpillar (CAT -3.24%) fell after offering little guidance following an earnings beat. Raytheon Technologies (RTX -7.04%) fell after mixed third-quarter figures showed sales from its missiles and intelligence unit were lower than projected. Meanwhile, M&A news provided a tailwind to the Consumer Discretionary and Tech sectors. Chipmaker Xilinx (XLNX +8.56%) rose after Advance Micro Devices (AMD -4.07%) said it would acquire the rival in a $35 billion all-stock deal. Tiffany & Co (TIF +4.93%) rose as an analyst survey raised the likelihood of the jeweler being acquired by French luxury brand LVMH Moet Hennessy (LVMHY -1.33%) to 90%.
On the data front, the Conference Board’s gauge of consumer confidence unexpectedly fell in October. A preliminary reading showed durable goods orders jumped 1.9% in September, well above estimates of a 0.5% uptick. Meanwhile, a release from S&P CoreLogic Case-Shiller showed home prices in 20 of the largest U.S. cities rose 5.2% year-over-year in August, the fastest pace in two years. Treasuries strengthened, with the yield on the 10-year note down three basis points to 0.77%. In commodities, WTI crude added 2.3% to $39.46/barrel as investors eye another tropical storm in the Gulf of Mexico. |
 Kenneth J. Gruneisen started out as a licensed stockbroker in August 1987, a couple of months prior to the historic stock market crash that took the Dow Jones Industrial Average down -22.6% in a single day. He has published daily fact-based fundamental and technical analysis on high-ranked stocks online for two decades. Through FACTBASEDINVESTING.COM, Kenneth provides educational articles, news, market commentary, and other information regarding proven investment systems that work in good times and bad.
Comments contained in the body of this report are technical opinions only and are not necessarily those of Gruneisen Growth Corp. The material herein has been obtained from sources believed to be reliable and accurate, however, its accuracy and completeness cannot be guaranteed. Our firm, employees, and customers may effect transactions, including transactions contrary to any recommendation herein, or have positions in the securities mentioned herein or options with respect thereto. Any recommendation contained in this report may not be suitable for all investors and it is not to be deemed an offer or solicitation on our part with respect to the purchase or sale of any securities. |
|
 |
Retail, Biotech, and Gold & Silver Indexes Rose
Kenneth J. Gruneisen - Passed the CAN SLIM® Master's Exam
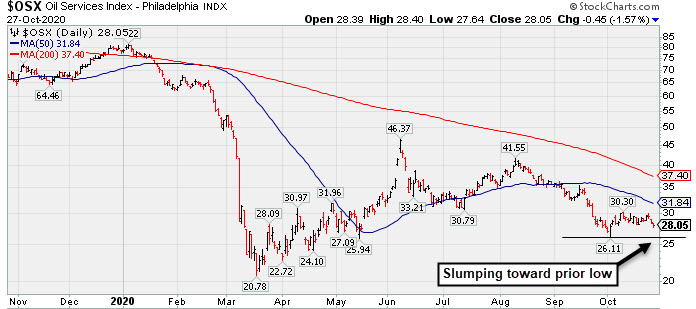
The Retail Index ($RLX +1.16%) had a positive influence on the major indices but the Bank Index ($BKX -2.99%) created a big drag and the Broker/Dealer Index ($XBD -0.06%) finished flat. The Biotech Index ($BTK +0.99%) managed to post a decent gain, meanwhile the Semiconductor Index ($SOX -0.33%) and Networking Index ($NWX -0.13%) both edged lower. The Oil Services Index ($OSX -1.57%) and Integrated Oil Index ($XOI -1.75%) both lost ground while the Gold &Silver Index ($XAU +1.85%) notched a gain. PICTURED: The Oil Services Index ($OSX -1.57%) has been recently sputtering below its 50 DMA line toward the prior low.
| Oil Services |
$OSX |
28.05 |
-0.45 |
-1.57% |
-64.17% |
| Integrated Oil |
$XOI |
569.19 |
-10.17 |
-1.75% |
-55.20% |
| Semiconductor |
$SOX |
2,300.75 |
-7.70 |
-0.33% |
+24.39% |
| Networking |
$NWX |
552.41 |
-0.71 |
-0.13% |
-5.31% |
| Broker/Dealer |
$XBD |
299.84 |
-0.17 |
-0.06% |
+3.26% |
| Retail |
$RLX |
3,491.90 |
+40.20 |
+1.16% |
+42.57% |
| Gold & Silver |
$XAU |
145.56 |
+2.65 |
+1.85% |
+36.14% |
| Bank |
$BKX |
76.64 |
-2.36 |
-2.99% |
-32.39% |
| Biotech |
$BTK |
5,356.88 |
+52.77 |
+0.99% |
+5.71% |
|
|
|
 |
Earnings Due; Consolidating Near Prior High and Above 50 DMA Line
Kenneth J. Gruneisen - Passed the CAN SLIM® Master's Exam
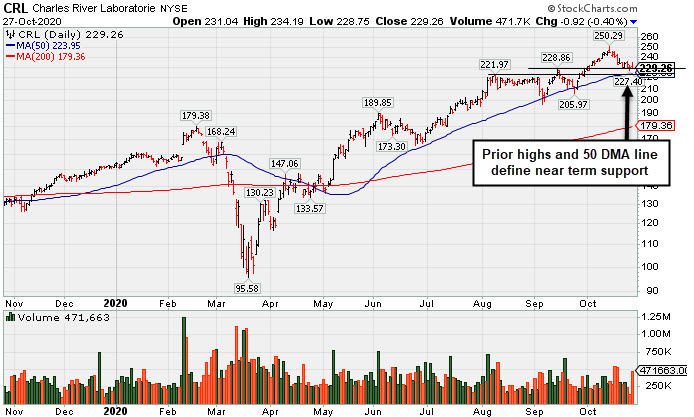
Charles River Labs Intl (CRL -$0.92 or -0.40% to $229.26) is consolidating above prior highs and above its 50-day moving average (DMA) line ($224) which define near-term support to watch. Any subsequent violations would raise concerns and may trigger technical sell signals. Keep in mind it is due to to report Sep '20 quarterly results on 10/29/20. Volume and volatility often increase near earnings news.
Fundamental concerns were raised when it reported Jun '20 quarterly earnings -3% on +4% sales revenues, below the +25% minimum guideline (C criteria), but the results were better than expected and the company also raised its guidance. It now has a 91 Earnings Per Share Rating, down from 96 prior to the report. The 2 prior quarterly earnings increases were above the +25% minimum guideline (C criteria) of the fact-based investment system. Annual earnings (A criteria) history has been strong and steady.
CRL traded up as much as +29.9% since it was highlighted in yellow with pivot point cited based on its 6/03/20 high plus 10 cents in the 7/15/20 mid-day report (read here). It was last shown in this FSU section on 10/09/20 with an annotated graph under the headline, "New Record High for Charles River Labs".
It hails from the Medical - Research Equipment/Services industry group which has an 66 Group Relative Strength Rating (L criteria). The number of top-rated funds owning its shares rose from 681 in Dec '19 to 775 in Sep '20, and its Up/Down Volume Ratio is 0.9 is an unbiased indication its shares have been under slight distributional pressure over the past 50 days. There is a small number of only 49.7 million shares (S criteria) outstanding, which can contribute to greater price volatility in the event of institutional buying or selling.
|
|
|
Color Codes Explained :
Y - Better candidates highlighted by our
staff of experts.
G - Previously featured
in past reports as yellow but may no longer be buyable under the
guidelines.
***Last / Change / Volume data in this table is the closing quote data***
Symbol/Exchange
Company Name
Industry Group |
PRICE |
CHANGE
(%Change) |
Day High |
Volume
(% DAV)
(% 50 day avg vol) |
52 Wk Hi
% From Hi |
Featured
Date |
Price
Featured |
Pivot Featured |
|
Max Buy |
 ADBE
-
NASDAQ
ADBE
-
NASDAQ
Adobe Inc
COMPUTER SOFTWARE and SERVICES - Application Software
|
$478.56
|
+3.36
0.71% |
$481.89
|
1,895,471
60.85% of 50 DAV
50 DAV is 3,115,000
|
$536.88
-10.86%
|
9/10/2020
|
$488.46
|
PP = $536.88
|
|
MB = $563.72
|
Most Recent Note - 10/26/2020 5:58:09 PM
G - Slumped further below its 50 DMA line ($489) with today's loss on lighter volume. The prior low ($452.52 on 9/18/20) defines the next important support to watch. Only a prompt rebound above the 50 DMA line would help its outlook improve. Fundamentals remain strong.
>>> FEATURED STOCK ARTICLE : Slump Below 50-Day Moving Average Again Raises Concerns - 10/22/2020 |
View all notes |
Set NEW NOTE alert |
Company Profile |
SEC
News |
Chart |
Request a new note
C
A
S
I |
CRL
-
NYSE
Charles River Labs Intl
DRUGS - Biotechnology
|
$229.26
|
-0.92
-0.40% |
$234.19
|
471,663
154.14% of 50 DAV
50 DAV is 306,000
|
$250.29
-8.40%
|
7/15/2020
|
$192.66
|
PP = $189.95
|
|
MB = $199.45
|
 Most Recent Note - 10/27/2020 7:18:28 PM
G - Consolidating above prior highs and above its 50 DMA line ($224) which define near-term support to watch. Due to report Sep '20 quarterly results on 10/29/20. Volume and volatility often increase near earnings news. See the latest FSU analysis for more details and a new annotated graph.
>>> FEATURED STOCK ARTICLE : Earnings Due; Consolidating Near Prior High and Above 50 DMA Line - 10/27/2020 |
View all notes |
Set NEW NOTE alert |
Company Profile |
SEC
News |
Chart |
Request a new note
C
A
S
I |
AMD
-
NASDAQ
Advanced Micro Devices
ELECTRONICS - Semiconductor - Broad Line
|
$78.88
|
-3.35
-4.07% |
$82.37
|
156,322,753
311.20% of 50 DAV
50 DAV is 50,233,000
|
$94.28
-16.33%
|
8/31/2020
|
$90.42
|
PP = $87.39
|
|
MB = $91.76
|
Most Recent Note - 10/27/2020 7:21:46 PM
G - Pulled back with heavy volume today after it reported earnings +128% on +56% sales revenues for the Sep '20 quarter versus the year ago period and announced it will acquire Xilinx Inc (XLNX). Volume and volatility often increase near earnings news. Slumped below its 50 DMA line ($82). Any subsequent deterioration below the recent lows ($73.85 on 9/18/20) would raise greater concerns and trigger a more worrisome technical sell signal. Faces some near-term resistance due to overhead supply up to the $94 level.
>>> FEATURED STOCK ARTICLE : Consolidating Just Above 50-Day Moving Average - 10/14/2020 |
View all notes |
Set NEW NOTE alert |
Company Profile |
SEC
News |
Chart |
Request a new note
C
A
S
I |
TER
-
NASDAQ
Teradyne Inc
ELECTRONICS - Semiconductor Equipment and Mate
|
$87.46
|
-2.13
-2.38% |
$89.83
|
1,474,923
63.96% of 50 DAV
50 DAV is 2,306,000
|
$93.44
-6.40%
|
10/21/2020
|
$92.22
|
PP = $93.54
|
|
MB = $98.22
|
Most Recent Note - 10/27/2020 7:22:54 PM
Y - Volume totals have been below average while pulling back after challenging its all-time high last week. A subsequent gain above the pivot point backed by at least +40% above average volume may trigger a technical buy signal. Reported earnings +53% on +41% sales revenues for the Sep '20 quarter versus the year ago period, its 4th consecutive quarterly comparison with earnings above the +25% minimum earnings guideline (C criteria). Sequential comparisons show encouraging acceleration in its sales revenues growth rate. Its annual earnings (A criteria) history has been strong.
>>> FEATURED STOCK ARTICLE : Challenging All-Time High With Volume-Drive Gain - 10/21/2020 |
View all notes |
Set NEW NOTE alert |
Company Profile |
SEC
News |
Chart |
Request a new note
C
A
S
I |
TREX
-
NYSE
Trex Company Inc
MATERIALS and CONSTRUCTION - General Building Materials
|
$73.10
|
-1.54
-2.06% |
$75.22
|
468,151
60.64% of 50 DAV
50 DAV is 772,000
|
$81.23
-10.01%
|
6/26/2020
|
$54.53
|
PP = $66.47
|
|
MB = $69.79
|
Most Recent Note - 10/27/2020 7:24:16 PM
G - Pulled back further today testing its 50 DMA line ($73.14). Any subsequent losses below it or below the recent low ($63.32 on 9/21/20) would raise concerns and trigger technical sell signals. Fundamentals remain strong.
>>> FEATURED STOCK ARTICLE : Recently Wedged Into New High Territory - 10/16/2020 |
View all notes |
Set NEW NOTE alert |
Company Profile |
SEC
News |
Chart |
Request a new note
C
A
S
I |
Symbol/Exchange
Company Name
Industry Group |
PRICE |
CHANGE
(%Change) |
Day High |
Volume
(% DAV)
(% 50 day avg vol) |
52 Wk Hi
% From Hi |
Featured
Date |
Price
Featured |
Pivot Featured |
|
Max Buy |
NFLX
-
NASDAQ
Netflix Inc
SPECIALTY RETAIL - Music and Video Stores
|
$488.93
|
+0.69
0.14% |
$490.49
|
3,616,196
57.95% of 50 DAV
50 DAV is 6,240,000
|
$575.37
-15.02%
|
10/14/2020
|
$547.45
|
PP = $557.39
|
|
MB = $585.26
|
Most Recent Note - 10/27/2020 7:26:51 PM
G - Still sputtering since violating its 50 DMA line ($507) last week triggering a technical sell signal. Concerns were raised by noted fundamental and technical deterioration. Reported earnings +18% on +23% sales revenues for the Sep '20 quarter, below the +25% minimum earnings guideline (C criteria). Recent low ($458.60 on 9/18/20) defines the next important near term support where any violation would raise serious concerns and trigger a more worrisome technical sell signal.
>>> FEATURED STOCK ARTICLE : Encountered Distributional Pressure When Poised for Breakout - 10/15/2020 |
View all notes |
Set NEW NOTE alert |
Company Profile |
SEC
News |
Chart |
Request a new note
C
A
S
I |
LGIH
-
NASDAQ
L G I Homes Inc
Bldg-Resident/Comml
|
$113.17
|
-0.78
-0.68% |
$115.88
|
136,860
52.04% of 50 DAV
50 DAV is 263,000
|
$132.98
-14.90%
|
10/1/2020
|
$123.17
|
PP = $124.04
|
|
MB = $130.24
|
Most Recent Note - 10/27/2020 7:31:13 PM
G - Color code is changed to green while sputtering below its 50 DMA line ($116.81). A rebound above the 50 DMA line is needed for its outlook to improve. Members were cautioned with recent notes - "Recent gains above the new pivot point lacked the +40% above average volume needed to clinch a proper new (or add-on) technical buy signal."
>>> FEATURED STOCK ARTICLE : Hovering Near High But Recent Gains Lacked Great Volume - 10/19/2020 |
View all notes |
Set NEW NOTE alert |
Company Profile |
SEC
News |
Chart |
Request a new note
C
A
S
I |
NOW
-
NYSE
Servicenow Inc
Computer Sftwr-Enterprse
|
$499.81
|
-1.80
-0.36% |
$510.00
|
1,200,468
88.40% of 50 DAV
50 DAV is 1,358,000
|
$533.37
-6.29%
|
8/20/2020
|
$453.34
|
PP = $454.79
|
|
MB = $477.53
|
Most Recent Note - 10/26/2020 5:42:03 PM
G - There was a "negative reversal" today for a loss with above average volume. Recently wedged to new all-time highs with gains lacking great volume. Found support at its 50 DMA line ($480) but did not form a new base of sufficient length. Fundamentals remain strong. Any losses below the 50 DMA line and prior low ($432.85 on 9/08/20) would raise concerns and trigger technical sell signals.
>>> FEATURED STOCK ARTICLE : Record High With Light Volume Behind 3rd Consecutive Gain - 10/13/2020 |
View all notes |
Set NEW NOTE alert |
Company Profile |
SEC
News |
Chart |
Request a new note
C
A
S
I |
VEEV
-
NYSE
Veeva Systems Inc Cl A
Computer Sftwr-Medical
|
$302.35
|
+5.48
1.85% |
$304.74
|
711,493
88.27% of 50 DAV
50 DAV is 806,000
|
$313.99
-3.71%
|
10/6/2020
|
$287.71
|
PP = $298.86
|
|
MB = $313.80
|
Most Recent Note - 10/26/2020 5:52:21 PM
Y - Recently slumped back below its pivot point raising some concerns. The 50 DMA line ($280) defines important near-term support where a violation would trigger a technical sell signal. Fundamentals remain strong. See the latest FSU analysis for more details and a new annotated graph.
>>> FEATURED STOCK ARTICLE : Recently Slumped Back Below Prior Highs - 10/26/2020 |
View all notes |
Set NEW NOTE alert |
Company Profile |
SEC
News |
Chart |
Request a new note
C
A
S
I |
TEAM
-
NASDAQ
Atlassian Corp Plc Cl A
Comp Sftwr-Spec Enterprs
|
$213.01
|
+5.81
2.80% |
$213.30
|
1,095,813
68.79% of 50 DAV
50 DAV is 1,593,000
|
$216.30
-1.52%
|
10/12/2020
|
$193.77
|
PP = $199.60
|
|
MB = $209.58
|
Most Recent Note - 10/27/2020 7:28:58 PM
G - Posted a gain today with light volume for its best-ever close and its color code is changed to green after rising back above its "max buy" level. Prior highs in the $199 area define initial support to watch above its 50 DMA line.
>>> FEATURED STOCK ARTICLE : TEAM Perched Within Close Striking Distance of New Highs - 10/12/2020 |
View all notes |
Set NEW NOTE alert |
Company Profile |
SEC
News |
Chart |
Request a new note
C
A
S
I |
Symbol/Exchange
Company Name
Industry Group |
PRICE |
CHANGE
(%Change) |
Day High |
Volume
(% DAV)
(% 50 day avg vol) |
52 Wk Hi
% From Hi |
Featured
Date |
Price
Featured |
Pivot Featured |
|
Max Buy |
|
|
|
THESE ARE NOT BUY RECOMMENDATIONS!
Comments contained in the body of this report are technical
opinions only. The material herein has been obtained
from sources believed to be reliable and accurate, however,
its accuracy and completeness cannot be guaranteed.
This site is not an investment advisor, hence it does
not endorse or recommend any securities or other investments.
Any recommendation contained in this report may not
be suitable for all investors and it is not to be deemed
an offer or solicitation on our part with respect to
the purchase or sale of any securities. All trademarks,
service marks and trade names appearing in this report
are the property of their respective owners, and are
likewise used for identification purposes only.
This report is a service available
only to active Paid Premium Members.
You may opt-out of receiving report notifications
at any time. Questions or comments may be submitted
by writing to Premium Membership Services 665 S.E. 10 Street, Suite 201 Deerfield Beach, FL 33441-5634 or by calling 1-800-965-8307
or 954-785-1121.
|
|
|