You are not logged in.
This means you
CAN ONLY VIEW reports that were published prior to Sunday, February 25, 2024.
You
MUST UPGRADE YOUR MEMBERSHIP if you want to see any current reports.
AFTER MARKET UPDATE - MONDAY, OCTOBER 26TH, 2020
Previous After Market Report Next After Market Report >>>
|
|
|
|
DOW |
-650.19 |
27,685.38 |
-2.29% |
|
Volume |
826,828,256 |
+15% |
|
Volume |
3,184,210,800 |
+2% |
|
NASDAQ |
-191.39 |
11,356.89 |
-1.66% |
|
Advancers |
396 |
13% |
|
Advancers |
641 |
19% |
|
S&P 500 |
-28.79 |
3,467.31 |
-0.82% |
|
Decliners |
2,634 |
87% |
|
Decliners |
2,782 |
81% |
|
Russell 2000 |
-35.29 |
1,605.21 |
-2.15% |
|
52 Wk Highs |
14 |
|
|
52 Wk Highs |
38 |
|
|
S&P 600 |
-19.76 |
913.96 |
-2.12% |
|
52 Wk Lows |
45 |
|
|
52 Wk Lows |
62 |
|
|
 |
Breadth Negative as Major Indices Suffered Large Losses
Kenneth J. Gruneisen - Passed the CAN SLIM® Master's Exam
The Dow tumbled 650 points, while the S&P 500 slid 1.9%. The Nasdaq Composite retreated 1.6%. The reported volume totals were higher than the prior session on the NYSE and on the Nasdaq exchange. Breadth was negative as decliners led advancers by more than a 6-1 margin on the NYSE and a 4-1 margin on the Nasdaq exchange. There were 10 high-ranked companies from the Leaders List that hit new 52-week highs and were listed on the BreakOuts Page, versus the total of 32 on the prior session. New 52-week lows totals outnumbered new 52-week highs totals on the NYSE and on the Nasdaq exchange. The major indices are in a confirmed uptrend (M criteria). New buying efforts may be justified in leading stocks on a case-by-case basis. 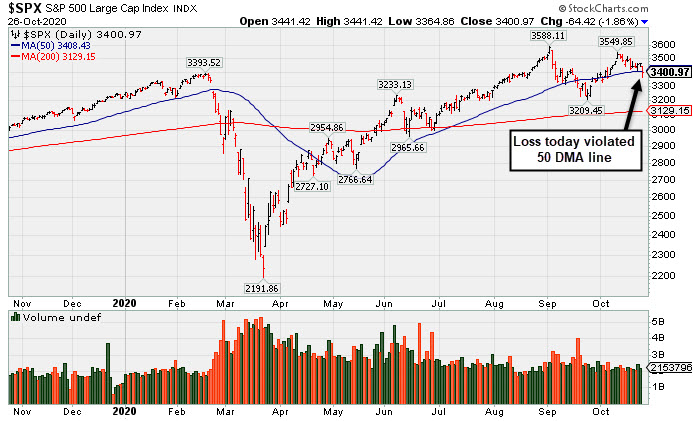 PICTURED: The S&P 500 Index violated its 50-day moving average (DMA) line.
Stocks notched their worst one-day slump since September, as rising global coronavirus cases weighed on economic recovery prospects and investor sentiment waned after negotiations for a pre-election fiscal stimulus deal in Washington seem to reach a stalemate.
The World Health Organization cautioned that the northern hemisphere is facing a “dangerous moment,” with daily infections in the U.S. hitting a record over the weekend and resurging cases in Europe inspiring new restrictions. Meanwhile, talks for a coronavirus relief bill seemed to reach a standstill, with no incremental progress being made over the weekend and Senate Republicans reportedly becoming wary of the size of the bill being discussed. On the data front, new home sales unexpectedly fell 3.5% in September. Treasuries strengthened, with the yield on the benchmark 10-year note down four basis points to 0.80%.
All 11 S&P 500 sectors ended in negative territory, with all but the Utilities group losing more than 1%. Information Technology was a notable laggard, with Oracle (ORCL -4.02%) down after its German rival SAP (SAP -23.16%) warned that its business would take longer than expected to recover from the pandemic. Travel-related stocks also underperformed amid the uptick in coronavirus cases. Shares of American Airlines (AAL -6.35%) and Royal Caribbean Cruises -9.65%) fell. In M&A news, Dunkin’ Brands (DNKN +16.12%) rose after holding preliminary talks to be acquired by privately held Inspire Brands. Elsewhere, AstraZeneca (AZN +2.06%) rose after reporting its COVID-19 vaccine candidate showed an immune response in both older and younger adults. |
 Kenneth J. Gruneisen started out as a licensed stockbroker in August 1987, a couple of months prior to the historic stock market crash that took the Dow Jones Industrial Average down -22.6% in a single day. He has published daily fact-based fundamental and technical analysis on high-ranked stocks online for two decades. Through FACTBASEDINVESTING.COM, Kenneth provides educational articles, news, market commentary, and other information regarding proven investment systems that work in good times and bad.
Comments contained in the body of this report are technical opinions only and are not necessarily those of Gruneisen Growth Corp. The material herein has been obtained from sources believed to be reliable and accurate, however, its accuracy and completeness cannot be guaranteed. Our firm, employees, and customers may effect transactions, including transactions contrary to any recommendation herein, or have positions in the securities mentioned herein or options with respect thereto. Any recommendation contained in this report may not be suitable for all investors and it is not to be deemed an offer or solicitation on our part with respect to the purchase or sale of any securities. |
|
 |
Commodity-Linked Groups Led Financial, Retail, and Tech Lower
Kenneth J. Gruneisen - Passed the CAN SLIM® Master's Exam
The Broker/Dealer Index ($XBD -2.06%) and Bank Index ($BKX -2.43%) both outpaced the Retail Index ($RLX -1.03%) to the downside The Semiconductor Index ($SOX -2.17%), Networking Index ($NWX -2.02%), and Biotech Index ($BTK -1.32%) suffered unanimous losses. Commodity-linked groups had a clearly negative bias as the Oil Services Index ($OSX -3.48%) and Integrated Oil Index ($XOI -4.00%) both outpaced the Gold & Silver Index ($XAU -1.75%) to the downside. PICTURED: The Gold & Silver Index ($XAU -1.75%) has been recently sputtering below its 50 DMA line.
| Oil Services |
$OSX |
28.50 |
-1.03 |
-3.48% |
-63.60% |
| Integrated Oil |
$XOI |
579.35 |
-24.17 |
-4.00% |
-54.40% |
| Semiconductor |
$SOX |
2,308.97 |
-51.26 |
-2.17% |
+24.83% |
| Networking |
$NWX |
553.12 |
-11.40 |
-2.02% |
-5.19% |
| Broker/Dealer |
$XBD |
300.01 |
-6.30 |
-2.06% |
+3.32% |
| Retail |
$RLX |
3,451.70 |
-36.04 |
-1.03% |
+40.93% |
| Gold & Silver |
$XAU |
142.91 |
-2.55 |
-1.75% |
+33.66% |
| Bank |
$BKX |
79.00 |
-1.97 |
-2.43% |
-30.31% |
| Biotech |
$BTK |
5,304.11 |
-71.03 |
-1.32% |
+4.67% |
|
|
|
 |
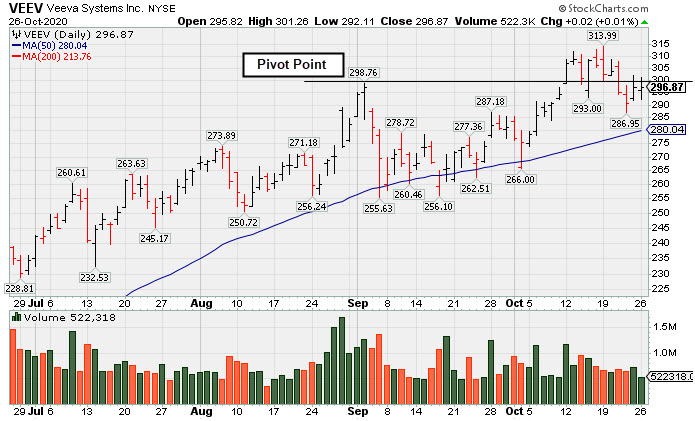
Recently Slumped Back Below Prior Highs
Kenneth J. Gruneisen - Passed the CAN SLIM® Master's Exam
Veeva Systems Inc Cl A (VEEV +$0.02 or +0.01% to $296.87) recently slumped back below its pivot point with losses on lighter than average volume raising some concerns. The 50-day moving average (DMA) line ($280) defines important near-term support where a violation would trigger a technical sell signal. Fundamentals remain strong.
VEEV was highlighted in yellow with new pivot point cited based on its 9/02/20 high plus 10 cents in the 10/06/20 mid-day report (read here). It was shown in this FSU section that evening with an annotated graph under the headline, "First Sound Base Being Built After Considerable Rally" . It had not spent much time base building since it first began wedging into new high territory back in April.
Veeva has the highest possible 99 Earnings Per Share (EPS) rank and it has a 94 Relative Strength (RS) rating. Both of those ratings must be above 80 for a stock to meet the guidelines for consideration. It reported earnings +31% on +33% sales revenues for the Jul '20 quarter versus the year ago period. Three of the past 4 quarterly comparisons were above the +25% minimum earnings guideline (C criteria). Its annual earnings (A criteria) history has been strong.
There are 134.4 million shares (S criteria) in the publicly traded float. The number of top-rated funds owning its shares rose from 814 in Jun '18 to 1,534 in Sep '20, a reassuring sign concerning the I criteria. Its current Up/Down Volume Ratio of 1.6 is an unbiased indication its shares have been under accumulation over the past 50 days.
|
|
|
Color Codes Explained :
Y - Better candidates highlighted by our
staff of experts.
G - Previously featured
in past reports as yellow but may no longer be buyable under the
guidelines.
***Last / Change / Volume data in this table is the closing quote data***
Symbol/Exchange
Company Name
Industry Group |
PRICE |
CHANGE
(%Change) |
Day High |
Volume
(% DAV)
(% 50 day avg vol) |
52 Wk Hi
% From Hi |
Featured
Date |
Price
Featured |
Pivot Featured |
|
Max Buy |
 ADBE
-
NASDAQ
ADBE
-
NASDAQ
Adobe Inc
COMPUTER SOFTWARE and SERVICES - Application Software
|
$475.20
|
-13.30
-2.72% |
$488.78
|
2,204,627
71.35% of 50 DAV
50 DAV is 3,090,000
|
$536.88
-11.49%
|
9/10/2020
|
$488.46
|
PP = $536.88
|
|
MB = $563.72
|
 Most Recent Note - 10/26/2020 5:58:09 PM
G - Slumped further below its 50 DMA line ($489) with today's loss on lighter volume. The prior low ($452.52 on 9/18/20) defines the next important support to watch. Only a prompt rebound above the 50 DMA line would help its outlook improve. Fundamentals remain strong.
>>> FEATURED STOCK ARTICLE : Slump Below 50-Day Moving Average Again Raises Concerns - 10/22/2020 |
View all notes |
Set NEW NOTE alert |
Company Profile |
SEC
News |
Chart |
Request a new note
C
A
S
I |
CRL
-
NYSE
Charles River Labs Intl
DRUGS - Biotechnology
|
$230.18
|
-2.63
-1.13% |
$232.03
|
142,659
46.62% of 50 DAV
50 DAV is 306,000
|
$250.29
-8.03%
|
7/15/2020
|
$192.66
|
PP = $189.95
|
|
MB = $199.45
|
Most Recent Note - 10/22/2020 5:39:00 PM
G - Consolidating above prior highs and above its 50 DMA line ($223) which define near-term support to watch. Due to report Sep '20 quarterly results on 10/29/20. Volume and volatility often increase near earnings news.
>>> FEATURED STOCK ARTICLE : New Record High for Charles River Labs - 10/9/2020 |
View all notes |
Set NEW NOTE alert |
Company Profile |
SEC
News |
Chart |
Request a new note
C
A
S
I |
AMD
-
NASDAQ
Advanced Micro Devices
ELECTRONICS - Semiconductor - Broad Line
|
$82.23
|
+0.27
0.33% |
$84.97
|
69,164,499
139.19% of 50 DAV
50 DAV is 49,692,000
|
$94.28
-12.78%
|
8/31/2020
|
$90.42
|
PP = $87.39
|
|
MB = $91.76
|
Most Recent Note - 10/26/2020 12:27:58 PM
G - Due to report earnings results for the Sep '20 quarter tomorrow Tuesday, 10/27/20. Volume and volatility often increase near earnings news. Rebounding above its 50 DMA line ($82.05) today with a gain backed by higher volume. Any subsequent deterioration below the recent lows ($78.42 on 10/22/20 and $73.85 on 9/18/20) would raise greater concerns and trigger more worrisome technical sell signals. Faces some near-term resistance due to overhead supply up to the $94 level.
>>> FEATURED STOCK ARTICLE : Consolidating Just Above 50-Day Moving Average - 10/14/2020 |
View all notes |
Set NEW NOTE alert |
Company Profile |
SEC
News |
Chart |
Request a new note
C
A
S
I |
TER
-
NASDAQ
Teradyne Inc
ELECTRONICS - Semiconductor Equipment and Mate
|
$89.59
|
-2.41
-2.62% |
$91.62
|
1,257,923
54.53% of 50 DAV
50 DAV is 2,307,000
|
$93.44
-4.12%
|
10/21/2020
|
$92.22
|
PP = $93.54
|
|
MB = $98.22
|
Most Recent Note - 10/26/2020 5:54:35 PM
Y - Volume totals have been cooling after challenging its all-time high last week. A subsequent gain above the pivot point backed by at least +40% above average volume may trigger a technical buy signal. Reported earnings +53% on +41% sales revenues for the Sep '20 quarter versus the year ago period, its 4th consecutive quarterly comparison with earnings above the +25% minimum earnings guideline (C criteria). Sequential comparisons show encouraging acceleration in its sales revenues growth rate. Its annual earnings (A criteria) history has been strong.
>>> FEATURED STOCK ARTICLE : Challenging All-Time High With Volume-Drive Gain - 10/21/2020 |
View all notes |
Set NEW NOTE alert |
Company Profile |
SEC
News |
Chart |
Request a new note
C
A
S
I |
TREX
-
NYSE
Trex Company Inc
MATERIALS and CONSTRUCTION - General Building Materials
|
$74.64
|
-2.00
-2.61% |
$76.06
|
372,087
47.64% of 50 DAV
50 DAV is 781,000
|
$81.23
-8.11%
|
6/26/2020
|
$54.53
|
PP = $66.47
|
|
MB = $69.79
|
Most Recent Note - 10/26/2020 5:55:47 PM
G - Pulled back further today with below average volume. Any subsequent losses below the 50 DMA line ($73.12) or recent low ($63.32 on 9/21/20) would raise concerns and trigger technical sell signals. Fundamentals remain strong.
>>> FEATURED STOCK ARTICLE : Recently Wedged Into New High Territory - 10/16/2020 |
View all notes |
Set NEW NOTE alert |
Company Profile |
SEC
News |
Chart |
Request a new note
C
A
S
I |
Symbol/Exchange
Company Name
Industry Group |
PRICE |
CHANGE
(%Change) |
Day High |
Volume
(% DAV)
(% 50 day avg vol) |
52 Wk Hi
% From Hi |
Featured
Date |
Price
Featured |
Pivot Featured |
|
Max Buy |
NFLX
-
NASDAQ
Netflix Inc
SPECIALTY RETAIL - Music and Video Stores
|
$488.24
|
-0.04
-0.01% |
$496.82
|
6,179,821
100.08% of 50 DAV
50 DAV is 6,175,000
|
$575.37
-15.14%
|
10/14/2020
|
$547.45
|
PP = $557.39
|
|
MB = $585.26
|
Most Recent Note - 10/21/2020 12:18:32 PM
G - Reported earnings +18% on +23% sales revenues for the Sep '20 quarter, below the +25% minimum earnings guideline (C criteria). Gapped down today violating its 50 DMA line ($506) triggering a technical sell signal, and its color code was changed to green due to fundamental and technical deterioration. Recent low ($458.60 on 9/18/20) defines the next important near term support where any further deterioration would raise serious concerns and trigger a more worrisome technical sell signal.
>>> FEATURED STOCK ARTICLE : Encountered Distributional Pressure When Poised for Breakout - 10/15/2020 |
View all notes |
Set NEW NOTE alert |
Company Profile |
SEC
News |
Chart |
Request a new note
C
A
S
I |
LGIH
-
NASDAQ
L G I Homes Inc
Bldg-Resident/Comml
|
$113.95
|
-2.93
-2.51% |
$115.30
|
174,980
66.79% of 50 DAV
50 DAV is 262,000
|
$132.98
-14.31%
|
10/1/2020
|
$123.17
|
PP = $124.04
|
|
MB = $130.24
|
Most Recent Note - 10/23/2020 5:14:21 PM
Y - Color code is changed to yellow after it rebounded near its 50 DMA line ($116.74) with light volume today helping its outlook to improve after damaging volume-driven losses. Members were cautioned with a recent note - "Recent gains above the new pivot point lacked the +40% above average volume needed to clinch a proper new (or add-on) technical buy signal."
>>> FEATURED STOCK ARTICLE : Hovering Near High But Recent Gains Lacked Great Volume - 10/19/2020 |
View all notes |
Set NEW NOTE alert |
Company Profile |
SEC
News |
Chart |
Request a new note
C
A
S
I |
NOW
-
NYSE
Servicenow Inc
Computer Sftwr-Enterprse
|
$501.61
|
-12.40
-2.41% |
$521.86
|
1,619,107
119.85% of 50 DAV
50 DAV is 1,351,000
|
$533.37
-5.95%
|
8/20/2020
|
$453.34
|
PP = $454.79
|
|
MB = $477.53
|
Most Recent Note - 10/26/2020 5:42:03 PM
G - There was a "negative reversal" today for a loss with above average volume. Recently wedged to new all-time highs with gains lacking great volume. Found support at its 50 DMA line ($480) but did not form a new base of sufficient length. Fundamentals remain strong. Any losses below the 50 DMA line and prior low ($432.85 on 9/08/20) would raise concerns and trigger technical sell signals.
>>> FEATURED STOCK ARTICLE : Record High With Light Volume Behind 3rd Consecutive Gain - 10/13/2020 |
View all notes |
Set NEW NOTE alert |
Company Profile |
SEC
News |
Chart |
Request a new note
C
A
S
I |
VEEV
-
NYSE
Veeva Systems Inc Cl A
Computer Sftwr-Medical
|
$296.87
|
+0.02
0.01% |
$301.26
|
522,295
65.04% of 50 DAV
50 DAV is 803,000
|
$313.99
-5.45%
|
10/6/2020
|
$287.71
|
PP = $298.86
|
|
MB = $313.80
|
Most Recent Note - 10/26/2020 5:52:21 PM
Y - Recently slumped back below its pivot point raising some concerns. The 50 DMA line ($280) defines important near-term support where a violation would trigger a technical sell signal. Fundamentals remain strong. See the latest FSU analysis for more details and a new annotated graph.
>>> FEATURED STOCK ARTICLE : Recently Slumped Back Below Prior Highs - 10/26/2020 |
View all notes |
Set NEW NOTE alert |
Company Profile |
SEC
News |
Chart |
Request a new note
C
A
S
I |
TEAM
-
NASDAQ
Atlassian Corp Plc Cl A
Comp Sftwr-Spec Enterprs
|
$207.20
|
-1.29
-0.62% |
$210.27
|
709,052
44.32% of 50 DAV
50 DAV is 1,600,000
|
$216.30
-4.21%
|
10/12/2020
|
$193.77
|
PP = $199.60
|
|
MB = $209.58
|
Most Recent Note - 10/22/2020 12:20:02 PM
Y - Color code is changed to yellow while pulling back from its 52-week highs and below its "max buy" level. Prior highs in the $199 area define initial support to watch above its 50 DMA line.
>>> FEATURED STOCK ARTICLE : TEAM Perched Within Close Striking Distance of New Highs - 10/12/2020 |
View all notes |
Set NEW NOTE alert |
Company Profile |
SEC
News |
Chart |
Request a new note
C
A
S
I |
Symbol/Exchange
Company Name
Industry Group |
PRICE |
CHANGE
(%Change) |
Day High |
Volume
(% DAV)
(% 50 day avg vol) |
52 Wk Hi
% From Hi |
Featured
Date |
Price
Featured |
Pivot Featured |
|
Max Buy |
|
|
|
THESE ARE NOT BUY RECOMMENDATIONS!
Comments contained in the body of this report are technical
opinions only. The material herein has been obtained
from sources believed to be reliable and accurate, however,
its accuracy and completeness cannot be guaranteed.
This site is not an investment advisor, hence it does
not endorse or recommend any securities or other investments.
Any recommendation contained in this report may not
be suitable for all investors and it is not to be deemed
an offer or solicitation on our part with respect to
the purchase or sale of any securities. All trademarks,
service marks and trade names appearing in this report
are the property of their respective owners, and are
likewise used for identification purposes only.
This report is a service available
only to active Paid Premium Members.
You may opt-out of receiving report notifications
at any time. Questions or comments may be submitted
by writing to Premium Membership Services 665 S.E. 10 Street, Suite 201 Deerfield Beach, FL 33441-5634 or by calling 1-800-965-8307
or 954-785-1121.
|
|
|