You are not logged in.
This means you
CAN ONLY VIEW reports that were published prior to Tuesday, February 20, 2024.
You
MUST UPGRADE YOUR MEMBERSHIP if you want to see any current reports.
AFTER MARKET UPDATE - FRIDAY, OCTOBER 26TH, 2018
Previous After Market Report Next After Market Report >>>
|
|
|
|
DOW |
-296.24 |
24,688.31 |
-1.19% |
|
Volume |
1,127,425,430 |
+5% |
|
Volume |
2,955,352,300 |
+7% |
|
NASDAQ |
-151.13 |
7,167.21 |
-2.07% |
|
Advancers |
831 |
28% |
|
Advancers |
983 |
32% |
|
S&P 500 |
-46.88 |
2,658.69 |
-1.73% |
|
Decliners |
2,163 |
72% |
|
Decliners |
2,089 |
68% |
|
Russell 2000 |
-16.58 |
1,483.82 |
-1.10% |
|
52 Wk Highs |
9 |
|
|
52 Wk Highs |
18 |
|
|
S&P 600 |
-9.11 |
932.15 |
-0.97% |
|
52 Wk Lows |
530 |
|
|
52 Wk Lows |
445 |
|
|
Since October 10th this commentary has repeatedly warned investors IN BOLD that the market is in a correction, which is a time to reduce exposure to stocks. The Featured Stocks list has been trimmed considerably as weakness in former leaders was noted. Please let us know if you have any input on how we can make it more clear that this is a time for investors to be defensive. Use our inquiry form or call the Help Line 954-785-1121.
RULE #1 is to always limit your losses. Best regards, Ken Gruneisen
|
 |
Leadership Scant as Major Indices Slump Into Deeper Correction
Kenneth J. Gruneisen - Passed the CAN SLIM® Master's Exam
For the week, the Dow fell 3%. The S&P 500 lost 3.9% as all 11 sectors in the index ended in negative territory. The Nasdaq Composite retreated 3.8%, posting its fourth consecutive weekly decline. Stocks ended firmly lower Friday. The Dow fell 296 points to 24688, while the S&P 500 lost 46 points to 2658. Meanwhile, the Nasdaq Composite slid 151 points to 7167, on pace for its worst month since November 2008. Behind the losses the volume totals reported were higher on the NYSE and on the Nasdaq exchange versus the prior session, indicative of continuing distributional pressure. Decliners led advancers by an 11-4 margin on the NYSE and more than 2-1 on the Nasdaq exchange. There were only 2 high-ranked companies from the Leaders List that made new 52-week highs and were listed on the BreakOuts Page, versus 6 on the prior session, as market leadership remained very elusive. New 52-week lows totals swelled again and easily outnumbered new 52-week highs on the NYSE and Nasdaq exchange. Recent reports have noted that the major indices (M criteria) have shown action indicative of a market correction while leadership disappeared. During market corrections investors should have a bias toward selling stocks on a case-by-case basis as technical sell signals occur, raising cash levels while reducing market exposure. The Featured Stocks Page provides the most timely analysis on high-ranked leaders. Charts used courtesy of www.stockcharts.com
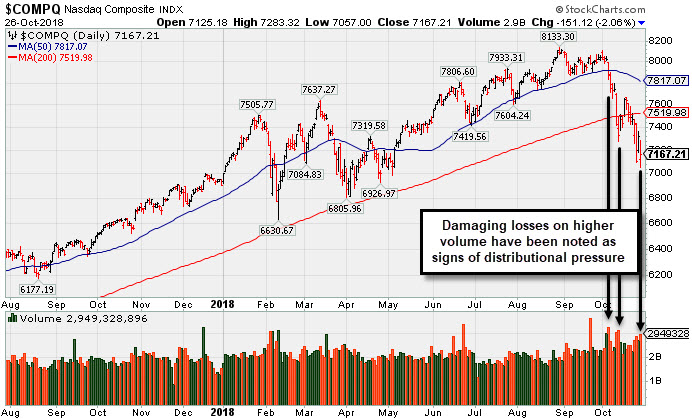
PICTURED: The Nasdaq Composite Index and other major indices fell badly on Friday, quickly killing the new rally attempt. Technically, the market remains in a "correction" under the fact-based investment system. Members have been reminded repeatedly that new buying efforts are against the rules until a convincing follow-through day occurs. A "follow-through day" of solid gains (at least +1%) from one or more of the major indices, backed by higher volume, and coupled with a leadership expansion (increase in new 52-week highs), are all of the necessary elements required to confirm a new rally. Until then, patience and discipline are paramount.
The major averages declined as a sell-off in tech shares deepened after a lackluster batch of earnings from members of the oft-cited “FAANG” group. Consumer Discretionary shares led the retreat, falling 3.4%. Shares of Amazon (AMZN -7.82%) after the e-commerce giant missed on the top line due to a slowdown in its cloud business unit. The Communication Services group also lagged as Google parent company Alphabet (GOOGL -1.80%) fell after missing analyst revenue projections for the first time since early 2016. Meanwhile, Intel (INTC +3.11%) bucked the downtrend as the semiconductor maker topped earnings forecasts and raised forward guidance.
On the data front, a preliminary reading on third-quarter GDP revealed an annualized growth rate of 3.5%, above projections of 3.3%.
Treasuries strengthened with the yield on the 10-year note down four basis points to 3.08%. In commodities, WTI crude added 0.5% to $67.69/barrel. COMEX gold gained 0.3% to $1,232.50/ounce amid a weaker dollar.
|
 Kenneth J. Gruneisen started out as a licensed stockbroker in August 1987, a couple of months prior to the historic stock market crash that took the Dow Jones Industrial Average down -22.6% in a single day. He has published daily fact-based fundamental and technical analysis on high-ranked stocks online for two decades. Through FACTBASEDINVESTING.COM, Kenneth provides educational articles, news, market commentary, and other information regarding proven investment systems that work in good times and bad.
Comments contained in the body of this report are technical opinions only and are not necessarily those of Gruneisen Growth Corp. The material herein has been obtained from sources believed to be reliable and accurate, however, its accuracy and completeness cannot be guaranteed. Our firm, employees, and customers may effect transactions, including transactions contrary to any recommendation herein, or have positions in the securities mentioned herein or options with respect thereto. Any recommendation contained in this report may not be suitable for all investors and it is not to be deemed an offer or solicitation on our part with respect to the purchase or sale of any securities. |
|
 |
Retail, Tech, Financial, and Energy-Linked Groups Fell
Kenneth J. Gruneisen - Passed the CAN SLIM® Master's Exam
The Retail Index ($RLX -4.17%) was a standout decliner on Friday, with much of the credit going to Amazon. The Bank Index ($BKX -1.24%) and Broker/Dealer Index ($XBD -0.66%) both also created a drag on the major indices. The tech sector had a negative bias as the Biotech Index ($BTK -1.08%), Semiconductor Index ($SOX -1.72%), and the Networking Index ($NWX -2.69%) each posted solid losses. Commodity-linked groups were mixed as the Integrated Oil Index ($XOI -0.56%) and the Oil Services Index ($OSX -1.04%) both fell, meanwhile the Gold & Silver Index ($XAU +0.68%) was a standout gainer.
Charts courtesy of www.stockcharts.com
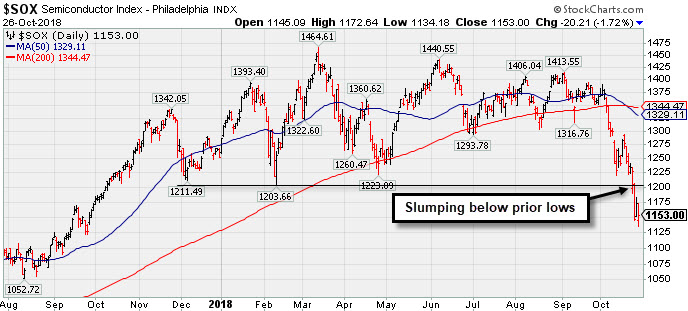 PICTURED: The Semiconductor Index ($SOX -1.72%) has been slumping below prior 2018 lows.
| Oil Services |
$OSX |
122.75 |
-1.29 |
-1.04% |
-17.92% |
| Integrated Oil |
$XOI |
1,349.23 |
-7.58 |
-0.56% |
+1.02% |
| Semiconductor |
$SOX |
1,153.00 |
-20.21 |
-1.72% |
-7.98% |
| Networking |
$NWX |
501.58 |
-13.89 |
-2.69% |
+2.25% |
| Broker/Dealer |
$XBD |
250.00 |
-1.65 |
-0.66% |
-5.75% |
| Retail |
$RLX |
2,089.61 |
-103.18 |
-4.71% |
+20.52% |
| Gold & Silver |
$XAU |
65.17 |
+0.45 |
+0.70% |
-23.57% |
| Bank |
$BKX |
94.83 |
-1.19 |
-1.24% |
-11.13% |
| Biotech |
$BTK |
4,536.86 |
-49.32 |
-1.08% |
+7.45% |
|
|
|
 |
Perched Near High After Latest Earnings Report Below +25% Minimum
Kenneth J. Gruneisen - Passed the CAN SLIM® Master's Exam
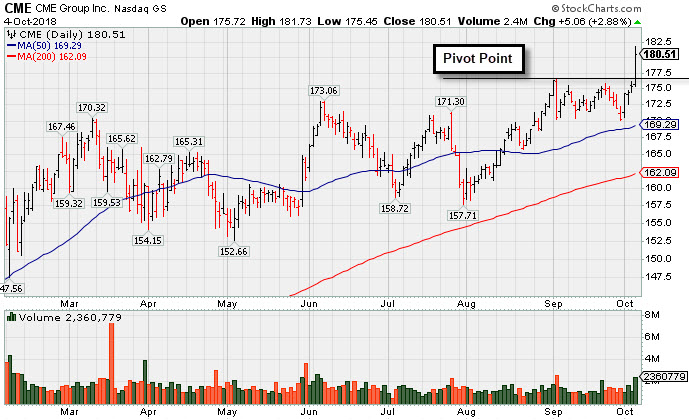
C M E Group Inc (CME +$1.17 or +0.66% to $178.64) has shown impressive relative strength in recent weeks. It pulled back yet stayed above its 50-day moving average line on the prior session after it reported earnings +22% on +2% sales revenues for the Sep '18 quarter, below the +25% minimum earnings guideline (C criteria), raising fundamental concerns. Broad market weakness (M criteria) in recent weeks has also raised concerns. The 50-day moving average (DMA) line ($174.79) and prior low ($170.04 on 9/28/18) define important near-term support to watch.
It was last shown in this FSU section on 10/04/18 with an annotated graph under the headline, "CME Group Blasted to New Record High", after highlighted in yellow with pivot point cited base on its 9/05/18 high plus 10 cents in the earlier mid-day report (read here).
Earnings increases in the Mar and Jun '18 quarters were above the +25% minimum guideline (C criteria) with solid sales revenues increases. Annual earnings (A criteria) growth has been steady.
The number of top-rated funds owning its shares rose from 1,688 in Dec '17 to 2.029 in Sep '18, a reassuring sign concerning the I criteria. Its current Up/Down Volume Ratio of 1.5 is an unbiased indication its shares have been under accumulation over the past 50 days. It has earned an A Timeliness Rating.
Additional leadership in the group (L criteria) is a reassuring sign. However, several of its peers in the Financial Services - Specialty group stumbled in recent weeks. Its low Industry Group Relative Strength rating of 48 is a concern, plus the noted weakness in Financials which has been covered repeatedly in the Industry Group Watch section of recent After Market Reports.
Charts courtesy of www.stockcharts.com
 |
|
|
Color Codes Explained :
Y - Better candidates highlighted by our
staff of experts.
G - Previously featured
in past reports as yellow but may no longer be buyable under the
guidelines.
***Last / Change / Volume data in this table is the closing quote data***
Symbol/Exchange
Company Name
Industry Group |
PRICE |
CHANGE
(%Change) |
Day High |
Volume
(% DAV)
(% 50 day avg vol) |
52 Wk Hi
% From Hi |
Featured
Date |
Price
Featured |
Pivot Featured |
|
Max Buy |
MPX
-
NYSE
Marine Products Corp
AUTOMOTIVE - Recreational Vehicles
|
$20.26
|
-1.16
-5.42% |
$21.44
|
63,684
172.12% of 50 DAV
50 DAV is 37,000
|
$24.82
-18.37%
|
10/24/2018
|
$23.00
|
PP = $24.92
|
|
MB = $26.17
|
 Most Recent Note - 10/26/2018 5:44:01 PM
G - Color code is changed to green after slumping further below its 50 DMA line ($21.50) today with a 3rd volume-driven loss in the span of 4 sessions. A prompt rebound above the 50 DMA line is needed for its outlook to improve. Finished weak after highlighted in yellow with pivot point cited based on its 9/12/18 high plus 10 cents in the 10/24/18 mid-day report. See the latest FSU analysis for more details and an annotated graph.
>>> FEATURED STOCK ARTICLE : Weak Finish Amid Widely Negative Market Environment - 10/24/2018 |
View all notes |
Set NEW NOTE alert |
Company Profile |
SEC
News |
Chart |
Request a new note
C
A
S
I |
GMED
-
NYSE
Globus Medical Inc Cl A
CHEMICALS - Specialty Chemicals
|
$52.14
|
-0.31
-0.59% |
$53.16
|
730,141
113.02% of 50 DAV
50 DAV is 646,000
|
$57.55
-9.40%
|
9/26/2018
|
$56.11
|
PP = $57.65
|
|
MB = $60.53
|
Most Recent Note - 10/25/2018 5:54:22 PM
G - Sputtering below its 50 DMA line ($52.91) after recent volume-driven losses hurt its outlook. A rebound and subsequent gains above the pivot point backed by more than +40% above average volume are needed to trigger a proper technical buy signal.
>>> FEATURED STOCK ARTICLE : Consolidating After Rally at 200-Day Moving Average Line - 10/22/2018 |
View all notes |
Set NEW NOTE alert |
Company Profile |
SEC
News |
Chart |
Request a new note
C
A
S
I |
ZBRA
-
NASDAQ
Zebra Tech Corp Cl A
COMPUTER HARDWARE - Computer Peripherals
|
$160.60
|
-2.30
-1.41% |
$163.64
|
279,184
73.28% of 50 DAV
50 DAV is 381,000
|
$179.47
-10.51%
|
8/7/2018
|
$164.26
|
PP = $161.82
|
|
MB = $169.91
|
Most Recent Note - 10/24/2018 5:46:49 PM
G - Suffered a damaging volume-driven loss today. It met resistance after rebounding to its 50 DMA line ($168.41). Overhead supply remains up to the $179 level. Found support in recent weeks after a pullback near its 200 DMA line. See the latest FSU analysis for more details and an annotated graph.
>>> FEATURED STOCK ARTICLE : Zebra Tech Sputtering Near 50-Day Moving Average - 10/23/2018 |
View all notes |
Set NEW NOTE alert |
Company Profile |
SEC
News |
Chart |
Request a new note
C
A
S
I |
CME
-
NASDAQ
C M E Group Inc
DIVERSIFIED SERVICES - Business/Management Services
|
$178.64
|
+1.17
0.66% |
$180.88
|
2,014,305
136.29% of 50 DAV
50 DAV is 1,478,000
|
$183.79
-2.80%
|
10/4/2018
|
$179.29
|
PP = $177.45
|
|
MB = $186.32
|
Most Recent Note - 10/26/2018 5:40:14 PM
Y - Remains above its 50 DMA line ($174.79) after recently reporting earnings +22% on +2% sales revenues for the Sep '18 quarter, below the +25% minimum earnings guideline (C criteria), raising fundamental concerns. Broad market weakness (M criteria) is also a serious concern. The 50 DMA line and prior low ($170.04 on 9/28/18) define important near-term support. See the latest FSU analysis for more details and a new annotated graph.
>>> FEATURED STOCK ARTICLE : Perched Near High After Latest Earnings Report Below +25% Minimum - 10/26/2018 |
View all notes |
Set NEW NOTE alert |
Company Profile |
SEC
News |
Chart |
Request a new note
C
A
S
I |
DPZ
-
NYSE
Dominos Pizza Inc
Retail-Restaurants
|
$261.24
|
-0.53
-0.20% |
$262.71
|
550,058
98.58% of 50 DAV
50 DAV is 558,000
|
$305.34
-14.44%
|
8/13/2018
|
$288.60
|
PP = $293.91
|
|
MB = $308.61
|
Most Recent Note - 10/24/2018 5:50:55 PM
G - Suffered another loss today on average volume testing its 200 DMA line ($255.40). A subsequent rebound above the 50 DMA line ($283) is needed for its outlook to improve. The prior low ($253.63 on 7/31/18) and 200 DMA line define important near-term support to watch. Reported earnings +54% on +22% sales revenues for the Sep '18 quarter, continuing its strong earnings track record.
>>> FEATURED STOCK ARTICLE : Sank Below 50 DMA Line Ahead of Earnings News - 10/15/2018 |
View all notes |
Set NEW NOTE alert |
Company Profile |
SEC
News |
Chart |
Request a new note
C
A
S
I |
Symbol/Exchange
Company Name
Industry Group |
PRICE |
CHANGE
(%Change) |
Day High |
Volume
(% DAV)
(% 50 day avg vol) |
52 Wk Hi
% From Hi |
Featured
Date |
Price
Featured |
Pivot Featured |
|
Max Buy |
FIVE
-
NASDAQ
Five Below Inc
Retail-DiscountandVariety
|
$110.37
|
-1.79
-1.60% |
$112.34
|
814,255
83.68% of 50 DAV
50 DAV is 973,000
|
$136.13
-18.92%
|
7/6/2018
|
$98.90
|
PP = $104.09
|
|
MB = $109.29
|
Most Recent Note - 10/25/2018 5:59:33 PM
G - A rebound above the 50 DMA line ($120) still is needed for its outlook to improve. Sputtering above the prior high ($109.09 on 7/19/18) which defines the next important support level to watch. See the latest FSU analysis for more details and a new annotated graph.
>>> FEATURED STOCK ARTICLE : Sputtering Below 50-Day Moving Average Near Prior High - 10/25/2018 |
View all notes |
Set NEW NOTE alert |
Company Profile |
SEC
News |
Chart |
Request a new note
C
A
S
I |
NVEE
-
NASDAQ
N V 5 Global Inc
Comml Svcs-Consulting
|
$77.17
|
-1.14
-1.46% |
$78.30
|
192,942
267.98% of 50 DAV
50 DAV is 72,000
|
$92.75
-16.80%
|
6/15/2018
|
$7,070.00
|
PP = $72.00
|
|
MB = $75.60
|
Most Recent Note - 10/26/2018 5:46:25 PM
G - Churned heavy volume today as it suffered another loss. A rebound above the 50 DMA line ($86.17) is needed for its outlook to improve.
>>> FEATURED STOCK ARTICLE : Recently Slumped Below 50-Day Moving Average Line - 10/8/2018 |
View all notes |
Set NEW NOTE alert |
Company Profile |
SEC
News |
Chart |
Request a new note
C
A
S
I |
HQY
-
NASDAQ
Healthequity Inc
COMPUTER SOFTWARE and SERVICES - Healthcare Information Service
|
$85.31
|
-0.02
-0.02% |
$86.33
|
797,776
97.77% of 50 DAV
50 DAV is 816,000
|
$99.99
-14.68%
|
8/13/2018
|
$82.39
|
PP = $83.44
|
|
MB = $87.61
|
Most Recent Note - 10/25/2018 6:00:53 PM
G - Posted a big gain today with higher (but still below average) volume. A rebound above the 50 DMA line ($90.36) is needed for its outlook to improve.
>>> FEATURED STOCK ARTICLE : Below 50-Day Moving Average Which May Act as Resistance - 10/16/2018 |
View all notes |
Set NEW NOTE alert |
Company Profile |
SEC
News |
Chart |
Request a new note
C
A
S
I |
OLLI
-
NASDAQ
Ollie's Bargain Outlet
Retail-DiscountandVariety
|
$88.25
|
-1.26
-1.41% |
$90.22
|
640,969
96.82% of 50 DAV
50 DAV is 662,000
|
$97.61
-9.59%
|
7/12/2018
|
$74.43
|
PP = $77.60
|
|
MB = $81.48
|
Most Recent Note - 10/25/2018 5:52:52 PM
G - Still finding support near the 50 DMA line ($88.40) and above the recent low ($84.66 on 10/11/18). Well above prior highs in the $77 area. Fundamentals remain strong.
>>> FEATURED STOCK ARTICLE : Encountered Distributional Pressure After a Great Rally - 10/9/2018 |
View all notes |
Set NEW NOTE alert |
Company Profile |
SEC
News |
Chart |
Request a new note
C
A
S
I |
|
|
|
THESE ARE NOT BUY RECOMMENDATIONS!
Comments contained in the body of this report are technical
opinions only. The material herein has been obtained
from sources believed to be reliable and accurate, however,
its accuracy and completeness cannot be guaranteed.
This site is not an investment advisor, hence it does
not endorse or recommend any securities or other investments.
Any recommendation contained in this report may not
be suitable for all investors and it is not to be deemed
an offer or solicitation on our part with respect to
the purchase or sale of any securities. All trademarks,
service marks and trade names appearing in this report
are the property of their respective owners, and are
likewise used for identification purposes only.
This report is a service available
only to active Paid Premium Members.
You may opt-out of receiving report notifications
at any time. Questions or comments may be submitted
by writing to Premium Membership Services 665 S.E. 10 Street, Suite 201 Deerfield Beach, FL 33441-5634 or by calling 1-800-965-8307
or 954-785-1121.
|
|
|

