You are not logged in.
This means you
CAN ONLY VIEW reports that were published prior to Tuesday, February 20, 2024.
You
MUST UPGRADE YOUR MEMBERSHIP if you want to see any current reports.
AFTER MARKET UPDATE - THURSDAY, OCTOBER 25TH, 2018
Previous After Market Report Next After Market Report >>>
|
|
|
|
DOW |
+401.13 |
24,984.55 |
+1.63% |
|
Volume |
1,074,321,090 |
-1% |
|
Volume |
2,754,967,200 |
-5% |
|
NASDAQ |
+209.94 |
7,318.34 |
+2.95% |
|
Advancers |
2,178 |
72% |
|
Advancers |
2,173 |
71% |
|
S&P 500 |
+49.47 |
2,705.57 |
+1.86% |
|
Decliners |
829 |
28% |
|
Decliners |
894 |
29% |
|
Russell 2000 |
+31.70 |
1,500.40 |
+2.16% |
|
52 Wk Highs |
11 |
|
|
52 Wk Highs |
23 |
|
|
S&P 600 |
+20.27 |
941.26 |
+2.20% |
|
52 Wk Lows |
305 |
|
|
52 Wk Lows |
284 |
|
|
 |
Major Indices Rose With Lighter Volume Totals
Kenneth J. Gruneisen - Passed the CAN SLIM® Master's Exam
Stocks finished higher Thursday. The Dow climbed 401 points to 24984. The S&P 500 had its best day since March as the index jumped 49 points to 2705. The Nasdaq Composite climbed 209 points to 7318. Volume totals reported were lighter on the NYSE and on the Nasdaq exchange versus the prior session. Advancers led decliners by an 11-4 margin on the NYSE and more than 2-1 on the Nasdaq exchange. There were 6 high-ranked companies from the Leaders List that made new 52-week highs and were listed on the BreakOuts Page, versus 8 on the prior session, as market leadership remained very elusive. New 52-week lows totals easily outnumbered new 52-week highs on the NYSE and Nasdaq exchange. Recent reports have noted that the major indices (M criteria) have shown action indicative of a market correction while leadership disappeared. During market corrections investors should have a bias toward selling stocks on a case-by-case basis as technical sell signals occur, raising cash levels while reducing market exposure. The Featured Stocks Page provides the most timely analysis on high-ranked leaders. Charts used courtesy of www.stockcharts.com
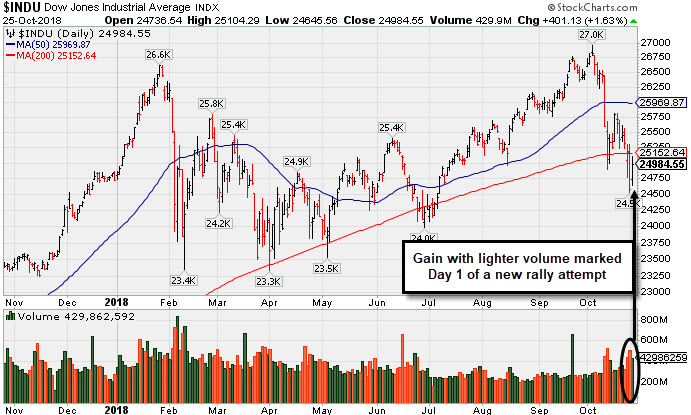
PICTURED: The Dow Jones Industrial Average and other major indices posted gains on Thursday, marking Day 1 of a new rally attempt. Technically, the market remains in a "correction" under the fact-based investment system. Members have been reminded repeatedly that new buying efforts are against the rules until a convincing follow-through day occurs. A "follow-through day" of solid gains (at least +1%) from one or more of the major indices, backed by higher volume, and coupled with a leadership expansion (increase in new 52-week highs), are all of the necessary elements required to confirm a new rally. Until then, patience and discipline are paramount.
The S&P 500 broke a six day losing streak as the Technology and Communications sectors rebounded from Wednesday’s sell-off. Shares of Microsoft (MSFT +5.84%) rose after topping analyst revenue estimates and providing a strong outlook for cloud growth. Twitter (TWTR +15.47%) surged after the social media company topped profit estimates. Consumer Discretionary stocks also outperformed as Tesla (TSLA +9.14%) and Ford (F +9.90%) rallied after both automakers beat Wall Street projections. Amazon (AMZN +7.09%) posted its best day of 2018 as the e-commerce giant rallied. Utilities lagged the broader market advance with the group falling 1.5%.
Not all earnings were positive as shares of Anheuser-Busch (BUD -9.37%) after missing sales forecasts and cutting its dividend by 50%. Elsewhere, Advanced Micro Devices (AMD -15.45%) sank after the chipmaker fell short of revenue projections.
On the data front, pending home sales increased 0.5% month-over-month in September, snapping a four-month losing streak.
Treasuries were little changed as the yield on the 10-year note added one basis point to 3.12%. In commodities, WTI crude gained 0.4% to $67.06/barrel. COMEX gold rose 0.1% to $1,229.10/ounce despite a stronger dollar. |
 Kenneth J. Gruneisen started out as a licensed stockbroker in August 1987, a couple of months prior to the historic stock market crash that took the Dow Jones Industrial Average down -22.6% in a single day. He has published daily fact-based fundamental and technical analysis on high-ranked stocks online for two decades. Through FACTBASEDINVESTING.COM, Kenneth provides educational articles, news, market commentary, and other information regarding proven investment systems that work in good times and bad.
Comments contained in the body of this report are technical opinions only and are not necessarily those of Gruneisen Growth Corp. The material herein has been obtained from sources believed to be reliable and accurate, however, its accuracy and completeness cannot be guaranteed. Our firm, employees, and customers may effect transactions, including transactions contrary to any recommendation herein, or have positions in the securities mentioned herein or options with respect thereto. Any recommendation contained in this report may not be suitable for all investors and it is not to be deemed an offer or solicitation on our part with respect to the purchase or sale of any securities. |
|
 |
Retail, Financial, Tech, and Energy-Linked Groups Rose
Kenneth J. Gruneisen - Passed the CAN SLIM® Master's Exam
The Bank Index ($BKX +2.29%), Broker/Dealer Index ($XBD +1.64%), and Retail Index ($RLX +4.12%) were unanimously higher and lifted the major indices on Thursday. The tech sector also had a positive bias as the Biotech Index ($BTK +3.46%), Semiconductor Index ($SOX +2.34%), and the Networking Index ($NWX +2.23%) each posted solid gains. Commodity-linked groups were mixed as the Integrated Oil Index ($XOI +1.60%) outpaced the Oil Services Index ($OSX +0.31%), but the Gold & Silver Index ($XAU -4.88%) was a standout decliner.
Charts courtesy of www.stockcharts.com
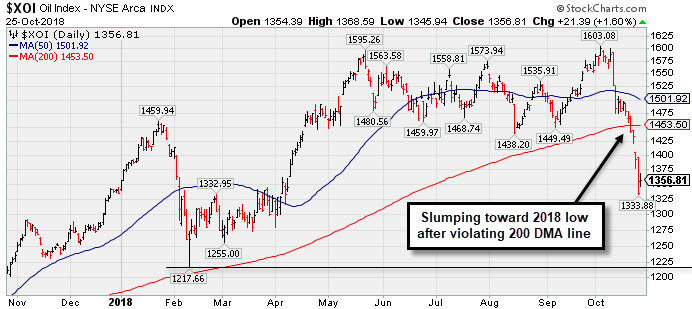 PICTURED: The Integrated Oil Index ($XOI +1.60%) has been slumping toward its 2018 low after violating its 200-day moving average (DMA) line.
| Oil Services |
$OSX |
124.04 |
+0.38 |
+0.31% |
-17.06% |
| Integrated Oil |
$XOI |
1,356.81 |
+21.39 |
+1.60% |
+1.59% |
| Semiconductor |
$SOX |
1,173.21 |
+26.80 |
+2.34% |
-6.37% |
| Networking |
$NWX |
515.46 |
+11.24 |
+2.23% |
+5.08% |
| Broker/Dealer |
$XBD |
251.65 |
+4.06 |
+1.64% |
-5.12% |
| Retail |
$RLX |
2,192.79 |
+86.75 |
+4.12% |
+26.48% |
| Gold & Silver |
$XAU |
64.72 |
-3.32 |
-4.88% |
-24.10% |
| Bank |
$BKX |
96.02 |
+2.15 |
+2.29% |
-10.02% |
| Biotech |
$BTK |
4,586.18 |
+153.43 |
+3.46% |
+8.62% |
|
|
|
 |
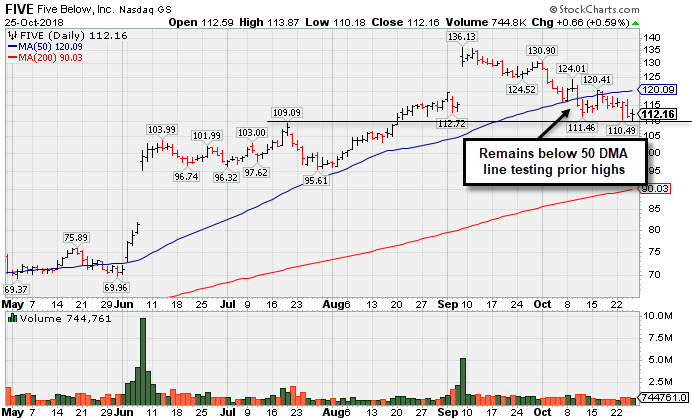
Sputtering Below 50-Day Moving Average Near Prior High
Kenneth J. Gruneisen - Passed the CAN SLIM® Master's Exam
Five Below Inc (FIVE +$0.66 or +0.59% to $112.16) is still sputtering below its 50-day moving average (DMA) line ($120.09). A rebound above the 50 DMA line is needed for its outlook to improve. The prior high ($109.09 on 7/19/18) defines the next important support level to watch.
Earnings rose +40% on +23% sales revenues for the Jul '18 quarter, continuing its strong earnings track record as 9 of the past 10 quarterly comparisons versus the year ago periods showed earnings increases above the +25% minimum guideline (C criteria). The Retail - Discount & Variety firm has a 98 Earnings Per Share Rating and matches the fact-based investment system's winning models with a good annual earnings (A criteria) track record.
Its current Up/Down Volume Ratio of 1.4 is an unbiased indication its shares have been under accumulation over the past 50 days. Its current Timeliness Rating is A and its Sponsorship Rating is B. FIVE was last shown in this FSU section on 10/02/18 with an annotated graph under the headline, "Retreating After +138% Rally in Under 12 Months". It traded up as much as +138% since highlighted in yellow with new pivot point cited based on its 5/19/17 high plus 10 cents in the 10/06/17 mid-day report (read here).
FIVE had a choppy history since its $17 IPO in July 2012 and 3 subsequent Secondary Offerings. It still has a small supply of 55.7 million shares outstanding (S criteria), which can lead to greater price volatility in the event of institutional buying or selling. The number of top-rated funds owning its shares rose from 465 in Sep '17 to 590 in Sep '18, a reassuring sign concerning the I criteria.
|
|
|
Color Codes Explained :
Y - Better candidates highlighted by our
staff of experts.
G - Previously featured
in past reports as yellow but may no longer be buyable under the
guidelines.
***Last / Change / Volume data in this table is the closing quote data***
Symbol/Exchange
Company Name
Industry Group |
PRICE |
CHANGE
(%Change) |
Day High |
Volume
(% DAV)
(% 50 day avg vol) |
52 Wk Hi
% From Hi |
Featured
Date |
Price
Featured |
Pivot Featured |
|
Max Buy |
MPX
-
NYSE
Marine Products Corp
AUTOMOTIVE - Recreational Vehicles
|
$21.42
|
+0.42
2.00% |
$22.01
|
45,711
126.98% of 50 DAV
50 DAV is 36,000
|
$24.82
-13.70%
|
10/24/2018
|
$23.00
|
PP = $24.92
|
|
MB = $26.17
|
Most Recent Note - 10/24/2018 5:48:48 PM
Y - Finished weak after highlighted in yellow with pivot point cited based on its 9/12/18 high plus 10 cents in the earlier mid-day report. Gapped up today and challenged its all-time high before reversing into the red and violating its 50 DMA line ($20.16). Subsequent gains above the pivot point backed by at least +40% above average volume are needed to trigger a technical buy signal. Disciplined investors know that new buying efforts in stocks are discouraged until a follow-through day confirms a new rally (M criteria is covered in bold in the FACTBASEDINVESTING.com Market Commentary). Reported earnings +62% on +22% sales revenues for the Sep '18 quarter, so the past 4 quarterly comparisons were above the +25% minimum earnings guideline (C criteria). Small supply of only 7.3 million shares (S criteria) in the public float. See the latest FSU analysis for more details and a new annotated graph.
>>> FEATURED STOCK ARTICLE : Weak Finish Amid Widely Negative Market Environment - 10/24/2018 |
View all notes |
Set NEW NOTE alert |
Company Profile |
SEC
News |
Chart |
Request a new note
C
A
S
I |
GMED
-
NYSE
Globus Medical Inc Cl A
CHEMICALS - Specialty Chemicals
|
$52.45
|
+0.70
1.35% |
$52.59
|
480,824
74.55% of 50 DAV
50 DAV is 645,000
|
$57.55
-8.86%
|
9/26/2018
|
$56.11
|
PP = $57.65
|
|
MB = $60.53
|
 Most Recent Note - 10/25/2018 5:54:22 PM
G - Sputtering below its 50 DMA line ($52.91) after recent volume-driven losses hurt its outlook. A rebound and subsequent gains above the pivot point backed by more than +40% above average volume are needed to trigger a proper technical buy signal.
>>> FEATURED STOCK ARTICLE : Consolidating After Rally at 200-Day Moving Average Line - 10/22/2018 |
View all notes |
Set NEW NOTE alert |
Company Profile |
SEC
News |
Chart |
Request a new note
C
A
S
I |
ZBRA
-
NASDAQ
Zebra Tech Corp Cl A
COMPUTER HARDWARE - Computer Peripherals
|
$162.90
|
+3.16
1.98% |
$163.80
|
398,907
104.43% of 50 DAV
50 DAV is 382,000
|
$179.47
-9.23%
|
8/7/2018
|
$164.26
|
PP = $161.82
|
|
MB = $169.91
|
Most Recent Note - 10/24/2018 5:46:49 PM
G - Suffered a damaging volume-driven loss today. It met resistance after rebounding to its 50 DMA line ($168.41). Overhead supply remains up to the $179 level. Found support in recent weeks after a pullback near its 200 DMA line. See the latest FSU analysis for more details and an annotated graph.
>>> FEATURED STOCK ARTICLE : Zebra Tech Sputtering Near 50-Day Moving Average - 10/23/2018 |
View all notes |
Set NEW NOTE alert |
Company Profile |
SEC
News |
Chart |
Request a new note
C
A
S
I |
CME
-
NASDAQ
C M E Group Inc
DIVERSIFIED SERVICES - Business/Management Services
|
$177.47
|
-3.61
-1.99% |
$182.32
|
2,929,452
201.75% of 50 DAV
50 DAV is 1,452,000
|
$183.79
-3.44%
|
10/4/2018
|
$179.29
|
PP = $177.45
|
|
MB = $186.32
|
Most Recent Note - 10/25/2018 5:57:47 PM
Y - Reported earnings +22% on +2% sales revenues for the Sep '18 quarter, below the +25% minimum earnings guideline (C criteria), raising fundamental concerns. Pulled back from its all-time high with a volume-driven loss today. Broad market weakness (M criteria) remains a concern. The 50 DMA line ($174.59) and prior low ($170.04 on 9/28/18) define important near-term support.
>>> FEATURED STOCK ARTICLE : CME Group Blasted to New Record High - 10/4/2018 |
View all notes |
Set NEW NOTE alert |
Company Profile |
SEC
News |
Chart |
Request a new note
C
A
S
I |
DPZ
-
NYSE
Dominos Pizza Inc
Retail-Restaurants
|
$261.77
|
+6.28
2.46% |
$263.07
|
532,515
95.43% of 50 DAV
50 DAV is 558,000
|
$305.34
-14.27%
|
8/13/2018
|
$288.60
|
PP = $293.91
|
|
MB = $308.61
|
Most Recent Note - 10/24/2018 5:50:55 PM
G - Suffered another loss today on average volume testing its 200 DMA line ($255.40). A subsequent rebound above the 50 DMA line ($283) is needed for its outlook to improve. The prior low ($253.63 on 7/31/18) and 200 DMA line define important near-term support to watch. Reported earnings +54% on +22% sales revenues for the Sep '18 quarter, continuing its strong earnings track record.
>>> FEATURED STOCK ARTICLE : Sank Below 50 DMA Line Ahead of Earnings News - 10/15/2018 |
View all notes |
Set NEW NOTE alert |
Company Profile |
SEC
News |
Chart |
Request a new note
C
A
S
I |
Symbol/Exchange
Company Name
Industry Group |
PRICE |
CHANGE
(%Change) |
Day High |
Volume
(% DAV)
(% 50 day avg vol) |
52 Wk Hi
% From Hi |
Featured
Date |
Price
Featured |
Pivot Featured |
|
Max Buy |
FIVE
-
NASDAQ
Five Below Inc
Retail-DiscountandVariety
|
$112.16
|
+0.66
0.59% |
$113.87
|
744,761
76.86% of 50 DAV
50 DAV is 969,000
|
$136.13
-17.61%
|
7/6/2018
|
$98.90
|
PP = $104.09
|
|
MB = $109.29
|
Most Recent Note - 10/25/2018 5:59:33 PM
G - A rebound above the 50 DMA line ($120) still is needed for its outlook to improve. Sputtering above the prior high ($109.09 on 7/19/18) which defines the next important support level to watch. See the latest FSU analysis for more details and a new annotated graph.
>>> FEATURED STOCK ARTICLE : Sputtering Below 50-Day Moving Average Near Prior High - 10/25/2018 |
View all notes |
Set NEW NOTE alert |
Company Profile |
SEC
News |
Chart |
Request a new note
C
A
S
I |
NVEE
-
NASDAQ
N V 5 Global Inc
Comml Svcs-Consulting
|
$78.31
|
+0.65
0.84% |
$79.57
|
74,269
103.15% of 50 DAV
50 DAV is 72,000
|
$92.75
-15.57%
|
6/15/2018
|
$7,070.00
|
PP = $72.00
|
|
MB = $75.60
|
Most Recent Note - 10/24/2018 5:41:50 PM
G - Violated the recent low ($80.73 on 10/11/18) and finished near the session low with a big loss today triggering another technical sell signal. A rebound above the 50 DMA line ($86.39) is needed for its outlook to improve.
>>> FEATURED STOCK ARTICLE : Recently Slumped Below 50-Day Moving Average Line - 10/8/2018 |
View all notes |
Set NEW NOTE alert |
Company Profile |
SEC
News |
Chart |
Request a new note
C
A
S
I |
HQY
-
NASDAQ
Healthequity Inc
COMPUTER SOFTWARE and SERVICES - Healthcare Information Service
|
$85.33
|
+4.66
5.78% |
$85.64
|
668,779
82.57% of 50 DAV
50 DAV is 810,000
|
$99.99
-14.66%
|
8/13/2018
|
$82.39
|
PP = $83.44
|
|
MB = $87.61
|
Most Recent Note - 10/25/2018 6:00:53 PM
G - Posted a big gain today with higher (but still below average) volume. A rebound above the 50 DMA line ($90.36) is needed for its outlook to improve.
>>> FEATURED STOCK ARTICLE : Below 50-Day Moving Average Which May Act as Resistance - 10/16/2018 |
View all notes |
Set NEW NOTE alert |
Company Profile |
SEC
News |
Chart |
Request a new note
C
A
S
I |
OLLI
-
NASDAQ
Ollie's Bargain Outlet
Retail-DiscountandVariety
|
$89.51
|
+1.71
1.95% |
$90.14
|
644,666
97.82% of 50 DAV
50 DAV is 659,000
|
$97.61
-8.30%
|
7/12/2018
|
$74.43
|
PP = $77.60
|
|
MB = $81.48
|
Most Recent Note - 10/25/2018 5:52:52 PM
G - Still finding support near the 50 DMA line ($88.40) and above the recent low ($84.66 on 10/11/18). Well above prior highs in the $77 area. Fundamentals remain strong.
>>> FEATURED STOCK ARTICLE : Encountered Distributional Pressure After a Great Rally - 10/9/2018 |
View all notes |
Set NEW NOTE alert |
Company Profile |
SEC
News |
Chart |
Request a new note
C
A
S
I |
|
|
|
THESE ARE NOT BUY RECOMMENDATIONS!
Comments contained in the body of this report are technical
opinions only. The material herein has been obtained
from sources believed to be reliable and accurate, however,
its accuracy and completeness cannot be guaranteed.
This site is not an investment advisor, hence it does
not endorse or recommend any securities or other investments.
Any recommendation contained in this report may not
be suitable for all investors and it is not to be deemed
an offer or solicitation on our part with respect to
the purchase or sale of any securities. All trademarks,
service marks and trade names appearing in this report
are the property of their respective owners, and are
likewise used for identification purposes only.
This report is a service available
only to active Paid Premium Members.
You may opt-out of receiving report notifications
at any time. Questions or comments may be submitted
by writing to Premium Membership Services 665 S.E. 10 Street, Suite 201 Deerfield Beach, FL 33441-5634 or by calling 1-800-965-8307
or 954-785-1121.
|
|
|