You are not logged in.
This means you
CAN ONLY VIEW reports that were published prior to Monday, February 19, 2024.
You
MUST UPGRADE YOUR MEMBERSHIP if you want to see any current reports.
AFTER MARKET UPDATE - TUESDAY, OCTOBER 23RD, 2018
Previous After Market Report Next After Market Report >>>
|
|
|
|
DOW |
-125.98 |
25,191.43 |
-0.50% |
|
Volume |
973,744,470 |
+30% |
|
Volume |
2,723,748,300 |
+20% |
|
NASDAQ |
-31.09 |
7,437.54 |
-0.42% |
|
Advancers |
929 |
31% |
|
Advancers |
987 |
32% |
|
S&P 500 |
-15.19 |
2,740.69 |
-0.55% |
|
Decliners |
2,090 |
69% |
|
Decliners |
2,105 |
68% |
|
Russell 2000 |
-12.91 |
1,526.59 |
-0.84% |
|
52 Wk Highs |
8 |
|
|
52 Wk Highs |
14 |
|
|
S&P 600 |
-7.49 |
954.45 |
-0.78% |
|
52 Wk Lows |
497 |
|
|
52 Wk Lows |
511 |
|
|
 |
New Lows Trounce New Highs as Market Correction Continues
Kenneth J. Gruneisen - Passed the CAN SLIM® Master's Exam
Stocks finished lower on Tuesday. The Dow fell 125 points to 25,191 while the S&P 500 lost 15 points to 2,740. The Nasdaq Composite slipped 31 points to 7,437. Volume totals reported were higher on the NYSE and on the Nasdaq exchange versus the prior session, indicative of more distributional pressure. Decliners outnumbered advancers by a 2-1 margin on the NYSE and on the Nasdaq exchange. There were only 2 high-ranked companies from the Leaders List that made new 52-week highs and were listed on the BreakOuts Page, versus 3 on the prior session, as market leadership remained very elusive. New 52-week lows totals expanded again and easily outnumbered new 52-week highs on the NYSE and Nasdaq exchange. Recent reports have noted that the major indices (M criteria) have shown action indicative of a market correction while leadership disappeared. During market corrections investors should have a bias toward selling stocks on a case-by-case basis as technical sell signals occur, raising cash levels while reducing market exposure. The Featured Stocks Page provides the most timely analysis on high-ranked leaders. Charts used courtesy of www.stockcharts.com
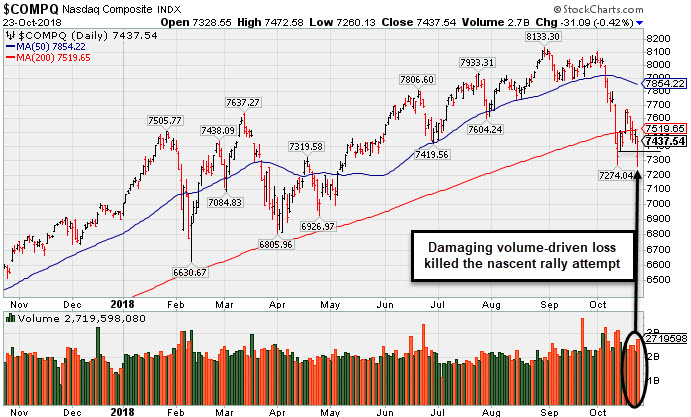
PICTURED: The Nasdaq Composite Index and other major indices today undercut the lows from both October 11th and 12th, the later of which has been noted as Day 1 of the recent rally attempt. Technically, the market remains in a "correction" under the fact-based investment system. Members have been reminded again that new buying efforts are against the rules and discouraged until a convincing follow-through day occurs. A "follow-through day" of solid gains (at least +1%) from one or more of the major indices, backed by higher volume, and coupled with a leadership expansion (increase in new 52-week highs), are all of the necessary elements required to confirm a new rally. Until then, patience and discipline are paramount.
The S&P 500 declined for the 12th time in 14 sessions as investors digested disappointing earnings results from the Industrial sector and lingering geopolitical concerns ranging from Italy to China. At session lows, the Dow was off more than 500 points while the Nasdaq dipped into correction territory, but equities staged an afternoon rally that pared most of the losses.
Eight of 11 sectors finished lower with Energy shares pacing the decline. The group fell 2.7% on the session in sympathy with a 4.4% drop in West Texas Intermediate crude prices. Industrials also lagged with Caterpillar (CAT -7.6%) down as the company warned of rising materials costs in its quarterly release. 3M (MMM -4.38%) fell after missing analyst profit projections and lowering forward guidance. Communications shares outperformed with Verizon (VZ +4.06%) rose, the highest level since 2000, after posting strong subscriber growth. Another bright spot was McDonald’s (MCD +6.31%) after topping same-store sales expectations.
Treasuries were modestly higher along the curve with the yield on the 10-year note finishing two basis points lower to 3.17%. COMEX gold added 1% to $1,233.40/ounce. |
 Kenneth J. Gruneisen started out as a licensed stockbroker in August 1987, a couple of months prior to the historic stock market crash that took the Dow Jones Industrial Average down -22.6% in a single day. He has published daily fact-based fundamental and technical analysis on high-ranked stocks online for two decades. Through FACTBASEDINVESTING.COM, Kenneth provides educational articles, news, market commentary, and other information regarding proven investment systems that work in good times and bad.
Comments contained in the body of this report are technical opinions only and are not necessarily those of Gruneisen Growth Corp. The material herein has been obtained from sources believed to be reliable and accurate, however, its accuracy and completeness cannot be guaranteed. Our firm, employees, and customers may effect transactions, including transactions contrary to any recommendation herein, or have positions in the securities mentioned herein or options with respect thereto. Any recommendation contained in this report may not be suitable for all investors and it is not to be deemed an offer or solicitation on our part with respect to the purchase or sale of any securities. |
|
 |
Gold & Silver Index Posts Small Gain Amid Broader Weakness
Kenneth J. Gruneisen - Passed the CAN SLIM® Master's Exam
The Bank Index ($BKX -0.33%), Broker/Dealer Index ($XBD -0.84%), and Retail Index ($RLX -0.75%) were unanimously lower and created a drag on the major indices on Tuesday. The tech sector also had a negative bias as the Biotech Index ($BTK -0.30%), Semiconductor Index ($SOX -0.53%), and the Networking Index ($NWX -0.79%) each lost ground. Commodity-linked groups were mixed. Weakness in energy-linked groups made the Integrated Oil Index ($XOI -2.90%) and Oil Services Index ($OSX -3.71%) standout decliners. The Gold & Silver Index ($XAU +0.68%) ended higher.
Charts courtesy of www.stockcharts.com
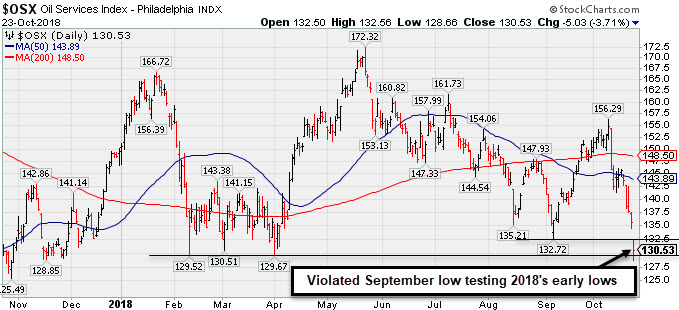 PICTURED: The Oil Services Index ($OSX -3.71%) violated its September low testing 2018's early lows.
| Oil Services |
$OSX |
130.53 |
-5.03 |
-3.71% |
-12.72% |
| Integrated Oil |
$XOI |
1,392.19 |
-41.61 |
-2.90% |
+4.24% |
| Semiconductor |
$SOX |
1,227.61 |
-6.59 |
-0.53% |
-2.03% |
| Networking |
$NWX |
517.96 |
-4.12 |
-0.79% |
+5.59% |
| Broker/Dealer |
$XBD |
256.44 |
-2.18 |
-0.84% |
-3.32% |
| Retail |
$RLX |
2,186.74 |
-16.53 |
-0.75% |
+26.13% |
| Gold & Silver |
$XAU |
69.50 |
+0.46 |
+0.67% |
-18.49% |
| Bank |
$BKX |
96.75 |
-0.33 |
-0.34% |
-9.33% |
| Biotech |
$BTK |
4,776.34 |
-14.14 |
-0.30% |
+13.12% |
|
|
|
 |
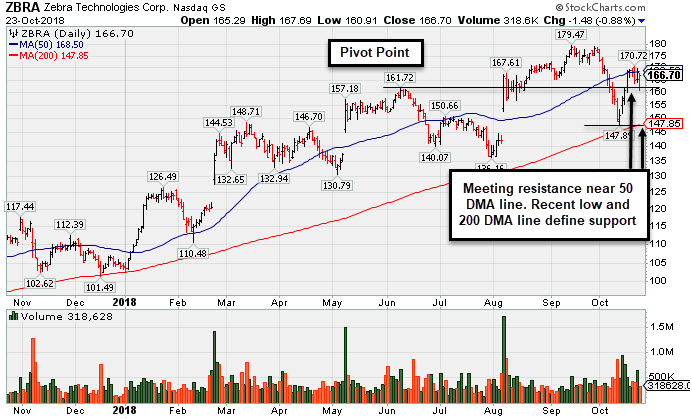
Zebra Tech Sputtering Near 50-Day Moving Average
Kenneth J. Gruneisen - Passed the CAN SLIM® Master's Exam
Zebra Tech Corp Cl A (ZBRA -$1.48 or -0.88% to $166.70) is consolidating near its 50-day moving average (DMA) line ($168.50). The recent low ($147.89 on 10/11/18) defines near term support along with its 200 DMA line. It faces very little near-term resistance due to overhead supply up to $179.
Fundamentals remain strong. Its next earnings report is due on 11/05/18. Volume and volatility often increase near earnings news. Recently it reported Jun '18 earnings +64% on +13% sales revenues. Three of the past 4 quarters showed earnings increases above the +25% minimum guideline (C criteria). Recent sequential comparisons show encouraging sales revenues acceleration. Annual earnings (A criteria) history has been strong since a downturn in FY '08 and '09.
ZBRA found support near its 200 DMA line after enduring damaging distributional pressure since last shown in this FSU section on 9/24/18 with an annotated graph under the headline, "Hovering Near All-Time High With Strong Fundamentals". It was highlighted in yellow with pivot point cited based on its 6/08/18 high plus 10 cents in the 8/07/18 mid-day report (read here). It gapped up hitting a new all-time high with a big gain backed by +337% above average volume.
The number of top-rated funds owning its shares from 553 in Sep '17 to 692 in Sep '18, a reassuring sign concerning the I criteria. Its current Up/Down Volume Ratio of 1.4 is an unbiased indication its shares have been under accumulation over the past 50 days. It has earned an A Timeliness Rating and a B Sponsorship Rating. There are 53.7 million shares outstanding (S criteria) which can contribute to greater price volatility in the event of institutional buying or selling.
|
|
|
Color Codes Explained :
Y - Better candidates highlighted by our
staff of experts.
G - Previously featured
in past reports as yellow but may no longer be buyable under the
guidelines.
***Last / Change / Volume data in this table is the closing quote data***
Symbol/Exchange
Company Name
Industry Group |
PRICE |
CHANGE
(%Change) |
Day High |
Volume
(% DAV)
(% 50 day avg vol) |
52 Wk Hi
% From Hi |
Featured
Date |
Price
Featured |
Pivot Featured |
|
Max Buy |
SIVB
-
NASDAQ
S V B Financial Group
BANKING - Regional - Pacific Banks
|
$273.31
|
-3.75
-1.35% |
$275.50
|
948,066
221.51% of 50 DAV
50 DAV is 428,000
|
$333.74
-18.11%
|
8/6/2018
|
$314.77
|
PP = $329.75
|
|
MB = $346.24
|
 Most Recent Note - 10/23/2018 5:17:56 PM
It will be dropped from the Featured Stocks list tonight after a streak of damaging volume-driven losses below its 200 DMA. A rebound above the 50 DMA line ($314) is needed for its outlook to improve.
>>> FEATURED STOCK ARTICLE : Weak Action Amid Broader Market Declines - 10/11/2018 |
View all notes |
Set NEW NOTE alert |
Company Profile |
SEC
News |
Chart |
Request a new note
C
A
S
I |
GMED
-
NYSE
Globus Medical Inc Cl A
CHEMICALS - Specialty Chemicals
|
$52.98
|
-0.26
-0.49% |
$53.28
|
819,590
134.14% of 50 DAV
50 DAV is 611,000
|
$57.55
-7.94%
|
9/26/2018
|
$56.11
|
PP = $57.65
|
|
MB = $60.53
|
Most Recent Note - 10/19/2018 6:36:52 PM
G - Color code is changed to green after slumping back below its 50 DMA line ($52.88) with a volume-driven loss today hurting its outlook. A rebound and subsequent gains above the pivot point backed by more than +40% above average volume are needed to trigger a proper technical buy signal.
>>> FEATURED STOCK ARTICLE : Consolidating After Rally at 200-Day Moving Average Line - 10/22/2018 |
View all notes |
Set NEW NOTE alert |
Company Profile |
SEC
News |
Chart |
Request a new note
C
A
S
I |
ZBRA
-
NASDAQ
Zebra Tech Corp Cl A
COMPUTER HARDWARE - Computer Peripherals
|
$166.70
|
-1.48
-0.88% |
$167.69
|
318,406
84.01% of 50 DAV
50 DAV is 379,000
|
$179.47
-7.12%
|
8/7/2018
|
$164.26
|
PP = $161.82
|
|
MB = $169.91
|
Most Recent Note - 10/23/2018 5:15:37 PM
G - Little overhead supply remains up to the $179 level, but it has been meeting resistance after rebounding to its 50 DMA line ($168.50). Found support in recent weeks after a pullback near its 200 DMA line. See the latest FSU analysis for more details and a new annotated graph.
>>> FEATURED STOCK ARTICLE : Zebra Tech Sputtering Near 50-Day Moving Average - 10/23/2018 |
View all notes |
Set NEW NOTE alert |
Company Profile |
SEC
News |
Chart |
Request a new note
C
A
S
I |
CME
-
NASDAQ
C M E Group Inc
DIVERSIFIED SERVICES - Business/Management Services
|
$180.80
|
-0.42
-0.23% |
$181.87
|
1,475,723
102.98% of 50 DAV
50 DAV is 1,433,000
|
$183.79
-1.63%
|
10/4/2018
|
$179.29
|
PP = $177.45
|
|
MB = $186.32
|
Most Recent Note - 10/22/2018 5:44:26 PM
Y - Remains perched near at its all-time high despite broad market weakness (M criteria). The 50 DMA line ($173.76) and prior lows define important near-term support.
>>> FEATURED STOCK ARTICLE : CME Group Blasted to New Record High - 10/4/2018 |
View all notes |
Set NEW NOTE alert |
Company Profile |
SEC
News |
Chart |
Request a new note
C
A
S
I |
MA
-
NYSE
Mastercard Inc Cl A
Finance-CrdtCard/PmtPr
|
$202.43
|
-2.07
-1.01% |
$203.73
|
4,345,459
120.64% of 50 DAV
50 DAV is 3,602,000
|
$225.35
-10.17%
|
7/11/2018
|
$203.84
|
PP = $204.10
|
|
MB = $214.31
|
Most Recent Note - 10/22/2018 6:08:14 PM
G - A rebound above the 50 DMA line ($211) still is needed for its outlook to improve. Recently found support above its 200 DMA line ($191).
>>> FEATURED STOCK ARTICLE : Hovering Near High, Extended From Any Sound Base - 9/27/2018 |
View all notes |
Set NEW NOTE alert |
Company Profile |
SEC
News |
Chart |
Request a new note
C
A
S
I |
Symbol/Exchange
Company Name
Industry Group |
PRICE |
CHANGE
(%Change) |
Day High |
Volume
(% DAV)
(% 50 day avg vol) |
52 Wk Hi
% From Hi |
Featured
Date |
Price
Featured |
Pivot Featured |
|
Max Buy |
V
-
NYSE
Visa Inc Cl A
Finance-CrdtCard/PmtPr
|
$139.12
|
-1.52
-1.08% |
$140.04
|
10,659,721
134.86% of 50 DAV
50 DAV is 7,904,000
|
$151.56
-8.21%
|
4/26/2018
|
$126.68
|
PP = $126.98
|
|
MB = $133.33
|
Most Recent Note - 10/22/2018 6:06:47 PM
G - Volume totals have been cooling and a rebound above the 50 DMA line ($144) still is needed for its outlook to improve. Found support after slumping near its 200 DMA line ($132).
>>> FEATURED STOCK ARTICLE : Rebounding Toward 50-Day Moving Average - 10/17/2018 |
View all notes |
Set NEW NOTE alert |
Company Profile |
SEC
News |
Chart |
Request a new note
C
A
S
I |
DPZ
-
NYSE
Dominos Pizza Inc
Retail-Restaurants
|
$265.82
|
-1.93
-0.72% |
$266.50
|
587,160
104.66% of 50 DAV
50 DAV is 561,000
|
$305.34
-12.94%
|
8/13/2018
|
$288.60
|
PP = $293.91
|
|
MB = $308.61
|
Most Recent Note - 10/22/2018 5:59:15 PM
G - Found support last week after testing near its 200 DMA line ($254). A subsequent rebound above the 50 DMA line ($285) still is needed for its outlook to improve. The prior low ($253.63 on 7/31/18) and 200 DMA line define important near-term support to watch. Reported earnings +54% on +22% sales revenues for the Sep '18 quarter, continuing its strong earnings track record.
>>> FEATURED STOCK ARTICLE : Sank Below 50 DMA Line Ahead of Earnings News - 10/15/2018 |
View all notes |
Set NEW NOTE alert |
Company Profile |
SEC
News |
Chart |
Request a new note
C
A
S
I |
FIVE
-
NASDAQ
Five Below Inc
Retail-DiscountandVariety
|
$116.01
|
-0.17
-0.15% |
$116.37
|
793,229
82.80% of 50 DAV
50 DAV is 958,000
|
$136.13
-14.78%
|
7/6/2018
|
$98.90
|
PP = $104.09
|
|
MB = $109.29
|
Most Recent Note - 10/22/2018 6:01:16 PM
G - Quietly sputtering below its 50 DMA line ($119.61), and a rebound is needed for its outlook to improve. The prior high ($109.09 on 7/19/18) defines the next important support level to watch.
>>> FEATURED STOCK ARTICLE : Retreating After +138% Rally in Under 12 Months - 10/2/2018 |
View all notes |
Set NEW NOTE alert |
Company Profile |
SEC
News |
Chart |
Request a new note
C
A
S
I |
NVEE
-
NASDAQ
N V 5 Global Inc
Comml Svcs-Consulting
|
$83.13
|
-0.10
-0.12% |
$83.45
|
41,177
57.19% of 50 DAV
50 DAV is 72,000
|
$92.75
-10.37%
|
6/15/2018
|
$7,070.00
|
PP = $72.00
|
|
MB = $75.60
|
Most Recent Note - 10/22/2018 5:51:45 PM
G - Volume totals have been cooling while still quietly sputtering below its 50 DMA line. The recent low ($80.73 on 10/11/18) defines important near-term support to watch. A rebound above the 50 DMA line ($86.54) is needed for its outlook to improve.
>>> FEATURED STOCK ARTICLE : Recently Slumped Below 50-Day Moving Average Line - 10/8/2018 |
View all notes |
Set NEW NOTE alert |
Company Profile |
SEC
News |
Chart |
Request a new note
C
A
S
I |
HQY
-
NASDAQ
Healthequity Inc
COMPUTER SOFTWARE and SERVICES - Healthcare Information Service
|
$85.84
|
-1.66
-1.90% |
$86.36
|
472,014
58.78% of 50 DAV
50 DAV is 803,000
|
$99.99
-14.15%
|
8/13/2018
|
$82.39
|
PP = $83.44
|
|
MB = $87.61
|
Most Recent Note - 10/22/2018 6:03:16 PM
G - Still sputtering below its 50 DMA line ($90.37) which may act as resistance. Found recent support near prior highs in the $82-83 area, but more damaging losses would raise serious concerns.
>>> FEATURED STOCK ARTICLE : Below 50-Day Moving Average Which May Act as Resistance - 10/16/2018 |
View all notes |
Set NEW NOTE alert |
Company Profile |
SEC
News |
Chart |
Request a new note
C
A
S
I |
Symbol/Exchange
Company Name
Industry Group |
PRICE |
CHANGE
(%Change) |
Day High |
Volume
(% DAV)
(% 50 day avg vol) |
52 Wk Hi
% From Hi |
Featured
Date |
Price
Featured |
Pivot Featured |
|
Max Buy |
OLLI
-
NASDAQ
Ollie's Bargain Outlet
Retail-DiscountandVariety
|
$88.81
|
-1.27
-1.41% |
$89.60
|
559,184
86.03% of 50 DAV
50 DAV is 650,000
|
$97.61
-9.02%
|
7/12/2018
|
$74.43
|
PP = $77.60
|
|
MB = $81.48
|
Most Recent Note - 10/19/2018 6:35:06 PM
G - The 50 DMA line ($87) and recent low ($84.66 on 10/11/18) define near-term support well above prior highs in the $77 area. Fundamentals remain strong.
>>> FEATURED STOCK ARTICLE : Encountered Distributional Pressure After a Great Rally - 10/9/2018 |
View all notes |
Set NEW NOTE alert |
Company Profile |
SEC
News |
Chart |
Request a new note
C
A
S
I |
|
|
|
THESE ARE NOT BUY RECOMMENDATIONS!
Comments contained in the body of this report are technical
opinions only. The material herein has been obtained
from sources believed to be reliable and accurate, however,
its accuracy and completeness cannot be guaranteed.
This site is not an investment advisor, hence it does
not endorse or recommend any securities or other investments.
Any recommendation contained in this report may not
be suitable for all investors and it is not to be deemed
an offer or solicitation on our part with respect to
the purchase or sale of any securities. All trademarks,
service marks and trade names appearing in this report
are the property of their respective owners, and are
likewise used for identification purposes only.
This report is a service available
only to active Paid Premium Members.
You may opt-out of receiving report notifications
at any time. Questions or comments may be submitted
by writing to Premium Membership Services 665 S.E. 10 Street, Suite 201 Deerfield Beach, FL 33441-5634 or by calling 1-800-965-8307
or 954-785-1121.
|
|
|