You are not logged in.
This means you
CAN ONLY VIEW reports that were published prior to Sunday, February 25, 2024.
You
MUST UPGRADE YOUR MEMBERSHIP if you want to see any current reports.
AFTER MARKET UPDATE - TUESDAY, OCTOBER 22ND, 2019
Previous After Market Report Next After Market Report >>>
|
|
|
|
DOW |
-39.54 |
26,788.10 |
-0.15% |
|
Volume |
752,353,490 |
-3% |
|
Volume |
1,827,362,526 |
+5% |
|
NASDAQ |
-58.69 |
8,104.30 |
-0.72% |
|
Advancers |
1,678 |
59% |
|
Advancers |
1,454 |
48% |
|
S&P 500 |
-10.73 |
2,995.99 |
-0.36% |
|
Decliners |
1,176 |
41% |
|
Decliners |
1,601 |
52% |
|
Russell 2000 |
+0.73 |
1,550.87 |
+0.05% |
|
52 Wk Highs |
175 |
|
|
52 Wk Highs |
109 |
|
|
S&P 600 |
+2.56 |
961.41 |
+0.27% |
|
52 Wk Lows |
28 |
|
|
52 Wk Lows |
79 |
|
|
 |
Major Indices Fell as Earnings News Failed to Inspire Buying Demand
Kenneth J. Gruneisen - Passed the CAN SLIM® Master's Exam
The Dow lost 39 points, while the S&P 500 declined 0.4%. The Nasdaq Composite was down 0.7%. Volume totals reported were mixed, higher than the prior session total on the Nasdaq exchange and lighter on the NYSE. Advancers led decliners by a 4-3 margin on the NYSE but decliners narrowly outnumbered advancers on the Nasdaq exchange. There were 63 high-ranked companies from the Leaders List that hit a new 52-week high and were listed on the BreakOuts Page, versus the total of 80 on the prior session. New 52-week highs outnumbered new 52-week lows on the NYSE and on the Nasdaq exchange. The major indices (M criteria) are in a "confirmed uptrend" after enduring distributional pressure in recent weeks. The Featured Stocks Page provides the most timely analysis on high-ranked leaders. Charts used courtesy of www.stockcharts.com
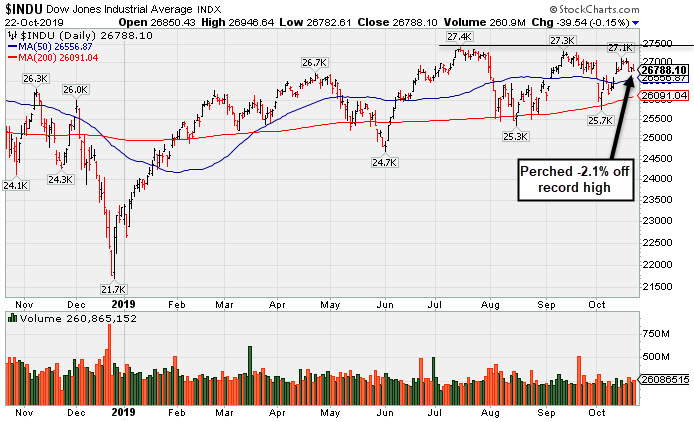
PICTURED: The Dow Jones Industrial Average is above its 50-day moving average (DMA) line and perched only -2.1% off its record high hit on 7/16/19. Its 200 DMA line and prior lows define important near-term support.
Stocks finished lower Tuesday, as investors digested a slew of corporate news and third-quarter earnings results. In corporate news, Facebook (FB -3.91%) fell amid increasing antitrust concerns, while Netflix (NFLX -4.09%) slid on increasing competition worries. Boeing (BA +1.79%) rose despite a credit outlook downgrade by S&P Global Ratings. Earnings results also dominated headlines, with nearly a fifth of the S&P 500 companies reporting this week. Procter & Gamble (PG +2.60%) rose after topping analyst estimates amid strength in its premium beauty brands. McDonald’s (MCD -5.04%) fell following disappointing quarterly figures that included weak same-store sales growth. United Technologies (UTX +2.21%) rose after the industrial conglomerate exceeded consensus earnings and revenue expectations and lifted its full-year guidance. Travelers (TRV -8.29%) fell following disappointing quarterly results. Biogen (BIIB +26.11%) after announcing plans to file for FDA approval for its Alzheimer’s treatment drug.
On the data front, existing home sales slipped 2.2% in September following an upwardly revised 1.5% gain the prior month. A separate update showed manufacturing activity in the Richmond Fed region improved in October. Treasuries advanced, with the yield on the 10-year note down four basis points to 1.76%. In commodities, WTI crude climbed 1.6% to $54.16/barrel amid reports that OPEC and its allies would contemplate deeper supply cuts.
In geopolitical news, Prime Minister Boris Johnson’s Brexit bill lost a key Parliamentary vote, sending the British pound lower. Meanwhile, positive comments from China’s vice foreign minister helped maintain optimism surrounding a potential U.S.-China trade deal next month.
|
 Kenneth J. Gruneisen started out as a licensed stockbroker in August 1987, a couple of months prior to the historic stock market crash that took the Dow Jones Industrial Average down -22.6% in a single day. He has published daily fact-based fundamental and technical analysis on high-ranked stocks online for two decades. Through FACTBASEDINVESTING.COM, Kenneth provides educational articles, news, market commentary, and other information regarding proven investment systems that work in good times and bad.
Comments contained in the body of this report are technical opinions only and are not necessarily those of Gruneisen Growth Corp. The material herein has been obtained from sources believed to be reliable and accurate, however, its accuracy and completeness cannot be guaranteed. Our firm, employees, and customers may effect transactions, including transactions contrary to any recommendation herein, or have positions in the securities mentioned herein or options with respect thereto. Any recommendation contained in this report may not be suitable for all investors and it is not to be deemed an offer or solicitation on our part with respect to the purchase or sale of any securities. |
|
 |
Energy-Linked Groups Outpaced Bank and Biotech Indexes With Gains
Kenneth J. Gruneisen - Passed the CAN SLIM® Master's Exam
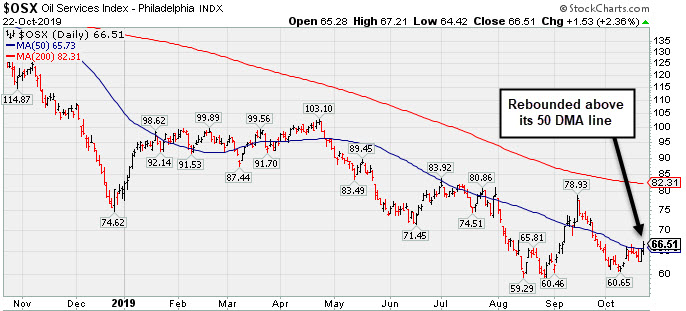
The Bank Index ($BKX +0.69%) rose while the Broker/Dealer Index ($XBD -0.43%) and the Retail Index ($RLX -0.30%) both edged lower. The tech sector was mixed as the Semiconductor Index ($SOX -0.77%) outpaced the Networking Index ($NWX -0.18%) to the downside while the Biotech Index ($BTK +0.37%) posted a modest gain. The Oil Services Index ($OSX +2.36%) and the Integrated Oil Index ($XOI +1.41%) both outpaced the Gold & Silver Index ($XAU +0.21%).
PICTURED: The Oil Services Index ($OSX +2.36%) was a standout gainer as it rebounded above its 50-day moving average line again.
| Oil Services |
$OSX |
66.51 |
+1.53 |
+2.35% |
-17.48% |
| Integrated Oil |
$XOI |
1,221.52 |
+16.96 |
+1.41% |
+5.39% |
| Semiconductor |
$SOX |
1,607.60 |
-12.44 |
-0.77% |
+39.17% |
| Networking |
$NWX |
563.37 |
-1.00 |
-0.18% |
+15.29% |
| Broker/Dealer |
$XBD |
259.76 |
-1.12 |
-0.43% |
+9.45% |
| Retail |
$RLX |
2,403.83 |
-7.21 |
-0.30% |
+23.18% |
| Gold & Silver |
$XAU |
89.00 |
+0.19 |
+0.21% |
+25.96% |
| Bank |
$BKX |
103.57 |
+0.71 |
+0.69% |
+20.73% |
| Biotech |
$BTK |
4,359.46 |
+15.91 |
+0.37% |
+3.28% |
|
|
|
 |
Reversed Into Red Today After Hitting New All-Time High
Kenneth J. Gruneisen - Passed the CAN SLIM® Master's Exam
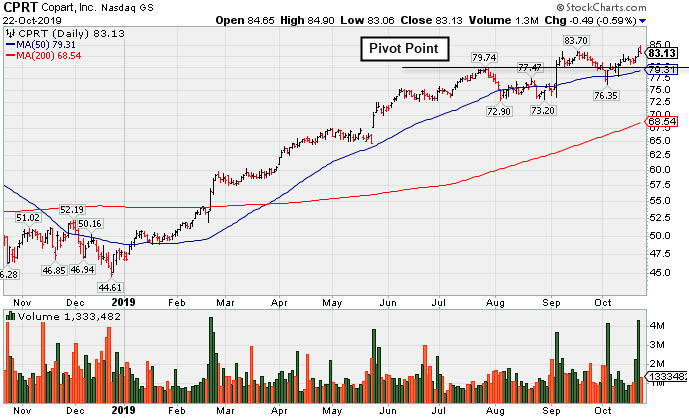
Copart Inc (CPRT -$0.49 or -0.59% to $83.13) pulled back below its "max buy" level and its color code was changed to yellow. Its 50-day moving average (DMA) line ($79.31) defines near-term support above the prior low ($76.35 on 10/03/19).
A volume-driven gain above the pivot point on 9/05/19 clinched a technical buy signal when CPRT was highlighted in yellow with pivot point cited based on its 7/26/19 high plus 10 cents (read here). It was last shown in this FSU session on 10/04/19 with an annotated graph under the headline, "Found Prompt Support Near 50-Day Moving Average".
Bullish action came after it reported earnings +43% on +21% sales revenues for the Jul '19 quarter. Three of the past 4 quarterly earnings increases were above the +25% minimum guideline (C criteria) and its sales revenues growth rate has accelerated. Annual earnings (A criteria) history has been strong and steady since a downturn in FY '13.
The number of top-rated funds owning its shares rose from 1,120 in Sep '18 to 1,327 in Sep '19, a reassuring sign concerning the I criteria. It has a Timeliness Rating of A and Sponsorship Rating of B.
|
|
|
Color Codes Explained :
Y - Better candidates highlighted by our
staff of experts.
G - Previously featured
in past reports as yellow but may no longer be buyable under the
guidelines.
***Last / Change / Volume data in this table is the closing quote data***
Symbol/Exchange
Company Name
Industry Group |
PRICE |
CHANGE
(%Change) |
Day High |
Volume
(% DAV)
(% 50 day avg vol) |
52 Wk Hi
% From Hi |
Featured
Date |
Price
Featured |
Pivot Featured |
|
Max Buy |
 MLR
-
NYSE
MLR
-
NYSE
Miller Industries Inc
AUTOMOTIVE - Auto Parts
|
$32.51
|
+0.31
0.96% |
$32.53
|
41,922
136.55% of 50 DAV
50 DAV is 30,700
|
$35.26
-7.80%
|
9/24/2019
|
$34.00
|
PP = $35.36
|
|
MB = $37.13
|
Most Recent Note - 10/21/2019 5:43:51 PM
G - Sputtering near its 50 DMA line ($32.42). Halted its slide recently at its 200 DMA line. Subsequent gains above the pivot point backed by at least +40% above average volume may trigger a technical buy signal. Fundamentals remain strong.
>>> FEATURED STOCK ARTICLE : Tested Support at Long-Term 200-Day Moving Average - 10/9/2019 |
View all notes |
Set NEW NOTE alert |
Company Profile |
SEC
News |
Chart |
Request a new note
C
A
S
I |
CCBG
-
NASDAQ
Capital City Bk Gp
BANKING - Regional - Mid-Atlantic Banks
|
$27.65
|
+0.14
0.51% |
$27.79
|
50,384
186.61% of 50 DAV
50 DAV is 27,000
|
$28.00
-1.25%
|
9/13/2019
|
$27.03
|
PP = $27.05
|
|
MB = $28.40
|
Most Recent Note - 10/17/2019 4:14:59 PM
Y - Still hovering near its 52-week high. Prior highs define initial support to watch above its 50 DMA line ($25.74). Due to report earnings news on 10/21/19.
>>> FEATURED STOCK ARTICLE : Perched Near High With Earnings News Due Next Week - 10/14/2019 |
View all notes |
Set NEW NOTE alert |
Company Profile |
SEC
News |
Chart |
Request a new note
C
A
S
I |
EPAM
-
NYSE
Epam Systems Inc
COMPUTER SOFTWARE and SERVICES - Information Technology Service
|
$170.00
|
-15.98
-8.59% |
$186.85
|
666,213
224.31% of 50 DAV
50 DAV is 297,000
|
$201.00
-15.42%
|
5/9/2019
|
$169.25
|
PP = $180.55
|
|
MB = $189.58
|
 Most Recent Note - 10/22/2019 5:34:44 PM
Violated prior lows in the $174-175 area and violated its 200 DMA line ($172.72) with today's big volume-driven loss triggering a worrisome technical sell signal. It will be dropped from the Featured Stocks list tonight. A rebound above the 50 DMA line ($186.55) is needed for its outlook to improve.
>>> FEATURED STOCK ARTICLE : Faces Some Resistance Due to Overhead Supply - 10/16/2019 |
View all notes |
Set NEW NOTE alert |
Company Profile |
SEC
News |
Chart |
Request a new note
C
A
S
I |
AUDC
-
NASDAQ
Audiocodes Ltd
ELECTRONICS - Scientific and Technical Instrum
|
$18.28
|
-0.75
-3.94% |
$19.39
|
244,122
122.06% of 50 DAV
50 DAV is 200,000
|
$22.50
-18.76%
|
9/13/2019
|
$19.68
|
PP = $19.84
|
|
MB = $20.83
|
Most Recent Note - 10/21/2019 5:42:13 PM
G - Consolidating above its 50 DMA line ($18.43) but still sputtering below the prior pivot point. Recent low ($17.54 on 10/08/19) defines the next important support. See the latest FSU analysis for more details and a new annotated graph.
>>> FEATURED STOCK ARTICLE : Consolidating Above 50-Day Average But Below Prior Pivot Point - 10/21/2019 |
View all notes |
Set NEW NOTE alert |
Company Profile |
SEC
News |
Chart |
Request a new note
C
A
S
I |
CHDN
-
NASDAQ
Churchill Downs Inc
LEISURE - Gaming Activities
|
$131.26
|
+0.49
0.37% |
$131.98
|
217,396
90.21% of 50 DAV
50 DAV is 241,000
|
$133.55
-1.71%
|
10/8/2019
|
$129.77
|
PP = $132.83
|
|
MB = $139.47
|
Most Recent Note - 10/18/2019 5:51:40 PM
Y - Churned heavy volume as it rallied for a best-ever close today. Stubbornly holding its ground near its all-time high following volume-driven gains last week. Subsequent gains above the pivot point backed by at least +40% above average volume may trigger a new (or add-on) technical buy signal. Its 50 DMA line ($123.42) acted as support in recent weeks during its consolidation. Jun '19 earnings +10% on +26% sales revenues versus the year ago period were below the +25% minimum earnings guideline (C criteria), noted recently raising fundamental concerns.
>>> FEATURED STOCK ARTICLE : Volume-Driven Gain for Record High Close - 10/8/2019 |
View all notes |
Set NEW NOTE alert |
Company Profile |
SEC
News |
Chart |
Request a new note
C
A
S
I |
Symbol/Exchange
Company Name
Industry Group |
PRICE |
CHANGE
(%Change) |
Day High |
Volume
(% DAV)
(% 50 day avg vol) |
52 Wk Hi
% From Hi |
Featured
Date |
Price
Featured |
Pivot Featured |
|
Max Buy |
LULU
-
NASDAQ
Lululemon Athletica
MANUFACTURING - Textile Manufacturing
|
$204.40
|
-0.88
-0.43% |
$207.17
|
1,035,719
55.68% of 50 DAV
50 DAV is 1,860,000
|
$209.02
-2.21%
|
9/6/2019
|
$201.25
|
PP = $194.35
|
|
MB = $204.07
|
Most Recent Note - 10/18/2019 5:44:08 PM
G - Hit a new all-time high as it rose above its "max buy" level and its color code is changed to green. Its 50 DMA line ($190) and recent low ($185.36 on 10/03/19) define important near-term support. See the latest FSU analysis for more details and a new annotated graph.
>>> FEATURED STOCK ARTICLE : LULU Stretches to Hit New Record High - 10/18/2019 |
View all notes |
Set NEW NOTE alert |
Company Profile |
SEC
News |
Chart |
Request a new note
C
A
S
I |
CPRT
-
NASDAQ
Copart Inc
SPECIALTY RETAIL - Auto Dealerships
|
$83.13
|
-0.49
-0.59% |
$84.90
|
1,330,782
90.04% of 50 DAV
50 DAV is 1,478,000
|
$84.33
-1.42%
|
9/5/2019
|
$79.13
|
PP = $79.84
|
|
MB = $83.83
|
Most Recent Note - 10/22/2019 5:28:29 PM
Y - Color code is changed to yellow after reversal and retreat below its "max buy" level. Its 50 DMA line ($79.31) defines near-term support above the prior low ($76.35 on 10/03/19). See the latest FSU analysis for more details and a new annotated graph.
>>> FEATURED STOCK ARTICLE : Reversed Into Red Today After Hitting New All-Time High - 10/22/2019 |
View all notes |
Set NEW NOTE alert |
Company Profile |
SEC
News |
Chart |
Request a new note
C
A
S
I |
PFPT
-
NASDAQ
Proofpoint Inc
Computer Sftwr-Security
|
$119.81
|
-0.18
-0.15% |
$121.63
|
734,481
98.10% of 50 DAV
50 DAV is 748,700
|
$133.58
-10.31%
|
10/1/2019
|
$129.59
|
PP = $132.95
|
|
MB = $139.60
|
Most Recent Note - 10/18/2019 5:50:04 PM
G - Violated its 50 DMA line ($122.75) with a volume-driven loss today triggering a technical sell signal and its color code is changed to green. Met stubborn resistance in the $132 area in recent months. A prompt rebound above the 50 DMA line is needed for its outlook to improve.
>>> FEATURED STOCK ARTICLE : Recently Met Stubborn Resistance Near Prior Highs - 10/17/2019 |
View all notes |
Set NEW NOTE alert |
Company Profile |
SEC
News |
Chart |
Request a new note
C
A
S
I |
BLD
-
NYSE
Topbuild Corp
Bldg-Constr Prds/Misc
|
$100.50
|
-0.93
-0.92% |
$101.97
|
172,969
71.18% of 50 DAV
50 DAV is 243,000
|
$102.81
-2.25%
|
5/17/2019
|
$82.19
|
PP = $87.31
|
|
MB = $91.68
|
Most Recent Note - 10/17/2019 4:14:20 PM
G - Wedged into all-time high territory with today's 5th consecutive gain lacking great volume conviction. Earnings rose +39% on +9% sales revenues for the Jun '19 quarter versus the year ago period. Its 50 DMA line ($93.61) defines important support to watch along with its prior low ($91.31 on 10/03/19).
>>> FEATURED STOCK ARTICLE : Near High After Finding Support at 50-Day Average - 10/7/2019 |
View all notes |
Set NEW NOTE alert |
Company Profile |
SEC
News |
Chart |
Request a new note
C
A
S
I |
PAGS
-
NYSE
Pagseguro Digital Cl A
Finance-CrdtCard/PmtPr
|
$35.61
|
-3.34
-8.58% |
$39.25
|
5,258,034
239.22% of 50 DAV
50 DAV is 2,198,000
|
$53.43
-33.35%
|
6/25/2019
|
$37.69
|
PP = $40.07
|
|
MB = $42.07
|
Most Recent Note - 10/22/2019 5:31:12 PM
Slumped further today with above average volume testing its 200 DMA line ($35.26). Completed a Secondary Offering on 10/17/19. A rebound above the 50 DMA line ($46.62) is needed for its outlook to improve. It will be dropped from the Featured Stocks list tonight.
>>> FEATURED STOCK ARTICLE : Rebound Above 50-Day Average Needed for Outlook to Improve - 10/10/2019 |
View all notes |
Set NEW NOTE alert |
Company Profile |
SEC
News |
Chart |
Request a new note
C
A
S
I |
Symbol/Exchange
Company Name
Industry Group |
PRICE |
CHANGE
(%Change) |
Day High |
Volume
(% DAV)
(% 50 day avg vol) |
52 Wk Hi
% From Hi |
Featured
Date |
Price
Featured |
Pivot Featured |
|
Max Buy |
|
|
|
THESE ARE NOT BUY RECOMMENDATIONS!
Comments contained in the body of this report are technical
opinions only. The material herein has been obtained
from sources believed to be reliable and accurate, however,
its accuracy and completeness cannot be guaranteed.
This site is not an investment advisor, hence it does
not endorse or recommend any securities or other investments.
Any recommendation contained in this report may not
be suitable for all investors and it is not to be deemed
an offer or solicitation on our part with respect to
the purchase or sale of any securities. All trademarks,
service marks and trade names appearing in this report
are the property of their respective owners, and are
likewise used for identification purposes only.
This report is a service available
only to active Paid Premium Members.
You may opt-out of receiving report notifications
at any time. Questions or comments may be submitted
by writing to Premium Membership Services 665 S.E. 10 Street, Suite 201 Deerfield Beach, FL 33441-5634 or by calling 1-800-965-8307
or 954-785-1121.
|
|
|