You are not logged in.
This means you
CAN ONLY VIEW reports that were published prior to Tuesday, February 20, 2024.
You
MUST UPGRADE YOUR MEMBERSHIP if you want to see any current reports.
AFTER MARKET UPDATE - MONDAY, OCTOBER 22ND, 2018
Previous After Market Report Next After Market Report >>>
|
|
|
|
DOW |
-126.93 |
25,317.41 |
-0.50% |
|
Volume |
749,860,480 |
-20% |
|
Volume |
2,279,220,770 |
-10% |
|
NASDAQ |
+19.60 |
7,468.63 |
+0.26% |
|
Advancers |
1,239 |
41% |
|
Advancers |
1,310 |
43% |
|
S&P 500 |
-11.90 |
2,755.88 |
-0.43% |
|
Decliners |
1,759 |
59% |
|
Decliners |
1,747 |
57% |
|
Russell 2000 |
-2.54 |
1,539.50 |
-0.16% |
|
52 Wk Highs |
20 |
|
|
52 Wk Highs |
20 |
|
|
S&P 600 |
-0.12 |
961.94 |
-0.01% |
|
52 Wk Lows |
289 |
|
|
52 Wk Lows |
312 |
|
|
 |
New 52-Week Lows Totals Grow While Leadership Remains Thin
Kenneth J. Gruneisen - Passed the CAN SLIM® Master's Exam
Stocks finished mixed Monday. The Dow dropped 126 points to 25317, while the S&P 500 slipped 11 points to 2755. The Nasdaq Composite gained 19 points to 7468. Volume totals reported were lighter on the NYSE and on the Nasdaq exchange versus the prior session. Decliners outnumbered advancers by a 3-2 margin on the NYSE and by a 4-3 margin on the Nasdaq exchange. There were only 3 high-ranked companies from the Leaders List that made new 52-week highs and were listed on the BreakOuts Page, versus 5 on the prior session, as market leadership remained very elusive. New 52-week lows totals expanded again and easily outnumbered new 52-week highs on the NYSE and Nasdaq exchange. Recent reports have noted that the major indices (M criteria) have shown action indicative of a market correction while leadership disappeared. During market corrections investors should have a bias toward selling stocks on a case-by-case basis as technical sell signals occur, raising cash levels while reducing market exposure. The Featured Stocks Page provides the most timely analysis on high-ranked leaders. Charts used courtesy of www.stockcharts.com
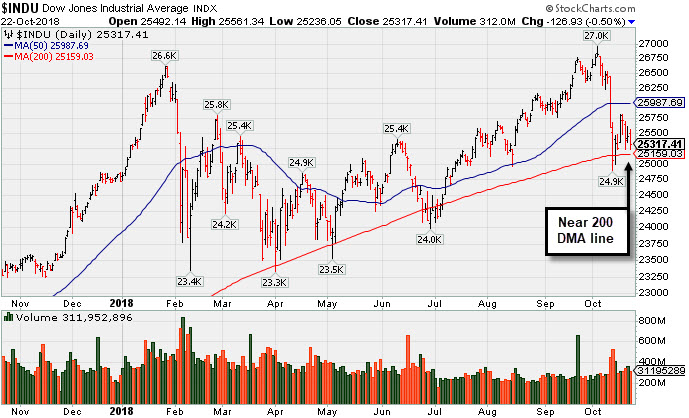
PICTURED: The Dow Jones Industrial Average is sputtering near its 200-day moving average (DMA) line. Technically, the market still is in a "correction" under the fact-based investment system. Monday marked Day 7 of the current rally attempt without a "follow-through day". Solid gains from one or more of the major indices on higher volume and leadership expansion (more new 52-week highs) are all necessary elements needed to confirm a new rally. Members are again reminded that new buying efforts are against the rules and discouraged until a convincing follow-through day occurs.
The Dow and S&P 500 erased early session gains as disappointing quarterly earnings releases overshadowed strength in Asia overnight. China’s Shanghai Composite surged more than 4% to post its best session since March 2016 amid proposed Chinese tax cuts. On the data front, the sole update from the Chicago Fed showed national activity expanded at a slower-than-anticipated pace last month.
Nine of 11 S&P 500 sectors closed in negative territory with Financials sliding more than 2.0%. Energy shares also lagged as Halliburton’s (HAL -2.34%) loss following earnings news weighed on the sector. The oilfield services company fell after offering a weak year-end forecast amid a projected slowdown in activity. Strength in Technology shares buoyed the major averages as Microsoft (MSFT +0.89%) and Intel (INTC +2.30%) rose following an analyst upgrade. In other earnings, Hasbro (HAS - 3.09%) fell after missing consensus earnings and revenue estimates.
Treasuries were essentially unchanged with the yield on the 10-year note flat at 3.19%. In commodities, WTI crude added 0.1% to $69.17/barrel after touching its lowest point in five weeks. COMEX gold lost 0.3% to $1,221.20/ounce as the U.S. dollar climbed to its best level in two months. |
 Kenneth J. Gruneisen started out as a licensed stockbroker in August 1987, a couple of months prior to the historic stock market crash that took the Dow Jones Industrial Average down -22.6% in a single day. He has published daily fact-based fundamental and technical analysis on high-ranked stocks online for two decades. Through FACTBASEDINVESTING.COM, Kenneth provides educational articles, news, market commentary, and other information regarding proven investment systems that work in good times and bad.
Comments contained in the body of this report are technical opinions only and are not necessarily those of Gruneisen Growth Corp. The material herein has been obtained from sources believed to be reliable and accurate, however, its accuracy and completeness cannot be guaranteed. Our firm, employees, and customers may effect transactions, including transactions contrary to any recommendation herein, or have positions in the securities mentioned herein or options with respect thereto. Any recommendation contained in this report may not be suitable for all investors and it is not to be deemed an offer or solicitation on our part with respect to the purchase or sale of any securities. |
|
 |
Financial, Biotech, and Commodity-Linked Groups Fell
Kenneth J. Gruneisen - Passed the CAN SLIM® Master's Exam
The Bank Index ($BKX -2.74%) and Broker/Dealer Index ($XBD -1.51%) both created a big drag on the major indices on Monday. The Retail Index ($RLX +0.86%) posted a solid gain. The tech sector was mixed, with negative action for the Biotech Index ($BTK -1.91%), meanwhile the Semiconductor Index ($SOX +0.67%) and the Networking Index ($NWX +0.77%) both rose. Commodity-linked groups had a negative bias as the Integrated Oil Index ($XOI -0.58%), Oil Services Index ($OSX -1.55%), and the Gold & Silver Index ($XAU -1.50%) ended unanimously lower.
Charts courtesy of www.stockcharts.com
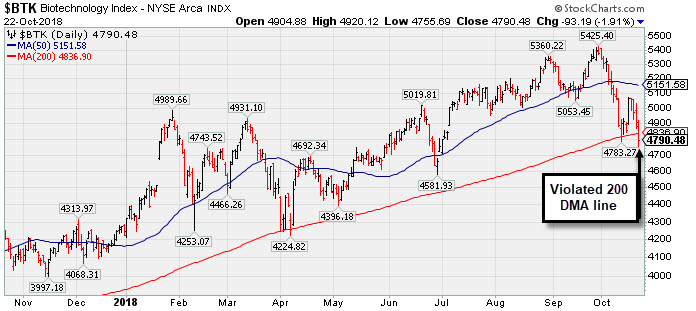 PICTURED: The Biotech Index ($BTK -1.91%) slumped and closed well below its 200-day moving average (DMA) line with Monday's loss. A prompt rebound would be a reassuring sign.
| Oil Services |
$OSX |
135.56 |
-2.13 |
-1.55% |
-9.35% |
| Integrated Oil |
$XOI |
1,433.80 |
-8.36 |
-0.58% |
+7.36% |
| Semiconductor |
$SOX |
1,234.20 |
+8.26 |
+0.67% |
-1.50% |
| Networking |
$NWX |
522.08 |
+3.99 |
+0.77% |
+6.43% |
| Broker/Dealer |
$XBD |
258.62 |
-3.95 |
-1.51% |
-2.50% |
| Retail |
$RLX |
2,203.27 |
+18.69 |
+0.86% |
+27.08% |
| Gold & Silver |
$XAU |
69.04 |
-1.05 |
-1.50% |
-19.03% |
| Bank |
$BKX |
97.08 |
-2.73 |
-2.74% |
-9.02% |
| Biotech |
$BTK |
4,790.48 |
-93.19 |
-1.91% |
+13.46% |
|
|
|
 |
Consolidating After Rally at 200-Day Moving Average Line
Kenneth J. Gruneisen - Passed the CAN SLIM® Master's Exam
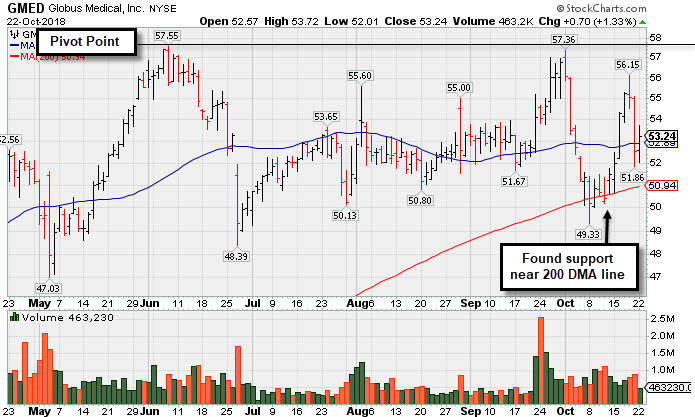
Globus Medical Inc Cl A (GMED +$0.70 or +1.33% to $53.24) is consolidating near its 50-day moving average (DMA) line ($52.89). Recent volume-driven losses have been noted as signs of distributional pressure hurting its outlook, however it has found support near its 200 DMA line. . A rebound and subsequent gains above the pivot point backed by more than +40% above average volume are needed to trigger a proper technical buy signal.
GMED was last shown in this FSU section on 9/26/18 with an annotated graph under the headline, "Rallying Near Pivot Point With Volume-Driven Gains". highlighted in yellow with pivot point cited based on its 6/06/18 high plus 10 cents in the earlier mid-day report (read here). It has been rallying from support at its 50-day moving average (DMA) line and challenging its all-time high with volume-driven gains. Subsequent gains above the pivot point backed by more than +40% above average volume may trigger a technical buy signal.
The Medical - Products firm has technology to treat patients with spine disorders. Reported earnings +38% on +14% sales revenues for the Jun '18 quarter, its 2nd strong quarterly comparison above the +25% minimum guideline (C criteria). Annual earnings (A criteria) growth has been steady.
It has 98.3 million shares outstanding (S criteria). The number of top rated funds owning its shares rose from 451 in Sep '17 to 514 in Sep '18, a reassuring sign concerning the I criteria. Its current Up/Down Volume Ratio of 1.1 is an unbiased indication its shares have been under slight accumulation over the past 50 days.
Charts courtesy of www.stockcharts.com
 |
|
|
Color Codes Explained :
Y - Better candidates highlighted by our
staff of experts.
G - Previously featured
in past reports as yellow but may no longer be buyable under the
guidelines.
***Last / Change / Volume data in this table is the closing quote data***
Symbol/Exchange
Company Name
Industry Group |
PRICE |
CHANGE
(%Change) |
Day High |
Volume
(% DAV)
(% 50 day avg vol) |
52 Wk Hi
% From Hi |
Featured
Date |
Price
Featured |
Pivot Featured |
|
Max Buy |
SIVB
-
NASDAQ
S V B Financial Group
BANKING - Regional - Pacific Banks
|
$277.06
|
-4.78
-1.70% |
$286.05
|
659,991
156.77% of 50 DAV
50 DAV is 421,000
|
$333.74
-16.98%
|
8/6/2018
|
$314.77
|
PP = $329.75
|
|
MB = $346.24
|
Most Recent Note - 10/19/2018 12:48:40 PM
G - Sputtering below its 200 DMA ($289) and recently testing near its 7/02/18 low ($284.42). A rebound above the 50 DMA line ($316) is needed for its outlook to improve.
>>> FEATURED STOCK ARTICLE : Weak Action Amid Broader Market Declines - 10/11/2018 |
View all notes |
Set NEW NOTE alert |
Company Profile |
SEC
News |
Chart |
Request a new note
C
A
S
I |
GMED
-
NYSE
Globus Medical Inc Cl A
CHEMICALS - Specialty Chemicals
|
$53.24
|
+0.70
1.33% |
$53.73
|
462,230
74.92% of 50 DAV
50 DAV is 617,000
|
$57.55
-7.49%
|
9/26/2018
|
$56.11
|
PP = $57.65
|
|
MB = $60.53
|
Most Recent Note - 10/19/2018 6:36:52 PM
G - Color code is changed to green after slumping back below its 50 DMA line ($52.88) with a volume-driven loss today hurting its outlook. A rebound and subsequent gains above the pivot point backed by more than +40% above average volume are needed to trigger a proper technical buy signal.
>>> FEATURED STOCK ARTICLE : Consolidating After Rally at 200-Day Moving Average Line - 10/22/2018 |
View all notes |
Set NEW NOTE alert |
Company Profile |
SEC
News |
Chart |
Request a new note
C
A
S
I |
ZBRA
-
NASDAQ
Zebra Tech Corp Cl A
COMPUTER HARDWARE - Computer Peripherals
|
$168.18
|
+3.23
1.96% |
$169.63
|
616,897
165.83% of 50 DAV
50 DAV is 372,000
|
$179.47
-6.29%
|
8/7/2018
|
$164.26
|
PP = $161.82
|
|
MB = $169.91
|
 Most Recent Note - 10/22/2018 6:05:22 PM
G - Consolidating near its 50 DMA line ($168). Faces very little near-term resistance due to overhead supply up to $179. Found support in recent weeks after a pullback near its 200 DMA line.
>>> FEATURED STOCK ARTICLE : Hovering Near All-Time High With Strong Fundamentals - 9/24/2018 |
View all notes |
Set NEW NOTE alert |
Company Profile |
SEC
News |
Chart |
Request a new note
C
A
S
I |
CME
-
NASDAQ
C M E Group Inc
DIVERSIFIED SERVICES - Business/Management Services
|
$181.22
|
-1.43
-0.78% |
$183.27
|
1,467,697
102.92% of 50 DAV
50 DAV is 1,426,000
|
$183.79
-1.40%
|
10/4/2018
|
$179.29
|
PP = $177.45
|
|
MB = $186.32
|
Most Recent Note - 10/22/2018 5:44:26 PM
Y - Remains perched near at its all-time high despite broad market weakness (M criteria). The 50 DMA line ($173.76) and prior lows define important near-term support.
>>> FEATURED STOCK ARTICLE : CME Group Blasted to New Record High - 10/4/2018 |
View all notes |
Set NEW NOTE alert |
Company Profile |
SEC
News |
Chart |
Request a new note
C
A
S
I |
MA
-
NYSE
Mastercard Inc Cl A
Finance-CrdtCard/PmtPr
|
$204.50
|
+1.44
0.71% |
$206.26
|
2,996,699
83.89% of 50 DAV
50 DAV is 3,572,000
|
$225.35
-9.25%
|
7/11/2018
|
$203.84
|
PP = $204.10
|
|
MB = $214.31
|
Most Recent Note - 10/22/2018 6:08:14 PM
G - A rebound above the 50 DMA line ($211) still is needed for its outlook to improve. Recently found support above its 200 DMA line ($191).
>>> FEATURED STOCK ARTICLE : Hovering Near High, Extended From Any Sound Base - 9/27/2018 |
View all notes |
Set NEW NOTE alert |
Company Profile |
SEC
News |
Chart |
Request a new note
C
A
S
I |
Symbol/Exchange
Company Name
Industry Group |
PRICE |
CHANGE
(%Change) |
Day High |
Volume
(% DAV)
(% 50 day avg vol) |
52 Wk Hi
% From Hi |
Featured
Date |
Price
Featured |
Pivot Featured |
|
Max Buy |
V
-
NYSE
Visa Inc Cl A
Finance-CrdtCard/PmtPr
|
$140.64
|
+0.56
0.40% |
$141.54
|
5,998,148
75.81% of 50 DAV
50 DAV is 7,912,000
|
$151.56
-7.21%
|
4/26/2018
|
$126.68
|
PP = $126.98
|
|
MB = $133.33
|
Most Recent Note - 10/22/2018 6:06:47 PM
G - Volume totals have been cooling and a rebound above the 50 DMA line ($144) still is needed for its outlook to improve. Found support after slumping near its 200 DMA line ($132).
>>> FEATURED STOCK ARTICLE : Rebounding Toward 50-Day Moving Average - 10/17/2018 |
View all notes |
Set NEW NOTE alert |
Company Profile |
SEC
News |
Chart |
Request a new note
C
A
S
I |
TPL
-
NYSE
Texas Pacific Land Trust
Real Estate Dvlpmt/Ops
|
$740.11
|
-34.25
-4.42% |
$776.60
|
23,852
183.48% of 50 DAV
50 DAV is 13,000
|
$877.97
-15.70%
|
9/14/2018
|
$820.45
|
PP = $874.10
|
|
MB = $917.81
|
Most Recent Note - 10/22/2018 5:56:21 PM
Violated the prior low ($760 on 8/15/18) with another damaging loss today on above average volume. A rebound above the 50 DMA line ($824) is needed for its outlook to improve. It will be dropped from the Featured Stocks list tonight.
>>> FEATURED STOCK ARTICLE : Slump Below 50-Day Moving Average Hurt Technical Stance - 10/12/2018 |
View all notes |
Set NEW NOTE alert |
Company Profile |
SEC
News |
Chart |
Request a new note
C
A
S
I |
DPZ
-
NYSE
Dominos Pizza Inc
Retail-Restaurants
|
$267.75
|
+0.00
0.00% |
$272.00
|
938,458
170.32% of 50 DAV
50 DAV is 551,000
|
$305.34
-12.31%
|
8/13/2018
|
$288.60
|
PP = $293.91
|
|
MB = $308.61
|
Most Recent Note - 10/22/2018 5:59:15 PM
G - Found support last week after testing near its 200 DMA line ($254). A subsequent rebound above the 50 DMA line ($285) still is needed for its outlook to improve. The prior low ($253.63 on 7/31/18) and 200 DMA line define important near-term support to watch. Reported earnings +54% on +22% sales revenues for the Sep '18 quarter, continuing its strong earnings track record.
>>> FEATURED STOCK ARTICLE : Sank Below 50 DMA Line Ahead of Earnings News - 10/15/2018 |
View all notes |
Set NEW NOTE alert |
Company Profile |
SEC
News |
Chart |
Request a new note
C
A
S
I |
FIVE
-
NASDAQ
Five Below Inc
Retail-DiscountandVariety
|
$116.18
|
+1.38
1.20% |
$117.42
|
533,166
55.71% of 50 DAV
50 DAV is 957,000
|
$136.13
-14.66%
|
7/6/2018
|
$98.90
|
PP = $104.09
|
|
MB = $109.29
|
Most Recent Note - 10/22/2018 6:01:16 PM
G - Quietly sputtering below its 50 DMA line ($119.61), and a rebound is needed for its outlook to improve. The prior high ($109.09 on 7/19/18) defines the next important support level to watch.
>>> FEATURED STOCK ARTICLE : Retreating After +138% Rally in Under 12 Months - 10/2/2018 |
View all notes |
Set NEW NOTE alert |
Company Profile |
SEC
News |
Chart |
Request a new note
C
A
S
I |
NVEE
-
NASDAQ
N V 5 Global Inc
Comml Svcs-Consulting
|
$83.23
|
-0.47
-0.56% |
$84.24
|
38,614
52.18% of 50 DAV
50 DAV is 74,000
|
$92.75
-10.26%
|
6/15/2018
|
$7,070.00
|
PP = $72.00
|
|
MB = $75.60
|
Most Recent Note - 10/22/2018 5:51:45 PM
G - Volume totals have been cooling while still quietly sputtering below its 50 DMA line. The recent low ($80.73 on 10/11/18) defines important near-term support to watch. A rebound above the 50 DMA line ($86.54) is needed for its outlook to improve.
>>> FEATURED STOCK ARTICLE : Recently Slumped Below 50-Day Moving Average Line - 10/8/2018 |
View all notes |
Set NEW NOTE alert |
Company Profile |
SEC
News |
Chart |
Request a new note
C
A
S
I |
Symbol/Exchange
Company Name
Industry Group |
PRICE |
CHANGE
(%Change) |
Day High |
Volume
(% DAV)
(% 50 day avg vol) |
52 Wk Hi
% From Hi |
Featured
Date |
Price
Featured |
Pivot Featured |
|
Max Buy |
HQY
-
NASDAQ
Healthequity Inc
COMPUTER SOFTWARE and SERVICES - Healthcare Information Service
|
$87.50
|
+0.58
0.67% |
$88.03
|
301,252
37.56% of 50 DAV
50 DAV is 802,000
|
$99.99
-12.49%
|
8/13/2018
|
$82.39
|
PP = $83.44
|
|
MB = $87.61
|
Most Recent Note - 10/22/2018 6:03:16 PM
G - Still sputtering below its 50 DMA line ($90.37) which may act as resistance. Found recent support near prior highs in the $82-83 area, but more damaging losses would raise serious concerns.
>>> FEATURED STOCK ARTICLE : Below 50-Day Moving Average Which May Act as Resistance - 10/16/2018 |
View all notes |
Set NEW NOTE alert |
Company Profile |
SEC
News |
Chart |
Request a new note
C
A
S
I |
OLLI
-
NASDAQ
Ollie's Bargain Outlet
Retail-DiscountandVariety
|
$90.08
|
+1.34
1.51% |
$90.49
|
381,307
58.57% of 50 DAV
50 DAV is 651,000
|
$97.61
-7.71%
|
7/12/2018
|
$74.43
|
PP = $77.60
|
|
MB = $81.48
|
Most Recent Note - 10/19/2018 6:35:06 PM
G - The 50 DMA line ($87) and recent low ($84.66 on 10/11/18) define near-term support well above prior highs in the $77 area. Fundamentals remain strong.
>>> FEATURED STOCK ARTICLE : Encountered Distributional Pressure After a Great Rally - 10/9/2018 |
View all notes |
Set NEW NOTE alert |
Company Profile |
SEC
News |
Chart |
Request a new note
C
A
S
I |
|
|
|
THESE ARE NOT BUY RECOMMENDATIONS!
Comments contained in the body of this report are technical
opinions only. The material herein has been obtained
from sources believed to be reliable and accurate, however,
its accuracy and completeness cannot be guaranteed.
This site is not an investment advisor, hence it does
not endorse or recommend any securities or other investments.
Any recommendation contained in this report may not
be suitable for all investors and it is not to be deemed
an offer or solicitation on our part with respect to
the purchase or sale of any securities. All trademarks,
service marks and trade names appearing in this report
are the property of their respective owners, and are
likewise used for identification purposes only.
This report is a service available
only to active Paid Premium Members.
You may opt-out of receiving report notifications
at any time. Questions or comments may be submitted
by writing to Premium Membership Services 665 S.E. 10 Street, Suite 201 Deerfield Beach, FL 33441-5634 or by calling 1-800-965-8307
or 954-785-1121.
|
|
|

