You are not logged in.
This means you
CAN ONLY VIEW reports that were published prior to Tuesday, February 20, 2024.
You
MUST UPGRADE YOUR MEMBERSHIP if you want to see any current reports.
AFTER MARKET UPDATE - WEDNESDAY, OCTOBER 21ST, 2020
Previous After Market Report Next After Market Report >>>
|
|
|
|
DOW |
-97.97 |
28,210.82 |
-0.35% |
|
Volume |
849,401,213 |
+12% |
|
Volume |
3,437,431,600 |
-1% |
|
NASDAQ |
-31.80 |
11,484.69 |
-0.28% |
|
Advancers |
1,038 |
34% |
|
Advancers |
1,292 |
38% |
|
S&P 500 |
-28.79 |
3,467.31 |
-0.82% |
|
Decliners |
1,977 |
66% |
|
Decliners |
2,118 |
62% |
|
Russell 2000 |
-13.93 |
1,603.78 |
-0.86% |
|
52 Wk Highs |
62 |
|
|
52 Wk Highs |
70 |
|
|
S&P 600 |
-4.18 |
915.07 |
-0.45% |
|
52 Wk Lows |
26 |
|
|
52 Wk Lows |
38 |
|
|
The major indices have shown improvement and have resumed a market uptrend as leadership has improved. Disciplined investors carefully may buy leading stocks on a case-by-case basis. Always remain ready to reduce market exposure in the event of any more substantial market downdrafts.
|
 |
Major Indices Ended Lower Again With Less Leadership
Kenneth J. Gruneisen - Passed the CAN SLIM® Master's Exam
The Dow slipped 97 points, while the S&P 500 edged down 0.2%. The Nasdaq Composite declined 0.3%. The reported volume totals were mixed, higher than the prior session on the NYSE and slightly lower on the Nasdaq exchange. Breadth was negative as decliners led advancers by almost a 2-1 margin on the NYSE and by a 5-3 margin on the Nasdaq exchange. There were 31 high-ranked companies from the Leaders List that hit new 52-week highs and were listed on the BreakOuts Page, versus the total of 34 on the prior session. New 52-week highs totals contracted yet still outnumbered new 52-week lows totals on the NYSE and on the Nasdaq exchange. The major indices are in a confirmed uptrend (M criteria). New buying efforts may be justified in leading stocks on a case-by-case basis. 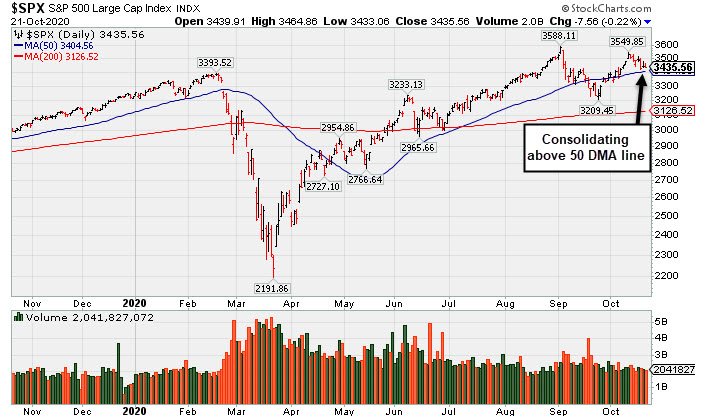 PICTURED: The S&P 500 Index is consolidating above its 50-day moving average (DMA) line and -4.3% off its record high.
U.S. equities ended the lower in choppy trading Wednesday, as investors digested a slew of earnings reports and monitored progress on the fiscal stimulus front. Yesterday, House Speaker Nancy Pelosi expressed optimism after reportedly narrowing differences during discussions with Treasury Secretary Steven Mnuchin. Talks continued today with Pelosi striking an upbeat tone about the state of negotiations, saying she “has a prospect for an agreement.”
Nine of 11 S&P 500 sectors finished the day in negative territory. Energy stocks posted the largest declines as WTI crude dropped 4.0% to $40.03/barrel amid inventory data showing a decline in demand for refined products, such as gasoline. In earnings, Netflix (NFLX -6.92%) slid after the streaming giant’s subscriber growth metric fell short of analysts’ projections. Meanwhile, Snap (SNAP +28.30%) took off with a "breakaway gap" after reporting a surprise profit in the third quarter and exceeding Wall Street’s forecast for daily active users. Positive results from the social media company provided a tailwind for Facebook (FB +4.17%) and Twitter (TWTR +8.39%) rallying. In other corporate news, PayPal (PYPL +5.50%) jumped after launching a new cryptocurrency service on its platform.
Today’s lone economic release showed MBA mortgage applications dipped 0.6% in the most recent week. In central bank news, the Federal Reserve released its Beige Book showed economic activity increased at slight to modest levels across all districts. Treasuries weakened, with the yield on the 10-year Treasury adding two basis points to 0.81%, the highest level since June. |
 Kenneth J. Gruneisen started out as a licensed stockbroker in August 1987, a couple of months prior to the historic stock market crash that took the Dow Jones Industrial Average down -22.6% in a single day. He has published daily fact-based fundamental and technical analysis on high-ranked stocks online for two decades. Through FACTBASEDINVESTING.COM, Kenneth provides educational articles, news, market commentary, and other information regarding proven investment systems that work in good times and bad.
Comments contained in the body of this report are technical opinions only and are not necessarily those of Gruneisen Growth Corp. The material herein has been obtained from sources believed to be reliable and accurate, however, its accuracy and completeness cannot be guaranteed. Our firm, employees, and customers may effect transactions, including transactions contrary to any recommendation herein, or have positions in the securities mentioned herein or options with respect thereto. Any recommendation contained in this report may not be suitable for all investors and it is not to be deemed an offer or solicitation on our part with respect to the purchase or sale of any securities. |
|
 |
Retail, Financial, Tech, and Energy Groups Fell
Kenneth J. Gruneisen - Passed the CAN SLIM® Master's Exam
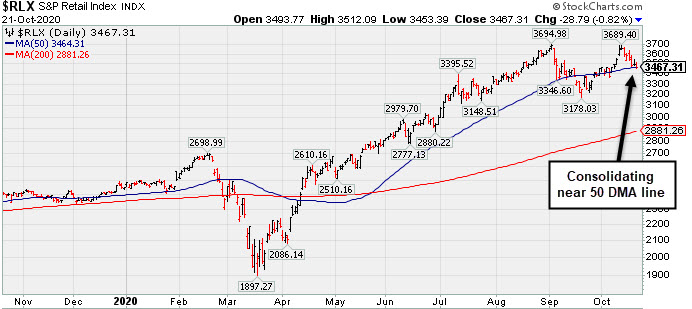
The Retail Index ($RLX -0.82%), Bank Index ($BKX -0.99%), and Broker/Dealer Index ($XBD -0.58%) suffered unanimous losses. The Biotech Index ($BTK -1.65%) led the tech sector's retreat while the Semiconductor Index ($SOX -0.78%) and Networking Index ($NWX -0.44%) also lost ground. Commodity-linked groups were mixed as the Gold & Silver Index ($XAU +1.43%) rose but the Oil Services Index ($OSX -1.29%) and Integrated Oil Index ($XOI -1.95%) both lost ground. PICTURED: The Retail Index ($RLX -0.82%) is consolidating near its 50-day moving average (DMA) line.
| Oil Services |
$OSX |
28.75 |
-0.38 |
-1.29% |
-63.27% |
| Integrated Oil |
$XOI |
582.13 |
-11.61 |
-1.95% |
-54.18% |
| Semiconductor |
$SOX |
2,367.26 |
-18.57 |
-0.78% |
+27.99% |
| Networking |
$NWX |
561.37 |
-2.49 |
-0.44% |
-3.78% |
| Broker/Dealer |
$XBD |
302.56 |
-1.77 |
-0.58% |
+4.20% |
| Retail |
$RLX |
3,467.31 |
-28.79 |
-0.82% |
+41.57% |
| Gold & Silver |
$XAU |
148.08 |
+2.09 |
+1.43% |
+38.50% |
| Bank |
$BKX |
77.47 |
-0.77 |
-0.99% |
-31.66% |
| Biotech |
$BTK |
5,300.43 |
-89.01 |
-1.65% |
+4.60% |
|
|
|
 |
Challenging All-Time High With Volume-Drive Gain
Kenneth J. Gruneisen - Passed the CAN SLIM® Master's Exam
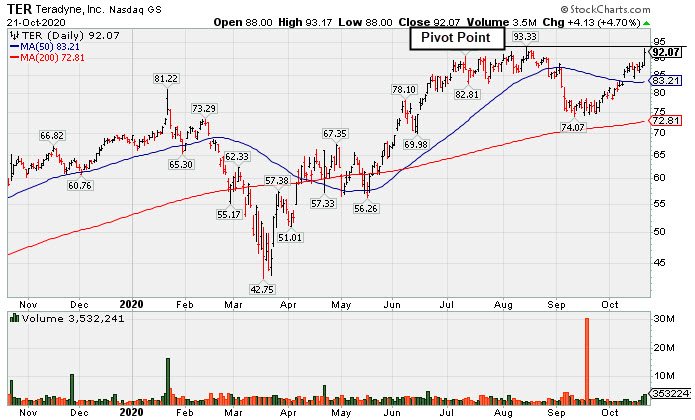
Teradyne Inc (TER +$4.13 or +4.70% to $92.07) was highlighted in yellow with pivot point cited based on its 8/14/20 high plus 10 cents in the earlier mid-day report (read here) . It challenged its all-time high with today's 3rd consecutive gain backed by ever-increasing volume. A subsequent gain above the pivot point backed by at least +40% above average volume may trigger a technical buy signal.
It reported earnings +53% on +41% sales revenues for the Sep '20 quarter versus the year ago period, the company's 4th consecutive quarterly comparison with earnings above the +25% minimum earnings guideline (C criteria). Sequential comparisons recently showed encouraging acceleration in its sales revenues growth rate. Its annual earnings (A criteria) history has been strong.
The high-ranked ELECTRONICS - Semiconductor Equipment firm has 166 million shares outstanding (S criteria). The number of top-rated funds owning its shares rise from 1,149 in Dec '19 to 1,324 in Sep '20, a reassuring sign concerning the I criteria. Its current Up/Down Volume ratio of 0.6 is an unbiased indication its shares have been under distributional pressure over the past 50 days. |
|
|
Color Codes Explained :
Y - Better candidates highlighted by our
staff of experts.
G - Previously featured
in past reports as yellow but may no longer be buyable under the
guidelines.
***Last / Change / Volume data in this table is the closing quote data***
Symbol/Exchange
Company Name
Industry Group |
PRICE |
CHANGE
(%Change) |
Day High |
Volume
(% DAV)
(% 50 day avg vol) |
52 Wk Hi
% From Hi |
Featured
Date |
Price
Featured |
Pivot Featured |
|
Max Buy |
 ADBE
-
NASDAQ
ADBE
-
NASDAQ
Adobe Inc
COMPUTER SOFTWARE and SERVICES - Application Software
|
$495.96
|
+1.38
0.28% |
$499.81
|
1,368,149
44.19% of 50 DAV
50 DAV is 3,096,000
|
$536.88
-7.62%
|
9/10/2020
|
$488.46
|
PP = $536.88
|
|
MB = $563.72
|
Most Recent Note - 10/16/2020 5:26:55 PM
Y - Posted a small gain today with light volume. Color code is changed to yellow while consolidating not far below its previously noted pivot point. Volume-driven gains above the pivot point are still needed to trigger a new (or add-on) technical buy signal. Subsequent losses below the 50 DMA line ($483.91) would raise great concerns and trigger a technical sell signal. Fundamentals remain strong.
>>> FEATURED STOCK ARTICLE : Showed Resilience Near 50-Day Moving Average - 10/8/2020 |
View all notes |
Set NEW NOTE alert |
Company Profile |
SEC
News |
Chart |
Request a new note
C
A
S
I |
CRL
-
NYSE
Charles River Labs Intl
DRUGS - Biotechnology
|
$229.09
|
-4.44
-1.90% |
$235.12
|
286,617
91.57% of 50 DAV
50 DAV is 313,000
|
$250.29
-8.47%
|
7/15/2020
|
$192.66
|
PP = $189.95
|
|
MB = $199.45
|
Most Recent Note - 10/19/2020 1:51:12 PM
G - Hovering near its all-time high. Its 50 DMA line ($222) defines support where any subsequent violation would raise concerns and trigger a technical sell signal. Raised fundamental concerns when it recently reported Jun '20 quarterly earnings -3% on +4% sales revenues, below the +25% minimum guideline (C criteria).
>>> FEATURED STOCK ARTICLE : New Record High for Charles River Labs - 10/9/2020 |
View all notes |
Set NEW NOTE alert |
Company Profile |
SEC
News |
Chart |
Request a new note
C
A
S
I |
AMD
-
NASDAQ
Advanced Micro Devices
ELECTRONICS - Semiconductor - Broad Line
|
$79.20
|
-2.36
-2.89% |
$81.93
|
36,254,268
70.06% of 50 DAV
50 DAV is 51,750,000
|
$94.28
-15.99%
|
8/31/2020
|
$90.42
|
PP = $87.39
|
|
MB = $91.76
|
Most Recent Note - 10/19/2020 1:50:12 PM
G - Consolidating near its 50 DMA line ($82.08) with volume totals cooling. Reportedly is considering buying Xilinx Inc (XLNX). Damaging deterioration below the 50 DMA line and the recent low ($73.85 on 9/18/20) would raise greater concerns and trigger more worrisome technical sell signals. It has not formed a sound base and faces some near-term resistance due to overhead supply up to the $94 level. Fundamentals remain strong.
>>> FEATURED STOCK ARTICLE : Consolidating Just Above 50-Day Moving Average - 10/14/2020 |
View all notes |
Set NEW NOTE alert |
Company Profile |
SEC
News |
Chart |
Request a new note
C
A
S
I |
TER
-
NASDAQ
Teradyne Inc
ELECTRONICS - Semiconductor Equipment and Mate
|
$92.07
|
+4.13
4.70% |
$93.17
|
3,532,229
157.27% of 50 DAV
50 DAV is 2,246,000
|
$93.44
-1.47%
|
10/21/2020
|
$92.22
|
PP = $93.54
|
|
MB = $98.22
|
 Most Recent Note - 10/21/2020 5:57:03 PM
Y - Challenged its all-time high with today's 3rd consecutive gain backed by ever-increasing volume. A Subsequent gain above the pivot point backed by at least +40% above average volume may trigger a technical buy signal. Reported earnings +53% on +41% sales revenues for the Sep '20 quarter versus the year ago period, its 4th consecutive quarterly comparison with earnings above the +25% minimum earnings guideline (C criteria). Sequential comparisons show encouraging acceleration in its sales revenues growth rate. Its annual earnings (A criteria) history has been strong. See the latest FSU analysis for more details and a new annotated graph.
>>> FEATURED STOCK ARTICLE : Challenging All-Time High With Volume-Drive Gain - 10/21/2020 |
View all notes |
Set NEW NOTE alert |
Company Profile |
SEC
News |
Chart |
Request a new note
C
A
S
I |
TREX
-
NYSE
Trex Company Inc
MATERIALS and CONSTRUCTION - General Building Materials
|
$74.68
|
-1.36
-1.79% |
$77.00
|
550,415
68.97% of 50 DAV
50 DAV is 798,000
|
$81.23
-8.06%
|
6/26/2020
|
$54.53
|
PP = $66.47
|
|
MB = $69.79
|
Most Recent Note - 10/16/2020 5:23:45 PM
G - Pulled back for a 3rd consecutive loss today with below average volume. Any subsequent losses below the 50 DMA line ($72.41) or recent low ($63.32 on 9/21/20) would raise concerns and trigger technical sell signals. Fundamentals remain strong. See the latest FSU analysis for more details and a new annotated graph.
>>> FEATURED STOCK ARTICLE : Recently Wedged Into New High Territory - 10/16/2020 |
View all notes |
Set NEW NOTE alert |
Company Profile |
SEC
News |
Chart |
Request a new note
C
A
S
I |
Symbol/Exchange
Company Name
Industry Group |
PRICE |
CHANGE
(%Change) |
Day High |
Volume
(% DAV)
(% 50 day avg vol) |
52 Wk Hi
% From Hi |
Featured
Date |
Price
Featured |
Pivot Featured |
|
Max Buy |
NFLX
-
NASDAQ
Netflix Inc
SPECIALTY RETAIL - Music and Video Stores
|
$489.05
|
-36.37
-6.92% |
$506.85
|
17,353,803
293.93% of 50 DAV
50 DAV is 5,904,000
|
$575.37
-15.00%
|
10/14/2020
|
$547.45
|
PP = $557.39
|
|
MB = $585.26
|
Most Recent Note - 10/21/2020 12:18:32 PM
G - Reported earnings +18% on +23% sales revenues for the Sep '20 quarter, below the +25% minimum earnings guideline (C criteria). Gapped down today violating its 50 DMA line ($506) triggering a technical sell signal, and its color code was changed to green due to fundamental and technical deterioration. Recent low ($458.60 on 9/18/20) defines the next important near term support where any further deterioration would raise serious concerns and trigger a more worrisome technical sell signal.
>>> FEATURED STOCK ARTICLE : Encountered Distributional Pressure When Poised for Breakout - 10/15/2020 |
View all notes |
Set NEW NOTE alert |
Company Profile |
SEC
News |
Chart |
Request a new note
C
A
S
I |
LGIH
-
NASDAQ
L G I Homes Inc
Bldg-Resident/Comml
|
$118.50
|
-8.19
-6.46% |
$128.00
|
349,288
132.81% of 50 DAV
50 DAV is 263,000
|
$132.98
-10.89%
|
10/1/2020
|
$123.17
|
PP = $124.04
|
|
MB = $130.24
|
Most Recent Note - 10/21/2020 11:59:45 AM
Y - Abruptly slumping today from near its all-time high and back below its pivot point raising some concerns. Recent gains above the new pivot point lacked the +40% above average volume needed to clinch a proper new (or add-on) technical buy signal. The 50 DMA line ($116.52) defines near-term support above prior low ($101.30 on 9/21/20). See the latest FSU analysis for more details and an annotated graph.
>>> FEATURED STOCK ARTICLE : Hovering Near High But Recent Gains Lacked Great Volume - 10/19/2020 |
View all notes |
Set NEW NOTE alert |
Company Profile |
SEC
News |
Chart |
Request a new note
C
A
S
I |
NOW
-
NYSE
Servicenow Inc
Computer Sftwr-Enterprse
|
$510.28
|
-7.91
-1.53% |
$519.53
|
830,366
59.31% of 50 DAV
50 DAV is 1,400,000
|
$533.37
-4.33%
|
8/20/2020
|
$453.34
|
PP = $454.79
|
|
MB = $477.53
|
Most Recent Note - 10/19/2020 1:52:30 PM
G - Posting a 3rd consecutive gain today with below average volume for yet another new all-time high. Found support at its 50 DMA line ($472) but did not form a new base of sufficient length. Fundamentals remain strong. Any losses below the 50 DMA line and prior low ($432.85 on 9/08/20) would raise concerns and trigger technical sell signals.
>>> FEATURED STOCK ARTICLE : Record High With Light Volume Behind 3rd Consecutive Gain - 10/13/2020 |
View all notes |
Set NEW NOTE alert |
Company Profile |
SEC
News |
Chart |
Request a new note
C
A
S
I |
VEEV
-
NYSE
Veeva Systems Inc Cl A
Computer Sftwr-Medical
|
$294.83
|
-8.82
-2.90% |
$307.64
|
680,200
84.71% of 50 DAV
50 DAV is 803,000
|
$313.99
-6.10%
|
10/6/2020
|
$287.71
|
PP = $298.86
|
|
MB = $313.80
|
Most Recent Note - 10/19/2020 5:38:24 PM
Y - Reversed to close with a loss on light volume today after touching a new all-time high. Found support at its 50 DMA line ($276) while forming a 6-week flat base. Any losses below the 50 DMA line and recent lows would raise concerns and trigger technical sell signals. Reported earnings +31% on +33% sales revenues for the Jul '20 quarter versus the year ago period. Three of the past 4 quarterly comparisons were above the +25% minimum earnings guideline (C criteria)."
>>> FEATURED STOCK ARTICLE : First Sound Base Being Built After Considerable Rally - 10/6/2020 |
View all notes |
Set NEW NOTE alert |
Company Profile |
SEC
News |
Chart |
Request a new note
C
A
S
I |
TEAM
-
NASDAQ
Atlassian Corp Plc Cl A
Comp Sftwr-Spec Enterprs
|
$206.99
|
-3.98
-1.89% |
$213.21
|
1,788,114
110.99% of 50 DAV
50 DAV is 1,611,000
|
$216.30
-4.30%
|
10/12/2020
|
$193.77
|
PP = $199.60
|
|
MB = $209.58
|
Most Recent Note - 10/19/2020 12:48:35 PM
G - Powering to new 52-week highs with today's 2nd consecutive volume-driven gain. Color code is changed to green after quickly getting extended more than +5% above the prior high. Disciplined investors avoid chasing extended stocks. Its big gain above the pivot point on the prior session was backed +226% above average volume triggering a new technical buy signal. Its Relative Strength Rating has improved to 89.
>>> FEATURED STOCK ARTICLE : TEAM Perched Within Close Striking Distance of New Highs - 10/12/2020 |
View all notes |
Set NEW NOTE alert |
Company Profile |
SEC
News |
Chart |
Request a new note
C
A
S
I |
Symbol/Exchange
Company Name
Industry Group |
PRICE |
CHANGE
(%Change) |
Day High |
Volume
(% DAV)
(% 50 day avg vol) |
52 Wk Hi
% From Hi |
Featured
Date |
Price
Featured |
Pivot Featured |
|
Max Buy |
|
|
|
THESE ARE NOT BUY RECOMMENDATIONS!
Comments contained in the body of this report are technical
opinions only. The material herein has been obtained
from sources believed to be reliable and accurate, however,
its accuracy and completeness cannot be guaranteed.
This site is not an investment advisor, hence it does
not endorse or recommend any securities or other investments.
Any recommendation contained in this report may not
be suitable for all investors and it is not to be deemed
an offer or solicitation on our part with respect to
the purchase or sale of any securities. All trademarks,
service marks and trade names appearing in this report
are the property of their respective owners, and are
likewise used for identification purposes only.
This report is a service available
only to active Paid Premium Members.
You may opt-out of receiving report notifications
at any time. Questions or comments may be submitted
by writing to Premium Membership Services 665 S.E. 10 Street, Suite 201 Deerfield Beach, FL 33441-5634 or by calling 1-800-965-8307
or 954-785-1121.
|
|
|