You are not logged in.
This means you
CAN ONLY VIEW reports that were published prior to Saturday, February 24, 2024.
You
MUST UPGRADE YOUR MEMBERSHIP if you want to see any current reports.
AFTER MARKET UPDATE - MONDAY, OCTOBER 21ST, 2019
Previous After Market Report Next After Market Report >>>
|
|
|
|
DOW |
+57.44 |
26,827.64 |
+0.21% |
|
Volume |
778,171,980 |
-10% |
|
Volume |
1,736,659,530 |
-13% |
|
NASDAQ |
+71.92 |
8,161.46 |
+0.89% |
|
Advancers |
1,908 |
66% |
|
Advancers |
2,089 |
67% |
|
S&P 500 |
+20.52 |
3,006.72 |
+0.69% |
|
Decliners |
971 |
34% |
|
Decliners |
1,049 |
33% |
|
Russell 2000 |
+14.66 |
1,550.14 |
+0.95% |
|
52 Wk Highs |
177 |
|
|
52 Wk Highs |
116 |
|
|
S&P 600 |
+8.48 |
958.85 |
+0.89% |
|
52 Wk Lows |
30 |
|
|
52 Wk Lows |
70 |
|
|
 |
Breadth Positive as Major Indices Rose
Kenneth J. Gruneisen - Passed the CAN SLIM® Master's Exam
The Dow added 57 points. The S&P 500 advanced 0.7%, climbing above the 3,000 level and within 1% of its all-time high. The Nasdaq Composite jumped 0.9% as Apple (AAPL+1.73%) reached a new record high. Volume totals reported were lighter than the prior session totals on the Nasdaq exchange and on the NYSE, indicative of lackluster institutional buying demand. Breadth had a positive bias as advancers led decliners by a 2-1 margin on the NYSE and on the Nasdaq exchange. There were 80 high-ranked companies from the Leaders List that hit a new 52-week high and were listed on the BreakOuts Page, versus the total of 43 on the prior session. New 52-week highs outnumbered new 52-week lows on the NYSE and on the Nasdaq exchange.The major indices (M criteria) are in a "confirmed uptrend" after enduring distributional pressure in recent weeks. The Featured Stocks Page provides the most timely analysis on high-ranked leaders. Charts used courtesy of www.stockcharts.com
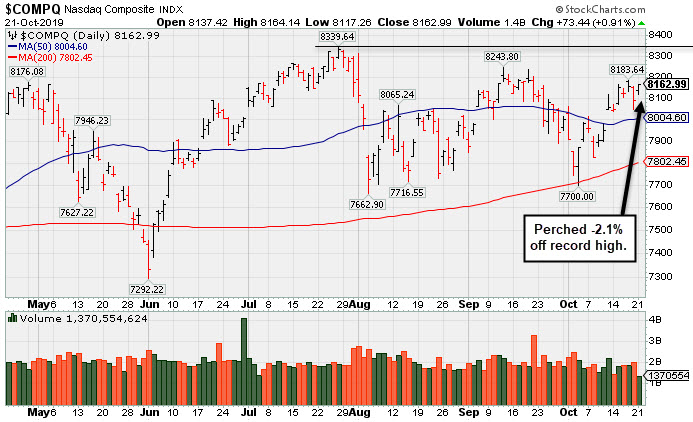
PICTURED: The Nasdaq Composite Index is above its 50-day moving average (DMA) line and perched only -2.1% off its record high hit on 7/26/19. Its 200 DMA line and prior lows define important near-term support.
U.S. equities finished higher on Monday as investors looked ahead to a jam-packed week of corporate earnings results and monitored updates on the trade front. President Trump reiterated trade negotiations with China were progressing, while White House economic advisor Larry Kudlow indicated December tariffs could be withdrawn if the talks continue to go well. This followed Chinese Vice Premier Liu He’s comments over the weekend that the U.S. and China have made “substantial progress” on trade. Brexit developments also garnered attention, after lawmakers in the U.K. decided to delay a vote on Prime Minister Boris Johnson’s new deal. Treasuries weakened, with the yield on the benchmark 10-year note adding five basis points to 1.80%.
Nine of 11 S&P 500 sectors ended the day in positive territory. The Energy group paced the gains with Halliburton (HAL +6.40%) up after the oil field services giant matched Wall Street profit estimates but had revenue that came in slightly below expectations. In other corporate news, Teva Pharmaceuticals (TEVA +8.67%) after the drug maker along with three other companies reached a last-minute settlement to avoid trial in Ohio regarding the opioid crisis. Boeing’s (BA -3.76%) decline weighed on the Dow. Shares of the jet maker fell after being the subject of multi-analyst downgrades amid continued scrutiny over its 737 MAX planes.In commodities, WTI crude declined 0.5% to $53.51/barrel. COMEX gold lost 0.4% to $1,482.40/ounce.
|
 Kenneth J. Gruneisen started out as a licensed stockbroker in August 1987, a couple of months prior to the historic stock market crash that took the Dow Jones Industrial Average down -22.6% in a single day. He has published daily fact-based fundamental and technical analysis on high-ranked stocks online for two decades. Through FACTBASEDINVESTING.COM, Kenneth provides educational articles, news, market commentary, and other information regarding proven investment systems that work in good times and bad.
Comments contained in the body of this report are technical opinions only and are not necessarily those of Gruneisen Growth Corp. The material herein has been obtained from sources believed to be reliable and accurate, however, its accuracy and completeness cannot be guaranteed. Our firm, employees, and customers may effect transactions, including transactions contrary to any recommendation herein, or have positions in the securities mentioned herein or options with respect thereto. Any recommendation contained in this report may not be suitable for all investors and it is not to be deemed an offer or solicitation on our part with respect to the purchase or sale of any securities. |
|
 |
Financial, Tech, Retail, and Energy-Linked Groups Rose
Kenneth J. Gruneisen - Passed the CAN SLIM® Master's Exam
The Broker/Dealer Index ($XBD +1.07%) and the Bank Index ($BKX +1.84%) both posted solid gains and outpaced the Retail Index ($RLX +0.62%). The tech sector had a positive bias as the Semiconductor Index ($SOX +1.88%), Biotech Index ($BTK +1.49%) and the Networking Index ($NWX +1.63%) posted unanimous gains. The Oil Services Index ($OSX +3.37%) and the Integrated Oil Index ($XOI +1.58%) both rose.
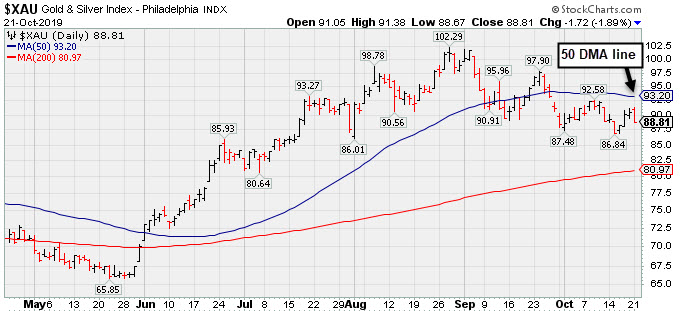
PICTURED: The Gold & Silver Index ($XAU -1.89%) was a standout decliner and has been sputtering below its 50-day moving average line several weeks.
| Oil Services |
$OSX |
64.98 |
+2.12 |
+3.37% |
-19.38% |
| Integrated Oil |
$XOI |
1,204.56 |
+18.75 |
+1.58% |
+3.92% |
| Semiconductor |
$SOX |
1,620.04 |
+29.95 |
+1.88% |
+40.24% |
| Networking |
$NWX |
564.37 |
+9.06 |
+1.63% |
+15.49% |
| Broker/Dealer |
$XBD |
260.88 |
+2.76 |
+1.07% |
+9.92% |
| Retail |
$RLX |
2,411.04 |
+14.81 |
+0.62% |
+23.55% |
| Gold & Silver |
$XAU |
88.81 |
-1.72 |
-1.90% |
+25.69% |
| Bank |
$BKX |
102.86 |
+1.87 |
+1.85% |
+19.90% |
| Biotech |
$BTK |
4,343.55 |
+63.96 |
+1.49% |
+2.91% |
|
|
|
 |
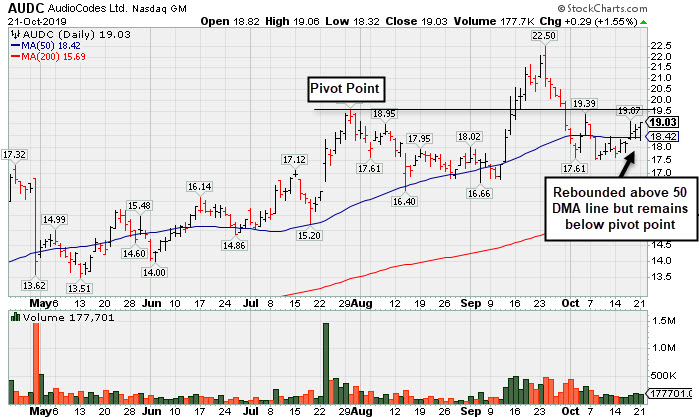
Consolidating Above 50-Day Average But Below Prior Pivot Point
Kenneth J. Gruneisen - Passed the CAN SLIM® Master's Exam
Audiocodes Ltd (AUDC +$0.29 or +1.55% to $19.03) has rebounded above its 50-day moving average (DMA) line ($18.42) but remains below its pivot point after slumping since a "negative reversal" at its all-time high. The recent low ($17.54 on 10/08/19) defines the next important support where more damaging losses would raise concerns and trigger a technical sell signal.
Bullish action came after it reported earnings +57% on +14% sales revenues for the Jun '19 quarter, continuing its strong earnings track record for a 10th consecutive quarterly comparison above the +25% minimum guideline (C criteria). Annual earnings growth has been strong and it has a 99 Earnings Per Share Rating.
AUDC was highlighted in yellow with new pivot point cited based on its 4/24/19 high plus 10 cents in the 7/15/19 mid-day report (read here). This Israel-based designer of advanced voice-over-IP products shown in this FSU section on 10/02/19 with an annotated graph under the headline, "Sank Below 50-Day Average as 7 Straight Losses Follow Reversal".
The number of top-rated funds owning its shares rose from 33 in Mar '18 to 77 in Sep '19, a reassuring sign concerning the I criteria. Its current Up/Down Volume Ratio of 0.9 is an unbiased indication its shares have been under very slight distributional pressure over the past 50 days. It has a Timeliness Rating of B and Sponsorship Rating of B. The small supply of 22.8 million shares (S criteria) in the public float can contribute to greater price volatility in the event of institutional buying or selling.
Charts courtesy of www.stockcharts.com
 |
|
|
Color Codes Explained :
Y - Better candidates highlighted by our
staff of experts.
G - Previously featured
in past reports as yellow but may no longer be buyable under the
guidelines.
***Last / Change / Volume data in this table is the closing quote data***
Symbol/Exchange
Company Name
Industry Group |
PRICE |
CHANGE
(%Change) |
Day High |
Volume
(% DAV)
(% 50 day avg vol) |
52 Wk Hi
% From Hi |
Featured
Date |
Price
Featured |
Pivot Featured |
|
Max Buy |
 MLR
-
NYSE
MLR
-
NYSE
Miller Industries Inc
AUTOMOTIVE - Auto Parts
|
$32.20
|
+0.17
0.53% |
$32.90
|
43,681
145.60% of 50 DAV
50 DAV is 30,000
|
$35.26
-8.68%
|
9/24/2019
|
$34.00
|
PP = $35.36
|
|
MB = $37.13
|
 Most Recent Note - 10/21/2019 5:43:51 PM
G - Sputtering near its 50 DMA line ($32.42). Halted its slide recently at its 200 DMA line. Subsequent gains above the pivot point backed by at least +40% above average volume may trigger a technical buy signal. Fundamentals remain strong.
>>> FEATURED STOCK ARTICLE : Tested Support at Long-Term 200-Day Moving Average - 10/9/2019 |
View all notes |
Set NEW NOTE alert |
Company Profile |
SEC
News |
Chart |
Request a new note
C
A
S
I |
CCBG
-
NASDAQ
Capital City Bk Gp
BANKING - Regional - Mid-Atlantic Banks
|
$27.51
|
+0.46
1.70% |
$27.74
|
23,806
88.17% of 50 DAV
50 DAV is 27,000
|
$28.00
-1.75%
|
9/13/2019
|
$27.03
|
PP = $27.05
|
|
MB = $28.40
|
Most Recent Note - 10/17/2019 4:14:59 PM
Y - Still hovering near its 52-week high. Prior highs define initial support to watch above its 50 DMA line ($25.74). Due to report earnings news on 10/21/19.
>>> FEATURED STOCK ARTICLE : Perched Near High With Earnings News Due Next Week - 10/14/2019 |
View all notes |
Set NEW NOTE alert |
Company Profile |
SEC
News |
Chart |
Request a new note
C
A
S
I |
EPAM
-
NYSE
Epam Systems Inc
COMPUTER SOFTWARE and SERVICES - Information Technology Service
|
$185.98
|
-0.98
-0.52% |
$188.13
|
201,059
65.92% of 50 DAV
50 DAV is 305,000
|
$201.00
-7.47%
|
5/9/2019
|
$169.25
|
PP = $180.55
|
|
MB = $189.58
|
Most Recent Note - 10/21/2019 5:44:53 PM
G - Consolidating near its 50 DMA line ($186.88). Faces little resistance due to overhead supply up to the $201 level. Prior lows in the $174-175 area define the next important support level. Reported earnings +27% on +24% sales revenues for the Jun '19 quarter.
>>> FEATURED STOCK ARTICLE : Faces Some Resistance Due to Overhead Supply - 10/16/2019 |
View all notes |
Set NEW NOTE alert |
Company Profile |
SEC
News |
Chart |
Request a new note
C
A
S
I |
AUDC
-
NASDAQ
Audiocodes Ltd
ELECTRONICS - Scientific and Technical Instrum
|
$19.03
|
+0.29
1.55% |
$19.06
|
177,501
89.65% of 50 DAV
50 DAV is 198,000
|
$22.50
-15.42%
|
9/13/2019
|
$19.68
|
PP = $19.84
|
|
MB = $20.83
|
Most Recent Note - 10/21/2019 5:42:13 PM
G - Consolidating above its 50 DMA line ($18.43) but still sputtering below the prior pivot point. Recent low ($17.54 on 10/08/19) defines the next important support. See the latest FSU analysis for more details and a new annotated graph.
>>> FEATURED STOCK ARTICLE : Consolidating Above 50-Day Average But Below Prior Pivot Point - 10/21/2019 |
View all notes |
Set NEW NOTE alert |
Company Profile |
SEC
News |
Chart |
Request a new note
C
A
S
I |
CHDN
-
NASDAQ
Churchill Downs Inc
LEISURE - Gaming Activities
|
$130.77
|
-0.54
-0.41% |
$133.55
|
289,429
120.60% of 50 DAV
50 DAV is 240,000
|
$132.73
-1.48%
|
10/8/2019
|
$129.77
|
PP = $132.83
|
|
MB = $139.47
|
Most Recent Note - 10/18/2019 5:51:40 PM
Y - Churned heavy volume as it rallied for a best-ever close today. Stubbornly holding its ground near its all-time high following volume-driven gains last week. Subsequent gains above the pivot point backed by at least +40% above average volume may trigger a new (or add-on) technical buy signal. Its 50 DMA line ($123.42) acted as support in recent weeks during its consolidation. Jun '19 earnings +10% on +26% sales revenues versus the year ago period were below the +25% minimum earnings guideline (C criteria), noted recently raising fundamental concerns.
>>> FEATURED STOCK ARTICLE : Volume-Driven Gain for Record High Close - 10/8/2019 |
View all notes |
Set NEW NOTE alert |
Company Profile |
SEC
News |
Chart |
Request a new note
C
A
S
I |
Symbol/Exchange
Company Name
Industry Group |
PRICE |
CHANGE
(%Change) |
Day High |
Volume
(% DAV)
(% 50 day avg vol) |
52 Wk Hi
% From Hi |
Featured
Date |
Price
Featured |
Pivot Featured |
|
Max Buy |
LULU
-
NASDAQ
Lululemon Athletica
MANUFACTURING - Textile Manufacturing
|
$205.28
|
-1.83
-0.88% |
$207.65
|
1,563,429
84.60% of 50 DAV
50 DAV is 1,848,000
|
$209.02
-1.79%
|
9/6/2019
|
$201.25
|
PP = $194.35
|
|
MB = $204.07
|
Most Recent Note - 10/18/2019 5:44:08 PM
G - Hit a new all-time high as it rose above its "max buy" level and its color code is changed to green. Its 50 DMA line ($190) and recent low ($185.36 on 10/03/19) define important near-term support. See the latest FSU analysis for more details and a new annotated graph.
>>> FEATURED STOCK ARTICLE : LULU Stretches to Hit New Record High - 10/18/2019 |
View all notes |
Set NEW NOTE alert |
Company Profile |
SEC
News |
Chart |
Request a new note
C
A
S
I |
CPRT
-
NASDAQ
Copart Inc
SPECIALTY RETAIL - Auto Dealerships
|
$83.62
|
+1.30
1.58% |
$84.33
|
4,265,850
301.69% of 50 DAV
50 DAV is 1,414,000
|
$83.70
-0.10%
|
9/5/2019
|
$79.13
|
PP = $79.84
|
|
MB = $83.83
|
Most Recent Note - 10/21/2019 11:57:54 AM
G - Color code is changed to green after rallying above its "max buy" level and hitting a new all-time high with today's volume-driven gain. Its 50 DMA line ($79.16) defines near-term support above the prior low ($76.35 on 10/03/19).
>>> FEATURED STOCK ARTICLE : Found Prompt Support Near 50-Day Moving Average - 10/4/2019 |
View all notes |
Set NEW NOTE alert |
Company Profile |
SEC
News |
Chart |
Request a new note
C
A
S
I |
PFPT
-
NASDAQ
Proofpoint Inc
Computer Sftwr-Security
|
$119.99
|
+0.55
0.46% |
$120.89
|
706,461
95.18% of 50 DAV
50 DAV is 742,200
|
$133.58
-10.17%
|
10/1/2019
|
$129.59
|
PP = $132.95
|
|
MB = $139.60
|
Most Recent Note - 10/18/2019 5:50:04 PM
G - Violated its 50 DMA line ($122.75) with a volume-driven loss today triggering a technical sell signal and its color code is changed to green. Met stubborn resistance in the $132 area in recent months. A prompt rebound above the 50 DMA line is needed for its outlook to improve.
>>> FEATURED STOCK ARTICLE : Recently Met Stubborn Resistance Near Prior Highs - 10/17/2019 |
View all notes |
Set NEW NOTE alert |
Company Profile |
SEC
News |
Chart |
Request a new note
C
A
S
I |
BLD
-
NYSE
Topbuild Corp
Bldg-Constr Prds/Misc
|
$101.43
|
-0.18
-0.18% |
$102.81
|
205,895
85.08% of 50 DAV
50 DAV is 242,000
|
$102.72
-1.26%
|
5/17/2019
|
$82.19
|
PP = $87.31
|
|
MB = $91.68
|
Most Recent Note - 10/17/2019 4:14:20 PM
G - Wedged into all-time high territory with today's 5th consecutive gain lacking great volume conviction. Earnings rose +39% on +9% sales revenues for the Jun '19 quarter versus the year ago period. Its 50 DMA line ($93.61) defines important support to watch along with its prior low ($91.31 on 10/03/19).
>>> FEATURED STOCK ARTICLE : Near High After Finding Support at 50-Day Average - 10/7/2019 |
View all notes |
Set NEW NOTE alert |
Company Profile |
SEC
News |
Chart |
Request a new note
C
A
S
I |
PAGS
-
NYSE
Pagseguro Digital Cl A
Finance-CrdtCard/PmtPr
|
$38.95
|
+0.10
0.26% |
$39.25
|
2,423,624
110.32% of 50 DAV
50 DAV is 2,197,000
|
$53.43
-27.10%
|
6/25/2019
|
$37.69
|
PP = $40.07
|
|
MB = $42.07
|
Most Recent Note - 10/18/2019 5:47:03 PM
G - After a gap down violated prior lows in the $42-43 area triggering a worrisome technical sell signal it completed a Secondary Offering on 10/17/19. A rebound above the 50 DMA line ($47) still is needed for its outlook to improve.
>>> FEATURED STOCK ARTICLE : Rebound Above 50-Day Average Needed for Outlook to Improve - 10/10/2019 |
View all notes |
Set NEW NOTE alert |
Company Profile |
SEC
News |
Chart |
Request a new note
C
A
S
I |
Symbol/Exchange
Company Name
Industry Group |
PRICE |
CHANGE
(%Change) |
Day High |
Volume
(% DAV)
(% 50 day avg vol) |
52 Wk Hi
% From Hi |
Featured
Date |
Price
Featured |
Pivot Featured |
|
Max Buy |
|
|
|
THESE ARE NOT BUY RECOMMENDATIONS!
Comments contained in the body of this report are technical
opinions only. The material herein has been obtained
from sources believed to be reliable and accurate, however,
its accuracy and completeness cannot be guaranteed.
This site is not an investment advisor, hence it does
not endorse or recommend any securities or other investments.
Any recommendation contained in this report may not
be suitable for all investors and it is not to be deemed
an offer or solicitation on our part with respect to
the purchase or sale of any securities. All trademarks,
service marks and trade names appearing in this report
are the property of their respective owners, and are
likewise used for identification purposes only.
This report is a service available
only to active Paid Premium Members.
You may opt-out of receiving report notifications
at any time. Questions or comments may be submitted
by writing to Premium Membership Services 665 S.E. 10 Street, Suite 201 Deerfield Beach, FL 33441-5634 or by calling 1-800-965-8307
or 954-785-1121.
|
|
|