You are not logged in.
This means you
CAN ONLY VIEW reports that were published prior to Sunday, February 25, 2024.
You
MUST UPGRADE YOUR MEMBERSHIP if you want to see any current reports.
AFTER MARKET UPDATE - FRIDAY, OCTOBER 19TH, 2018
Previous After Market Report Next After Market Report >>>
|
|
|
|
DOW |
+64.89 |
25,444.34 |
+0.26% |
|
Volume |
938,557,710 |
+13% |
|
Volume |
2,525,859,690 |
+0% |
|
NASDAQ |
-36.11 |
7,449.03 |
-0.48% |
|
Advancers |
1,454 |
49% |
|
Advancers |
938 |
31% |
|
S&P 500 |
-1.00 |
2,767.78 |
-0.04% |
|
Decliners |
1,521 |
51% |
|
Decliners |
2,111 |
69% |
|
Russell 2000 |
-18.71 |
1,542.04 |
-1.20% |
|
52 Wk Highs |
20 |
|
|
52 Wk Highs |
17 |
|
|
S&P 600 |
-10.15 |
962.06 |
-1.04% |
|
52 Wk Lows |
256 |
|
|
52 Wk Lows |
228 |
|
|
 |
Leadership Elusive as Major Indices End Mixed
Kenneth J. Gruneisen - Passed the CAN SLIM® Master's Exam
For the week, the Dow gained 0.4%, the S&P 500 added less than 0.1%, while the Nasdaq Composite declined 0.6%. Stocks finished mixed Friday. The Dow added 64 points to 25444 while the S&P 500 lost 1 point to 2767. The Nasdaq Composite fell 36 points to 7449. Volume totals reported were higher on the NYSE and on the Nasdaq exchange versus the prior session. Decliners slightly outnumbered advancers on the NYSE but decliners led by a decisive 2-1 margin on the Nasdaq exchange. There were 5 high-ranked companies from the Leaders List that made new 52-week highs and were listed on the BreakOuts Page, versus 4 on the prior session, as market leadership remained very elusive. New 52-week lows totals expanded again and easily outnumbered new 52-week highs on the NYSE and Nasdaq exchange. Recent reports have noted that the major indices (M criteria) have shown action indicative of a market correction while leadership disappeared. During market corrections investors should have a bias toward selling stocks on a case-by-case basis as technical sell signals occur, raising cash levels while reducing market exposure. The Featured Stocks Page provides the most timely analysis on high-ranked leaders. Charts used courtesy of www.stockcharts.com
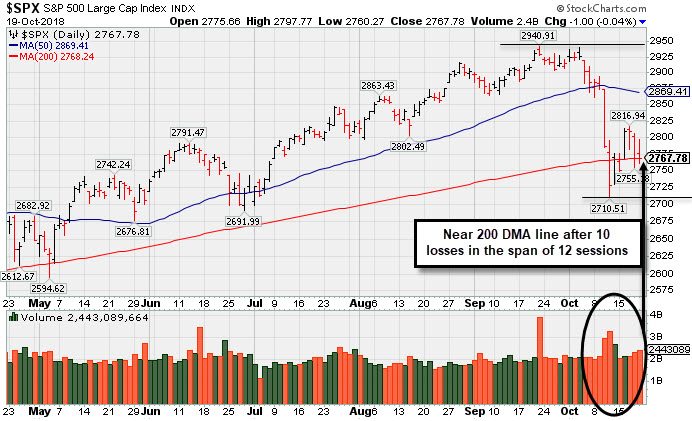
PICTURED: The S&P 500 Index is near its 200-day moving average (DMA) line after 10 losses in the span of 12 sessions. Technically, the market still is in a "correction" under the fact-based investment system. Friday marked Day 6 of the current rally attempt. Investors should watch for a subsequent gain or "follow-through day" to be noted. most ideally between Day 4 and Day 7, with solid gains on higher volume and leadership expansion all necessary elements to confirm a new rally. New buying efforts are against the rules and discouraged until a convincing follow-through day occurs.
The Dow snapped a three week losing streak as investors digested a deluge of strong corporate earnings reports. On the data front, the lone update revealed existing home sales fell for the sixth consecutive month in September and are near the lowest level in three years. In geopolitics, President Trump and Chinese President Xi will reportedly meet at next month’s G-20 summit to negotiate a new trade pact.
Six of 11 S&P 500 sectors finished in positive territory. Consumer Staples led gainers as Procter & Gamble (PG +8.80%) surged after the company posted its strongest quarterly sales growth in five years. Materials lagged as DowDuPont (DWDP -1.86%) fell after the company disclosed a one-time mark-down of $4.6 billion to its agriculture business unit. The Tech sector finished slightly higher with Apple (AAPL +1.52%) up. Shares of PayPal (PYPL +9.42%) rallied after the consumer payment processor topped analyst earnings estimates.
Treasuries weakened with the yield on the 10-year note up one basis point to 3.19%. In commodities, WTI crude climbed 1% to $69.32/barrel. COMEX gold lost 0.1% to $1,225.30/ounce despite a weaker dollar. |
 Kenneth J. Gruneisen started out as a licensed stockbroker in August 1987, a couple of months prior to the historic stock market crash that took the Dow Jones Industrial Average down -22.6% in a single day. He has published daily fact-based fundamental and technical analysis on high-ranked stocks online for two decades. Through FACTBASEDINVESTING.COM, Kenneth provides educational articles, news, market commentary, and other information regarding proven investment systems that work in good times and bad.
Comments contained in the body of this report are technical opinions only and are not necessarily those of Gruneisen Growth Corp. The material herein has been obtained from sources believed to be reliable and accurate, however, its accuracy and completeness cannot be guaranteed. Our firm, employees, and customers may effect transactions, including transactions contrary to any recommendation herein, or have positions in the securities mentioned herein or options with respect thereto. Any recommendation contained in this report may not be suitable for all investors and it is not to be deemed an offer or solicitation on our part with respect to the purchase or sale of any securities. |
|
 |
Retail and Tech Indices Led Group Decliners
Kenneth J. Gruneisen - Passed the CAN SLIM® Master's Exam
The Retail Index ($RLX -0.68%) fell, Bank Index ($BKX -0.08%) finished flat, and Broker/Dealer Index ($XBD +0.36%) eked out a small gain on Friday. The tech sector had a negative bias as the Biotech Index ($BTK -1.78%), Semiconductor Index ($SOX -1.55%), and the Networking Index ($NWX -1.28%) ended unanimously lower. The Integrated Oil Index ($XOI -1.63%) and the Oil Services Index ($OSX -0.64%) both fell, meanwhile the Gold & Silver Index ($XAU +0.05%) finished flat.
Charts courtesy of www.stockcharts.com
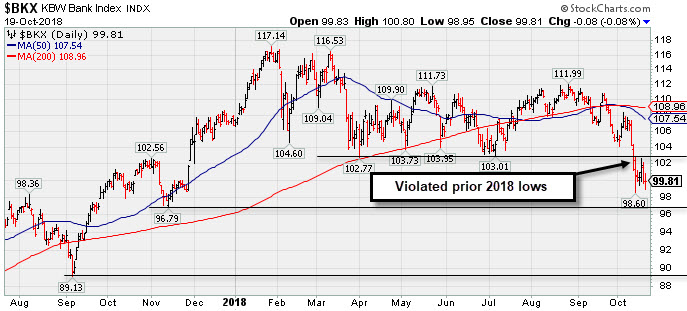 PICTURED: The Bank Index ($BKX -0.08%) recently violated prior 2018 lows. Weakness bodes poorly for the broader market outlook because the financial indices have been very reliable leading indicators. Historically, longtime readers know that the major indices have been prone to their most severe downdrafts when financial stocks were already weak. Any rebound and recovery above the 50 and 200 DMA lines would reassuring, but further deterioration for the BKX is a more ominous sign.
| Oil Services |
$OSX |
137.69 |
-0.88 |
-0.64% |
-7.93% |
| Integrated Oil |
$XOI |
1,442.16 |
-23.89 |
-1.63% |
+7.98% |
| Semiconductor |
$SOX |
1,225.94 |
-19.36 |
-1.55% |
-2.16% |
| Networking |
$NWX |
518.09 |
-6.74 |
-1.28% |
+5.62% |
| Broker/Dealer |
$XBD |
262.57 |
+0.95 |
+0.36% |
-1.01% |
| Retail |
$RLX |
2,184.58 |
-14.85 |
-0.68% |
+26.00% |
| Gold & Silver |
$XAU |
70.09 |
+0.04 |
+0.06% |
-17.80% |
| Bank |
$BKX |
99.81 |
-0.08 |
-0.08% |
-6.47% |
| Biotech |
$BTK |
4,883.66 |
-88.49 |
-1.78% |
+15.67% |
|
|
|
 |
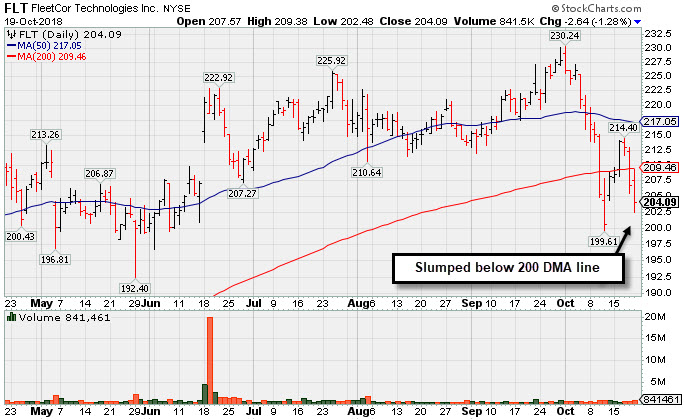
Volume Behind 200 Day Moving Average Line Violation
Kenneth J. Gruneisen - Passed the CAN SLIM® Master's Exam
FleetCor Technologies, Inc (FLT -$2.64 or -1.28% to $204.09) fell further below its 200-day moving average (DMA) line ($209) with today's volume-driven loss. it will be dropped from the Featured Stocks list tonight. A prompt recovery and subsequent rebound above the 50 DMA line ($217) is needed for its outlook to improve. Three out of 4 stocks tend to follow the direction of the broader market (M criteria) which has been repeatedly noted in a "correction".
Recently it reported earnings +29% on +8% sales revenues for the Jun '18 quarter, its 3rd consecutive quarterly comparison above the +25% minimum guideline (C criteria). Annual earnings history (A criteria) has been strong, a good match with the fact-based investment system's guidelines.
The number of top-rated funds owning its shares rose from 665 in Mar '15 to 1,230 in Sep '18, a reassuring sign concerning the I criteria. Its Relative Strength Rating is 73, below the 80+ minimum guideline for buy candidates. Its current Up/Down Volume Ratio of 0.9 is an unbiased indication that over the past 50 days it has been under mild distributional pressure. It now has a Timeliness Rating of A and a Sponsorship rating of B.
The company hails from the Finance - Credit Card Payment Processing group which includes Visa (V) and MasterCard (MA). The Group Relative Strength Rating is 87, a reassuring sign concerning the L criteria. The company completed a Secondary Offering on 9/11/13. Prior Secondary Offerings on 3/14/12, 6/11/12, 11/29/12, and 3/08/13 were previously noted, "Such offerings often are a short-term hindrance to upward price progress yet typically result in broader institutional ownership interest."
|
|
|
Color Codes Explained :
Y - Better candidates highlighted by our
staff of experts.
G - Previously featured
in past reports as yellow but may no longer be buyable under the
guidelines.
***Last / Change / Volume data in this table is the closing quote data***
Symbol/Exchange
Company Name
Industry Group |
PRICE |
CHANGE
(%Change) |
Day High |
Volume
(% DAV)
(% 50 day avg vol) |
52 Wk Hi
% From Hi |
Featured
Date |
Price
Featured |
Pivot Featured |
|
Max Buy |
SIVB
-
NASDAQ
S V B Financial Group
BANKING - Regional - Pacific Banks
|
$281.84
|
-7.37
-2.55% |
$295.95
|
792,188
192.75% of 50 DAV
50 DAV is 411,000
|
$333.74
-15.55%
|
8/6/2018
|
$314.77
|
PP = $329.75
|
|
MB = $346.24
|
 Most Recent Note - 10/19/2018 12:48:40 PM
G - Sputtering below its 200 DMA ($289) and recently testing near its 7/02/18 low ($284.42). A rebound above the 50 DMA line ($316) is needed for its outlook to improve.
>>> FEATURED STOCK ARTICLE : Weak Action Amid Broader Market Declines - 10/11/2018 |
View all notes |
Set NEW NOTE alert |
Company Profile |
SEC
News |
Chart |
Request a new note
C
A
S
I |
GMED
-
NYSE
Globus Medical Inc Cl A
CHEMICALS - Specialty Chemicals
|
$52.54
|
-2.52
-4.58% |
$55.12
|
874,059
143.05% of 50 DAV
50 DAV is 611,000
|
$57.55
-8.71%
|
9/26/2018
|
$56.11
|
PP = $57.65
|
|
MB = $60.53
|
Most Recent Note - 10/19/2018 6:36:52 PM
G - Color code is changed to green after slumping back below its 50 DMA line ($52.88) with a volume-driven loss today hurting its outlook. A rebound and subsequent gains above the pivot point backed by more than +40% above average volume are needed to trigger a proper technical buy signal.
>>> FEATURED STOCK ARTICLE : Rallying Near Pivot Point With Volume-Driven Gains - 9/26/2018 |
View all notes |
Set NEW NOTE alert |
Company Profile |
SEC
News |
Chart |
Request a new note
C
A
S
I |
ZBRA
-
NASDAQ
Zebra Tech Corp Cl A
COMPUTER HARDWARE - Computer Peripherals
|
$164.95
|
-3.54
-2.10% |
$170.72
|
398,142
106.17% of 50 DAV
50 DAV is 375,000
|
$179.47
-8.09%
|
8/7/2018
|
$164.26
|
PP = $161.82
|
|
MB = $169.91
|
Most Recent Note - 10/16/2018 6:12:39 PM
G - Rebounded above the 50 DMA line ($167.93) with above average volume behind today's 4th consecutive gain, helping its outlook to improve. Still faces near-term resistance due to overhead supply up to $179.
>>> FEATURED STOCK ARTICLE : Hovering Near All-Time High With Strong Fundamentals - 9/24/2018 |
View all notes |
Set NEW NOTE alert |
Company Profile |
SEC
News |
Chart |
Request a new note
C
A
S
I |
CME
-
NASDAQ
C M E Group Inc
DIVERSIFIED SERVICES - Business/Management Services
|
$182.65
|
+0.73
0.40% |
$183.79
|
1,730,619
122.83% of 50 DAV
50 DAV is 1,409,000
|
$183.20
-0.30%
|
10/4/2018
|
$179.29
|
PP = $177.45
|
|
MB = $186.32
|
Most Recent Note - 10/15/2018 4:38:07 PM
Y - Pulled back amid broad market weakness (M criteria), undercutting prior highs in the $177 area, raising concerns. The 50 DMA line ($172) defines important near-term support.
>>> FEATURED STOCK ARTICLE : CME Group Blasted to New Record High - 10/4/2018 |
View all notes |
Set NEW NOTE alert |
Company Profile |
SEC
News |
Chart |
Request a new note
C
A
S
I |
FLT
-
NYSE
Fleetcor Technologies
DIVERSIFIED SERVICES - Business/Management Services
|
$204.09
|
-2.64
-1.28% |
$209.38
|
839,731
172.18% of 50 DAV
50 DAV is 487,700
|
$230.24
-11.36%
|
9/12/2018
|
$221.01
|
PP = $226.02
|
|
MB = $237.32
|
Most Recent Note - 10/19/2018 6:33:35 PM
Slumped further below its 200 DMA line ($209) with today's volume-driven loss. It will be dropped from the Featured Stocks list tonight. See the latest FSU analysis for more details and a new annotated graph.
>>> FEATURED STOCK ARTICLE : Volume Behind 200 Day Moving Average Line Violation - 10/19/2018 |
View all notes |
Set NEW NOTE alert |
Company Profile |
SEC
News |
Chart |
Request a new note
C
A
S
I |
Symbol/Exchange
Company Name
Industry Group |
PRICE |
CHANGE
(%Change) |
Day High |
Volume
(% DAV)
(% 50 day avg vol) |
52 Wk Hi
% From Hi |
Featured
Date |
Price
Featured |
Pivot Featured |
|
Max Buy |
MA
-
NYSE
Mastercard Inc Cl A
Finance-CrdtCard/PmtPr
|
$203.06
|
-0.56
-0.28% |
$207.44
|
4,809,831
136.49% of 50 DAV
50 DAV is 3,524,000
|
$225.35
-9.89%
|
7/11/2018
|
$203.84
|
PP = $204.10
|
|
MB = $214.31
|
Most Recent Note - 10/18/2018 12:41:20 PM
G - Found support above its 200 DMA line ($191), however, a rebound above the 50 DMA line ($211) is needed for its outlook to improve.
>>> FEATURED STOCK ARTICLE : Hovering Near High, Extended From Any Sound Base - 9/27/2018 |
View all notes |
Set NEW NOTE alert |
Company Profile |
SEC
News |
Chart |
Request a new note
C
A
S
I |
V
-
NYSE
Visa Inc Cl A
Finance-CrdtCard/PmtPr
|
$140.08
|
+0.79
0.57% |
$142.19
|
8,662,419
110.32% of 50 DAV
50 DAV is 7,852,000
|
$151.56
-7.57%
|
4/26/2018
|
$126.68
|
PP = $126.98
|
|
MB = $133.33
|
Most Recent Note - 10/17/2018 5:47:18 PM
G - Following noted technical sell signals, a rebound above the 50 DMA line ($144) is needed for its outlook to improve. Found support after slumping near its 200 DMA line ($131) last week. See the latest FSU analysis for more details and a new annotated graph.
>>> FEATURED STOCK ARTICLE : Rebounding Toward 50-Day Moving Average - 10/17/2018 |
View all notes |
Set NEW NOTE alert |
Company Profile |
SEC
News |
Chart |
Request a new note
C
A
S
I |
TPL
-
NYSE
Texas Pacific Land Trust
Real Estate Dvlpmt/Ops
|
$774.36
|
-10.05
-1.28% |
$786.32
|
10,692
82.25% of 50 DAV
50 DAV is 13,000
|
$877.97
-11.80%
|
9/14/2018
|
$820.45
|
PP = $874.10
|
|
MB = $917.81
|
Most Recent Note - 10/15/2018 4:48:23 PM
G - Slumped further today after losses last week triggered technical sell signals. A rebound above the 50 DMA line ($828) is needed for its outlook to improve. The prior low ($760 on 8/15/18) defines the next important near-term support to watch.
>>> FEATURED STOCK ARTICLE : Slump Below 50-Day Moving Average Hurt Technical Stance - 10/12/2018 |
View all notes |
Set NEW NOTE alert |
Company Profile |
SEC
News |
Chart |
Request a new note
C
A
S
I |
ABMD
-
NASDAQ
Abiomed Inc
HEALTH SERVICES - Medical Instruments and Supplies
|
$362.42
|
-24.21
-6.26% |
$391.70
|
846,193
146.91% of 50 DAV
50 DAV is 576,000
|
$459.75
-21.17%
|
9/25/2018
|
$441.96
|
PP = $451.03
|
|
MB = $473.58
|
Most Recent Note - 10/19/2018 6:31:20 PM
Slumped further below its 50 DMA line ($392) and ended near the session low with a big loss today on higher volume. It will be dropped from the Featured Stocks list tonight.
>>> FEATURED STOCK ARTICLE : Quick Rebound Near Prior High - 9/25/2018 |
View all notes |
Set NEW NOTE alert |
Company Profile |
SEC
News |
Chart |
Request a new note
C
A
S
I |
DPZ
-
NYSE
Dominos Pizza Inc
Retail-Restaurants
|
$267.75
|
+1.37
0.51% |
$270.98
|
795,876
145.76% of 50 DAV
50 DAV is 546,000
|
$305.34
-12.31%
|
8/13/2018
|
$288.60
|
PP = $293.91
|
|
MB = $308.61
|
Most Recent Note - 10/19/2018 12:23:15 PM
G - Managed a "positive reversal" on 10/17/18 after testing near its 200 DMA line ($254), however, a rebound above the 50 DMA line ($286) is needed for its outlook to improve. The prior low ($253.63 on 7/31/18) and 200 DMA line define important near-term support to watch. Reported earnings +54% on +22% sales revenues for the Sep '18 quarter, continuing its strong earnings track record.
>>> FEATURED STOCK ARTICLE : Sank Below 50 DMA Line Ahead of Earnings News - 10/15/2018 |
View all notes |
Set NEW NOTE alert |
Company Profile |
SEC
News |
Chart |
Request a new note
C
A
S
I |
Symbol/Exchange
Company Name
Industry Group |
PRICE |
CHANGE
(%Change) |
Day High |
Volume
(% DAV)
(% 50 day avg vol) |
52 Wk Hi
% From Hi |
Featured
Date |
Price
Featured |
Pivot Featured |
|
Max Buy |
FIVE
-
NASDAQ
Five Below Inc
Retail-DiscountandVariety
|
$114.80
|
-0.24
-0.21% |
$118.09
|
658,988
69.15% of 50 DAV
50 DAV is 953,000
|
$136.13
-15.67%
|
7/6/2018
|
$98.90
|
PP = $104.09
|
|
MB = $109.29
|
Most Recent Note - 10/16/2018 3:58:40 PM
G - It has not formed a sound base but has rebounded above the 50 DMA line ($118.68) with today's quiet gain helping its outlook to improve. The prior high ($109.09 on 7/19/18) defines the next important support level to watch.
>>> FEATURED STOCK ARTICLE : Retreating After +138% Rally in Under 12 Months - 10/2/2018 |
View all notes |
Set NEW NOTE alert |
Company Profile |
SEC
News |
Chart |
Request a new note
C
A
S
I |
NVEE
-
NASDAQ
N V 5 Global Inc
Comml Svcs-Consulting
|
$83.70
|
-0.50
-0.59% |
$84.93
|
48,315
57.52% of 50 DAV
50 DAV is 84,000
|
$92.75
-9.76%
|
6/15/2018
|
$7,070.00
|
PP = $72.00
|
|
MB = $75.60
|
Most Recent Note - 10/15/2018 4:35:29 PM
G - Posted a second consecutive small gain with lighter volume. A rebound above the 50 DMA line ($86.85) still is needed for its outlook to improve.
>>> FEATURED STOCK ARTICLE : Recently Slumped Below 50-Day Moving Average Line - 10/8/2018 |
View all notes |
Set NEW NOTE alert |
Company Profile |
SEC
News |
Chart |
Request a new note
C
A
S
I |
PANW
-
NYSE
Palo Alto Networks
Computer Sftwr-Security
|
$193.51
|
-9.05
-4.47% |
$204.74
|
1,999,317
153.32% of 50 DAV
50 DAV is 1,304,000
|
$239.50
-19.20%
|
6/12/2018
|
$206.55
|
PP = $214.69
|
|
MB = $225.42
|
Most Recent Note - 10/19/2018 6:38:54 PM
Violated its 200 DMA line ($197) with a big volume-driven loss today triggering a more worrisome technical sell signal. It will be dropped from the Featured Stocks list tonight.
>>> FEATURED STOCK ARTICLE : Consolidating Above 200-Day Moving Average Line - 10/18/2018 |
View all notes |
Set NEW NOTE alert |
Company Profile |
SEC
News |
Chart |
Request a new note
C
A
S
I |
HQY
-
NASDAQ
Healthequity Inc
COMPUTER SOFTWARE and SERVICES - Healthcare Information Service
|
$86.92
|
-0.60
-0.69% |
$88.94
|
534,759
67.27% of 50 DAV
50 DAV is 795,000
|
$99.99
-13.07%
|
8/13/2018
|
$82.39
|
PP = $83.44
|
|
MB = $87.61
|
Most Recent Note - 10/16/2018 4:09:40 PM
G - Posted a big gain today rebounding toward its 50 DMA line ($89.95) which may act as resistance. Found support near prior highs in the $82-83 area, but more damaging losses would raise serious concerns.
>>> FEATURED STOCK ARTICLE : Below 50-Day Moving Average Which May Act as Resistance - 10/16/2018 |
View all notes |
Set NEW NOTE alert |
Company Profile |
SEC
News |
Chart |
Request a new note
C
A
S
I |
OLLI
-
NASDAQ
Ollie's Bargain Outlet
Retail-DiscountandVariety
|
$88.74
|
-0.81
-0.90% |
$90.27
|
436,679
67.18% of 50 DAV
50 DAV is 650,000
|
$97.61
-9.09%
|
7/12/2018
|
$74.43
|
PP = $77.60
|
|
MB = $81.48
|
Most Recent Note - 10/19/2018 6:35:06 PM
G - The 50 DMA line ($87) and recent low ($84.66 on 10/11/18) define near-term support well above prior highs in the $77 area. Fundamentals remain strong.
>>> FEATURED STOCK ARTICLE : Encountered Distributional Pressure After a Great Rally - 10/9/2018 |
View all notes |
Set NEW NOTE alert |
Company Profile |
SEC
News |
Chart |
Request a new note
C
A
S
I |
Symbol/Exchange
Company Name
Industry Group |
PRICE |
CHANGE
(%Change) |
Day High |
Volume
(% DAV)
(% 50 day avg vol) |
52 Wk Hi
% From Hi |
Featured
Date |
Price
Featured |
Pivot Featured |
|
Max Buy |
|
|
|
THESE ARE NOT BUY RECOMMENDATIONS!
Comments contained in the body of this report are technical
opinions only. The material herein has been obtained
from sources believed to be reliable and accurate, however,
its accuracy and completeness cannot be guaranteed.
This site is not an investment advisor, hence it does
not endorse or recommend any securities or other investments.
Any recommendation contained in this report may not
be suitable for all investors and it is not to be deemed
an offer or solicitation on our part with respect to
the purchase or sale of any securities. All trademarks,
service marks and trade names appearing in this report
are the property of their respective owners, and are
likewise used for identification purposes only.
This report is a service available
only to active Paid Premium Members.
You may opt-out of receiving report notifications
at any time. Questions or comments may be submitted
by writing to Premium Membership Services 665 S.E. 10 Street, Suite 201 Deerfield Beach, FL 33441-5634 or by calling 1-800-965-8307
or 954-785-1121.
|
|
|