You are not logged in.
This means you
CAN ONLY VIEW reports that were published prior to Monday, February 19, 2024.
You
MUST UPGRADE YOUR MEMBERSHIP if you want to see any current reports.
AFTER MARKET UPDATE - THURSDAY, OCTOBER 17TH, 2019
Previous After Market Report Next After Market Report >>>
|
|
|
|
DOW |
+23.90 |
27,025.88 |
+0.09% |
|
Volume |
729,487,980 |
-3% |
|
Volume |
1,843,107,961 |
-2% |
|
NASDAQ |
+33.20 |
8,157.38 |
+0.41% |
|
Advancers |
1,875 |
66% |
|
Advancers |
1,988 |
65% |
|
S&P 500 |
+8.26 |
2,997.95 |
+0.28% |
|
Decliners |
973 |
34% |
|
Decliners |
1,085 |
35% |
|
Russell 2000 |
+16.79 |
1,541.84 |
+1.10% |
|
52 Wk Highs |
155 |
|
|
52 Wk Highs |
78 |
|
|
S&P 600 |
+10.36 |
955.41 |
+1.10% |
|
52 Wk Lows |
33 |
|
|
52 Wk Lows |
64 |
|
|
 |
Breadth Positive as Leadership Improves
Kenneth J. Gruneisen - Passed the CAN SLIM® Master's Exam
The Dow gained 23 points, while the S&P 500 added 0.3%. The Nasdaq Composite advanced 0.4%. Volume totals reported were lighter than the prior session totals on the Nasdaq exchange and on the NYSE. Breadth was positive as advancers led decliners by nearly 2-1 on the NYSE and on the Nasdaq exchange. Leadership improved slightly as there were 45 high-ranked companies from the Leaders List that hit a new 52-week high and were listed on the BreakOuts Page, versus the total of 34 on the prior session. New 52-week highs outnumbered new 52-week lows on the NYSE, and on the Nasdaq exchange. The major indices (M criteria) are in a "confirmed uptrend" after enduring distributional pressure in recent weeks. The Featured Stocks Page provides the most timely analysis on high-ranked leaders. Charts used courtesy of www.stockcharts.com
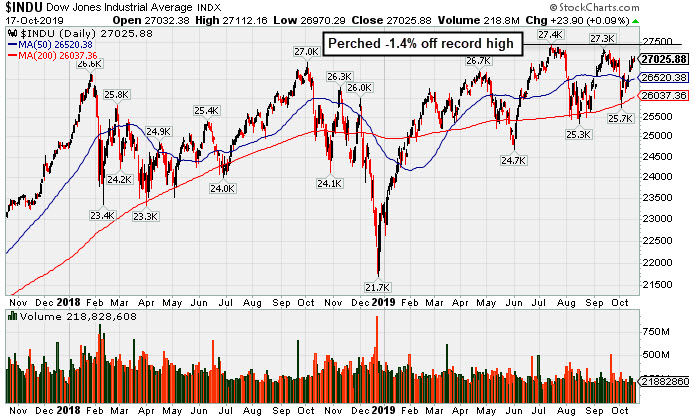
PICTURED: The Dow Jones Industrial Average is above its 50-day moving average (DMA) line and perched only -1.4% off its record high. Its 200 DMA line and prior lows define important near-term support.
Stocks finished higher Thursday amid positive Brexit developments and strong earnings reports. News that the European Union and the U.K. reached a preliminary deal buoyed equity markets around the globe. Gains were capped attributed to growing concern that the compromise may not win parliamentary approval.
Ten of 11 S&P 500 sectors ended the session in positive territory with Technology the lone group to close in negative territory. Earnings season is off to a strong start as more than 75% of companies that have reported topped analyst expectations, according to FactSet data. Morgan Stanley (MS +1.54%) rose after easily beating consensus earnings and revenue estimates. Netflix (NFLX +2.47%) rose as its quarterly results topped estimates and reported stronger-than-expected subscriber growth overseas. Railroad transportation company CSX Corp. (CSX +1.13%) rose after releasing better-than-anticipated profits. Shares of International Business Machines (IBM -5.52%) missed out on the broad advance, falling after missing revenue estimates and reporting its fifth consecutive quarter of declining sales.
On the data front, initial jobless claims rose to 214,000 in the latest week after unexpectedly falling to 210,000 in the prior period. Separately, industrial production dipped 0.4%, more than the anticipated 0.2% decline and well below the upwardly revised 0.8% August figure. Another report showed housing starts slumped 9.4% in September after reaching a 12-year high in August. Treasuries weakened, with the yield on the benchmark 10-year note rising two basis points to 1.76%. In commodities, WTI crude rallied 1.3% to $54.04/barrel. COMEX gold ticked up 0.3% to $1,492.30/ounce.
|
 Kenneth J. Gruneisen started out as a licensed stockbroker in August 1987, a couple of months prior to the historic stock market crash that took the Dow Jones Industrial Average down -22.6% in a single day. He has published daily fact-based fundamental and technical analysis on high-ranked stocks online for two decades. Through FACTBASEDINVESTING.COM, Kenneth provides educational articles, news, market commentary, and other information regarding proven investment systems that work in good times and bad.
Comments contained in the body of this report are technical opinions only and are not necessarily those of Gruneisen Growth Corp. The material herein has been obtained from sources believed to be reliable and accurate, however, its accuracy and completeness cannot be guaranteed. Our firm, employees, and customers may effect transactions, including transactions contrary to any recommendation herein, or have positions in the securities mentioned herein or options with respect thereto. Any recommendation contained in this report may not be suitable for all investors and it is not to be deemed an offer or solicitation on our part with respect to the purchase or sale of any securities. |
|
 |
Gold & Silver, Retail, Broker/Dealer, and Tech Indicies Rose
Kenneth J. Gruneisen - Passed the CAN SLIM® Master's Exam
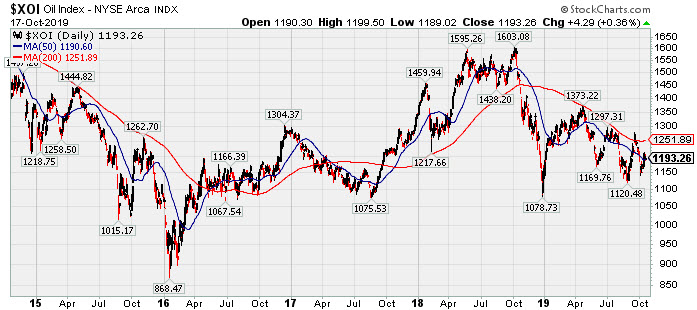
The Retail Index ($RLX +0.54%) and the Broker/Dealer Index ($XBD +0.54%) both posted modest gains while the Bank Index ($BKX -0.12%) inched lower on the session. The tech sector had a positive bias as the Semiconductor Index ($SOX +0.34%), Biotech Index ($BTK +0.31%) and the Networking Index ($NWX +1.01%) posted unanimous gains. The Oil Services Index ($OSX -0.94%) lost ground while the Integrated Oil Index ($XOI +0.36%) inched higher, meanwhile, the Gold & Silver Index ($XAU +2.00%) again was a standout gainer.
PICTURED: The 5-year graph of the Integrated Oil Index ($XOI +0.36%) shows it sputtering above multi-year lows.
| Oil Services |
$OSX |
64.00 |
-0.60 |
-0.93% |
-20.60% |
| Integrated Oil |
$XOI |
1,193.26 |
+4.29 |
+0.36% |
+2.95% |
| Semiconductor |
$SOX |
1,607.16 |
+5.37 |
+0.34% |
+39.13% |
| Networking |
$NWX |
557.04 |
+5.59 |
+1.01% |
+13.99% |
| Broker/Dealer |
$XBD |
256.59 |
+1.38 |
+0.54% |
+8.11% |
| Retail |
$RLX |
2,415.15 |
+12.96 |
+0.54% |
+23.76% |
| Gold & Silver |
$XAU |
90.02 |
+1.76 |
+1.99% |
+27.40% |
| Bank |
$BKX |
100.09 |
-0.12 |
-0.12% |
+16.67% |
| Biotech |
$BTK |
4,299.40 |
+13.40 |
+0.31% |
+1.86% |
|
|
|
 |
Recently Met Stubborn Resistance Near Prior Highs
Kenneth J. Gruneisen - Passed the CAN SLIM® Master's Exam
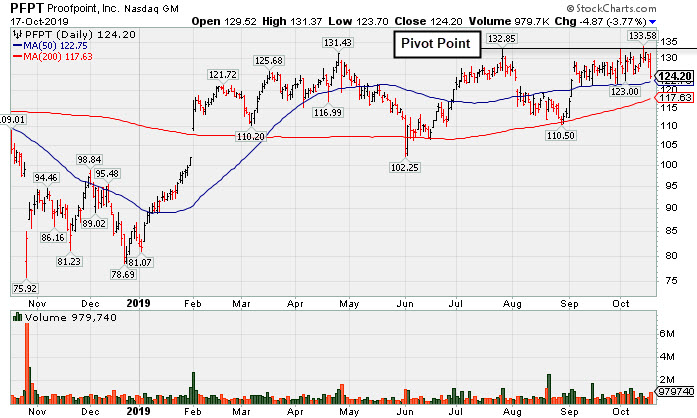
Proofpoint Inc (PFPT -$5.18 or -4.01% to $123.89) pulled back from its all-time high with a big loss today on above average volume. It has met stubborn resistance in the $132 area in recent months. Its 50-day moving average (DMA) line ($122.75 defines near-term support. Subsequent gains above the pivot point backed by at least +40% above average volume may trigger a technical buy signal.
PFPT was highlighted in yellow with pivot point cited based on its 7/26/19 high in the 10/01/19 mid-day report (read here). The Computer Software-Security firm has met stubborn resistance in the $132 area in recent months. Subsequent gains above the pivot point backed by at least +40% above average volume may trigger a technical buy signal. yellow with pivot point cited based on its 7/26/19 high. It was last shown in this FSU section on 10/01/19 with an annotated graph under the headline, "Challenging Previously Stubborn Resistance".
Keep in mind it is due to report earnings news on 10/24/19 for the Sep '19 quarter. Volume and volatility often increase near earnings news. It has an Earnings Per Share Rating of 97. Prior mid-day reports noted - "Three of the past 4 quarterly comparisons through Jun '19 were above the +25% minimum earnings guideline (C criteria). Annual earnings (A criteria) history has been strong since turning profitable in FY '16 ".
The number of top-rated funds owning its shares rose from 517 in Dec '18 to 590 in Sep '19, a reassuring sign concerning the I criteria. Its current Up/Down Volume ration of 1.3 is an unbiased indication its shares have been under accumulation over the past 50 days. Its small supply of 56.1 million shares outstanding (S criteria) can contribute to greater price volatility in the event of institutional buying or selling.
|
|
|
Color Codes Explained :
Y - Better candidates highlighted by our
staff of experts.
G - Previously featured
in past reports as yellow but may no longer be buyable under the
guidelines.
***Last / Change / Volume data in this table is the closing quote data***
Symbol/Exchange
Company Name
Industry Group |
PRICE |
CHANGE
(%Change) |
Day High |
Volume
(% DAV)
(% 50 day avg vol) |
52 Wk Hi
% From Hi |
Featured
Date |
Price
Featured |
Pivot Featured |
|
Max Buy |
 MLR
-
NYSE
MLR
-
NYSE
Miller Industries Inc
AUTOMOTIVE - Auto Parts
|
$32.52
|
+0.57
1.78% |
$32.74
|
30,245
93.35% of 50 DAV
50 DAV is 32,400
|
$35.26
-7.77%
|
9/24/2019
|
$34.00
|
PP = $35.36
|
|
MB = $37.13
|
Most Recent Note - 10/15/2019 1:45:03 PM
G - Halted its slide recently at its 200 DMA line, and a rebound above its 50 DMA line ($32.36) may help its outlook to improve. Subsequent gains above the pivot point backed by at least +40% above average volume may trigger a technical buy signal. Fundamentals remain strong.
>>> FEATURED STOCK ARTICLE : Tested Support at Long-Term 200-Day Moving Average - 10/9/2019 |
View all notes |
Set NEW NOTE alert |
Company Profile |
SEC
News |
Chart |
Request a new note
C
A
S
I |
CCBG
-
NASDAQ
Capital City Bk Gp
BANKING - Regional - Mid-Atlantic Banks
|
$26.86
|
+0.04
0.15% |
$27.05
|
18,114
67.09% of 50 DAV
50 DAV is 27,000
|
$28.00
-4.07%
|
9/13/2019
|
$27.03
|
PP = $27.05
|
|
MB = $28.40
|
 Most Recent Note - 10/17/2019 4:14:59 PM
Y - Still hovering near its 52-week high. Prior highs define initial support to watch above its 50 DMA line ($25.74). Due to report earnings news on 10/21/19.
>>> FEATURED STOCK ARTICLE : Perched Near High With Earnings News Due Next Week - 10/14/2019 |
View all notes |
Set NEW NOTE alert |
Company Profile |
SEC
News |
Chart |
Request a new note
C
A
S
I |
EPAM
-
NYSE
Epam Systems Inc
COMPUTER SOFTWARE and SERVICES - Information Technology Service
|
$189.20
|
+0.75
0.40% |
$190.15
|
164,654
49.59% of 50 DAV
50 DAV is 332,000
|
$201.00
-5.87%
|
5/9/2019
|
$169.25
|
PP = $180.55
|
|
MB = $189.58
|
Most Recent Note - 10/16/2019 5:48:51 PM
G - Consolidating above its 50 DMA line. Faces little resistance due to overhead supply up to the $201 level. Prior lows in the $174-175 area define the next important support level. Reported earnings +27% on +24% sales revenues for the Jun '19 quarter. See the latest FSU analysis for more details and a new annotated graph.
>>> FEATURED STOCK ARTICLE : Faces Some Resistance Due to Overhead Supply - 10/16/2019 |
View all notes |
Set NEW NOTE alert |
Company Profile |
SEC
News |
Chart |
Request a new note
C
A
S
I |
AUDC
-
NASDAQ
Audiocodes Ltd
ELECTRONICS - Scientific and Technical Instrum
|
$18.57
|
+0.39
2.15% |
$19.07
|
159,365
80.90% of 50 DAV
50 DAV is 197,000
|
$22.50
-17.47%
|
9/13/2019
|
$19.68
|
PP = $19.84
|
|
MB = $20.83
|
Most Recent Note - 10/15/2019 1:18:50 PM
G - A rebound above its 50 DMA line ($18.43) is needed for its outlook to improve. That short-term average may act as resistance. Prior lows in the $16.50 area define the next important support.
>>> FEATURED STOCK ARTICLE : Sank Below 50-Day Average as 7 Straight Losses Follow Reversal - 10/2/2019 |
View all notes |
Set NEW NOTE alert |
Company Profile |
SEC
News |
Chart |
Request a new note
C
A
S
I |
CHDN
-
NASDAQ
Churchill Downs Inc
LEISURE - Gaming Activities
|
$129.65
|
-0.38
-0.29% |
$131.54
|
231,655
102.50% of 50 DAV
50 DAV is 226,000
|
$132.73
-2.32%
|
10/8/2019
|
$129.77
|
PP = $132.83
|
|
MB = $139.47
|
Most Recent Note - 10/15/2019 12:38:09 PM
Y - Stubbornly holding its ground near its all-time high following volume-driven gains last week. Subsequent gains above the pivot point backed by at least +40% above average volume may trigger a new (or add-on) technical buy signal. Its 50 DMA line ($123.42) acted as support in recent weeks during its consolidation. Jun '19 earnings +10% on +26% sales revenues versus the year ago period were below the +25% minimum earnings guideline (C criteria), noted recently raising fundamental concerns.
>>> FEATURED STOCK ARTICLE : Volume-Driven Gain for Record High Close - 10/8/2019 |
View all notes |
Set NEW NOTE alert |
Company Profile |
SEC
News |
Chart |
Request a new note
C
A
S
I |
Symbol/Exchange
Company Name
Industry Group |
PRICE |
CHANGE
(%Change) |
Day High |
Volume
(% DAV)
(% 50 day avg vol) |
52 Wk Hi
% From Hi |
Featured
Date |
Price
Featured |
Pivot Featured |
|
Max Buy |
LULU
-
NASDAQ
Lululemon Athletica
MANUFACTURING - Textile Manufacturing
|
$204.96
|
+1.88
0.93% |
$205.65
|
1,308,220
71.72% of 50 DAV
50 DAV is 1,824,000
|
$205.40
-0.21%
|
9/6/2019
|
$201.25
|
PP = $194.35
|
|
MB = $204.07
|
Most Recent Note - 10/15/2019 1:40:44 PM
Y - Quietly touching new all-time highs this week and trading near its "max buy" level. Its 50 DMA line ($188.75) and recent low ($185.36 on 10/03/19) define important near-term support where more damaging losses would raise serious concerns and trigger technical sell signals.
>>> FEATURED STOCK ARTICLE : Found Support After Undercutting 50-Day Moving Average - 10/3/2019 |
View all notes |
Set NEW NOTE alert |
Company Profile |
SEC
News |
Chart |
Request a new note
C
A
S
I |
CPRT
-
NASDAQ
Copart Inc
SPECIALTY RETAIL - Auto Dealerships
|
$81.02
|
-0.36
-0.44% |
$82.03
|
1,061,737
75.35% of 50 DAV
50 DAV is 1,409,000
|
$83.70
-3.20%
|
9/5/2019
|
$79.13
|
PP = $79.84
|
|
MB = $83.83
|
Most Recent Note - 10/17/2019 4:17:13 PM
Y - Its 50 DMA line ($78.86) defines near-term support above the prior low ($76.35 on 10/03/19). Consolidating above its pivot point and below its "max buy" level.
>>> FEATURED STOCK ARTICLE : Found Prompt Support Near 50-Day Moving Average - 10/4/2019 |
View all notes |
Set NEW NOTE alert |
Company Profile |
SEC
News |
Chart |
Request a new note
C
A
S
I |
PFPT
-
NASDAQ
Proofpoint Inc
Computer Sftwr-Security
|
$124.20
|
-4.87
-3.77% |
$131.37
|
972,706
135.10% of 50 DAV
50 DAV is 720,000
|
$133.58
-7.02%
|
10/1/2019
|
$129.59
|
PP = $132.95
|
|
MB = $139.60
|
Most Recent Note - 10/17/2019 4:50:54 PM
Y - Pulled back with higher volume today while retreating from its all-time high. Met stubborn resistance in the $132 area in recent months. Its 50 DMA line ($122.75) defines near-term support. Subsequent gains above the pivot point backed by at least +40% above average volume may trigger a technical buy signal. See the latest FSU analysis for more details and a new annotated graph.
>>> FEATURED STOCK ARTICLE : Recently Met Stubborn Resistance Near Prior Highs - 10/17/2019 |
View all notes |
Set NEW NOTE alert |
Company Profile |
SEC
News |
Chart |
Request a new note
C
A
S
I |
BLD
-
NYSE
Topbuild Corp
Bldg-Constr Prds/Misc
|
$101.94
|
+1.59
1.58% |
$102.72
|
301,490
122.56% of 50 DAV
50 DAV is 246,000
|
$100.81
1.12%
|
5/17/2019
|
$82.19
|
PP = $87.31
|
|
MB = $91.68
|
Most Recent Note - 10/17/2019 4:14:20 PM
G - Wedged into all-time high territory with today's 5th consecutive gain lacking great volume conviction. Earnings rose +39% on +9% sales revenues for the Jun '19 quarter versus the year ago period. Its 50 DMA line ($93.61) defines important support to watch along with its prior low ($91.31 on 10/03/19).
>>> FEATURED STOCK ARTICLE : Near High After Finding Support at 50-Day Average - 10/7/2019 |
View all notes |
Set NEW NOTE alert |
Company Profile |
SEC
News |
Chart |
Request a new note
C
A
S
I |
PAGS
-
NYSE
Pagseguro Digital Cl A
Finance-CrdtCard/PmtPr
|
$40.41
|
+0.88
2.23% |
$40.98
|
8,842,789
448.19% of 50 DAV
50 DAV is 1,973,000
|
$53.43
-24.37%
|
6/25/2019
|
$37.69
|
PP = $40.07
|
|
MB = $42.07
|
Most Recent Note - 10/15/2019 1:16:26 PM
G - Gapped down today violating prior lows in the $42-43 area triggering a worrisome technical sell signal. A rebound above the 50 DMA line ($47.29) still is needed for its outlook to improve.
>>> FEATURED STOCK ARTICLE : Rebound Above 50-Day Average Needed for Outlook to Improve - 10/10/2019 |
View all notes |
Set NEW NOTE alert |
Company Profile |
SEC
News |
Chart |
Request a new note
C
A
S
I |
Symbol/Exchange
Company Name
Industry Group |
PRICE |
CHANGE
(%Change) |
Day High |
Volume
(% DAV)
(% 50 day avg vol) |
52 Wk Hi
% From Hi |
Featured
Date |
Price
Featured |
Pivot Featured |
|
Max Buy |
|
|
|
THESE ARE NOT BUY RECOMMENDATIONS!
Comments contained in the body of this report are technical
opinions only. The material herein has been obtained
from sources believed to be reliable and accurate, however,
its accuracy and completeness cannot be guaranteed.
This site is not an investment advisor, hence it does
not endorse or recommend any securities or other investments.
Any recommendation contained in this report may not
be suitable for all investors and it is not to be deemed
an offer or solicitation on our part with respect to
the purchase or sale of any securities. All trademarks,
service marks and trade names appearing in this report
are the property of their respective owners, and are
likewise used for identification purposes only.
This report is a service available
only to active Paid Premium Members.
You may opt-out of receiving report notifications
at any time. Questions or comments may be submitted
by writing to Premium Membership Services 665 S.E. 10 Street, Suite 201 Deerfield Beach, FL 33441-5634 or by calling 1-800-965-8307
or 954-785-1121.
|
|
|