You are not logged in.
This means you
CAN ONLY VIEW reports that were published prior to Monday, February 19, 2024.
You
MUST UPGRADE YOUR MEMBERSHIP if you want to see any current reports.
AFTER MARKET UPDATE - WEDNESDAY, OCTOBER 17TH, 2018
Previous After Market Report Next After Market Report >>>
|
|
|
|
DOW |
-91.74 |
25,706.68 |
-0.36% |
|
Volume |
793,822,220 |
+1% |
|
Volume |
2,357,992,970 |
-9% |
|
NASDAQ |
-2.79 |
7,642.70 |
-0.04% |
|
Advancers |
1,106 |
37% |
|
Advancers |
1,260 |
42% |
|
S&P 500 |
-0.71 |
2,809.21 |
-0.03% |
|
Decliners |
1,857 |
63% |
|
Decliners |
1,749 |
58% |
|
Russell 2000 |
-7.23 |
1,589.60 |
-0.45% |
|
52 Wk Highs |
15 |
|
|
52 Wk Highs |
15 |
|
|
S&P 600 |
-5.92 |
990.87 |
-0.59% |
|
52 Wk Lows |
129 |
|
|
52 Wk Lows |
94 |
|
|
 |
Leadership Remains Elusive as Major Indices Sputter
Kenneth J. Gruneisen - Passed the CAN SLIM® Master's Exam
Stocks ended lower Wednesday. The Dow lost 91 points to 25706 while the S&P 500 fell less than a point to 2809. The Nasdaq Composite slipped 2 points to 7642. Volume totals reported were mixed, slightly higher on the NYSE but lower on the Nasdaq exchange versus the prior session. Breadth was negative as decliners led advancers by almost a 3-2 margin on the NYSE and on the Nasdaq exchange. There were 5 high-ranked companies from the Leaders List that made new 52-week highs and were listed on the BreakOuts Page , matching the prior session, as market leadership remained very elusive. New 52-week lows totals again easily outnumbered the short lists of new 52-week highs on the NYSE and Nasdaq exchange. Recent reports have noted that the major indices (M criteria) have shown action indicative of a market correction while leadership disappeared. During market corrections investors should have a bias toward selling stocks on a case-by-case basis as technical sell signals occur, raising cash levels while reducing market exposure. The Featured Stocks Page provides the most timely analysis on high-ranked leaders. Charts used courtesy of www.stockcharts.com
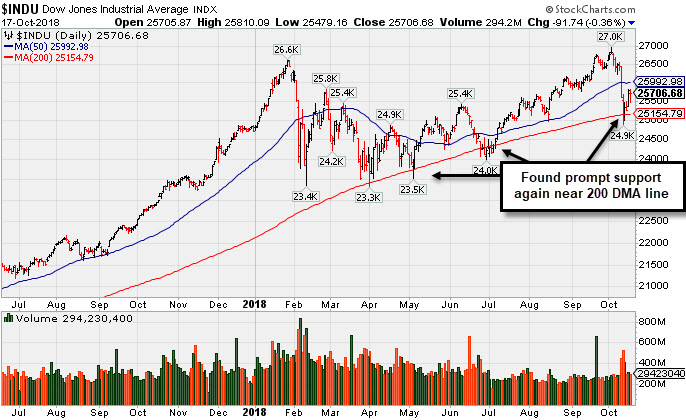
PICTURED: The Dow Jones Industrial Average found prompt support again near its 200-day moving average (DMA) line, as the chart illustrates. Technically, however, the market still is in a "correction" under the fact-based investment system. It ended lower on Wednesday, noted as Day 4 of the nascent rally attempt. Investors should watch for a subsequent gain or "follow-through day" to be noted. most ideally between Day 4 and Day 7, with solid gains on higher volume and leadership expansion all necessary elements to confirm a new rally. New buying efforts are against the rules and discouraged until a convincing follow-through day occurs.
The major averages declined as investors assessed the latest economic updates and corporate earnings results. Today’s modest pullback followed Tuesday’s advance, where all three major U.S. averages notched their best trading session since March. On the data front, a report showed housing starts fell 5.3% in September as Hurricane Florence led to a slowdown in activity. In a separate release, weekly mortgage applications fell 7.1%, the lowest level since December 2014.
Seven of 11 S&P 500 sectors finished in negative territory. Energy stocks underperformed as WTI crude lost 2.6% to $70.05/barrel, touching its lowest price in a month after a government update revealed a larger than expected build in U.S. inventories. Tech shares also lagged with IBM (IBM -7.63%) gapping down after posting a decline in quarterly revenue. The Communication Services sector outperformed as shares of Netflix (NFLX +5.28%) rose after the media giant topped both domestic and international new subscriber estimates.
Treasuries weakened along the curve following the release of the Federal Reserve minutes from its latest policy meeting. The statement reiterated the FOMC’s optimistic view of the U.S. economy. The yield on the 10-year note gained three basis points to 3.19%. COMEX gold lost 0.3% to $1,223.70/ounce amid a stronger dollar. |
 Kenneth J. Gruneisen started out as a licensed stockbroker in August 1987, a couple of months prior to the historic stock market crash that took the Dow Jones Industrial Average down -22.6% in a single day. He has published daily fact-based fundamental and technical analysis on high-ranked stocks online for two decades. Through FACTBASEDINVESTING.COM, Kenneth provides educational articles, news, market commentary, and other information regarding proven investment systems that work in good times and bad.
Comments contained in the body of this report are technical opinions only and are not necessarily those of Gruneisen Growth Corp. The material herein has been obtained from sources believed to be reliable and accurate, however, its accuracy and completeness cannot be guaranteed. Our firm, employees, and customers may effect transactions, including transactions contrary to any recommendation herein, or have positions in the securities mentioned herein or options with respect thereto. Any recommendation contained in this report may not be suitable for all investors and it is not to be deemed an offer or solicitation on our part with respect to the purchase or sale of any securities. |
|
 |
Financials and Networking Index Rose
Kenneth J. Gruneisen - Passed the CAN SLIM® Master's Exam
The Retail Index ($RLX -1.01%) fell while the Bank Index ($BKX +0.86%) and Broker/Dealer Index ($XBD +0.77%) both posted gains on Wednesday. The tech sector was mixed as the Biotech Index ($BTK -0.16%) and the Semiconductor Index ($SOX -0.44%) both edged lower while the Networking Index ($NWX +0.34%) posted a modest gain. The Integrated Oil Index ($XOI -1.10%) and the Oil Services Index ($OSX -1.38%) both outpaced the Gold & Silver Index ($XAU -0.35%) to the downside.
Charts courtesy of www.stockcharts.com
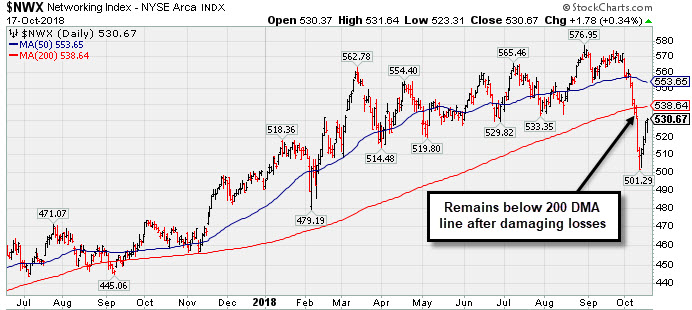 PICTURED: The Networking Index ($NWX +0.34%) recently has slumped well below its 200-day moving average line (red line) and bounced, but it remains below that important long-term average. When any index is below its 200 DMA line it is obviously not in healthy technical shape, and that weakness bodes poorly for most individual stocks within the group.
| Oil Services |
$OSX |
143.72 |
-2.01 |
-1.38% |
-3.90% |
| Integrated Oil |
$XOI |
1,479.36 |
-16.39 |
-1.10% |
+10.77% |
| Semiconductor |
$SOX |
1,277.31 |
-5.64 |
-0.44% |
+1.94% |
| Networking |
$NWX |
530.67 |
+1.78 |
+0.34% |
+8.18% |
| Broker/Dealer |
$XBD |
267.42 |
+2.04 |
+0.77% |
+0.82% |
| Retail |
$RLX |
2,252.73 |
-22.93 |
-1.01% |
+29.93% |
| Gold & Silver |
$XAU |
69.86 |
-0.24 |
-0.34% |
-18.07% |
| Bank |
$BKX |
101.74 |
+0.86 |
+0.85% |
-4.66% |
| Biotech |
$BTK |
5,061.84 |
-8.08 |
-0.16% |
+19.89% |
|
|
|
 |
Rebounding Toward 50-Day Moving Average
Kenneth J. Gruneisen - Passed the CAN SLIM® Master's Exam
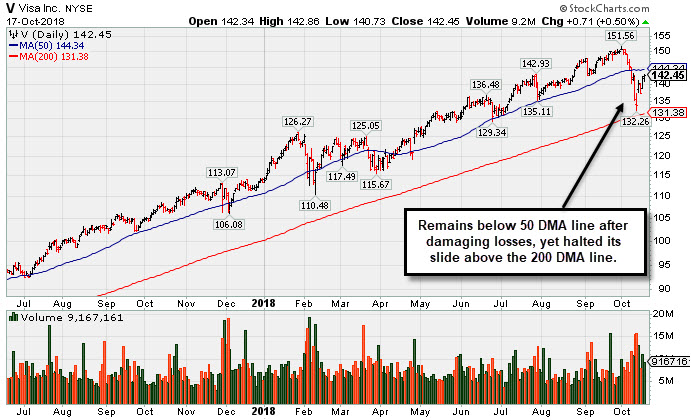
Visa Inc (V +$0.71 or +0.50% to $142.45) has been rebounding after slumping near its 200-day moving average (DMA) line ($131) following noted technical sell signals. A rebound above the 50 DMA line ($144) is needed for its outlook to improve, however, that short-term average may now act as resistance. Fundamentals remain strong. It reported earnings +40% on +15% sales revenues for the Jun '18 quarter. The past 3 quarterly comparisons were above the +25% minimum earnings guideline (C criteria). Its strong and steady annual earnings history satisfies the A criteria. Visa was last shown in this FSU section on 9/13/18 with an annotated graph under the headline, "Visa Near Record but Endured Distributional Pressure". It traded up as much as +19.6% after it was highlighted in yellow at $126.68 with pivot point cited based on its 1/29/18 high plus 10 cents in the 4/26/18 mid-day report (read here). The number of top-rated funds owning its shares rose from 3,624 in Jun '17 to 4,195 in Sep '18, a reassuring sign concerning the I criteria, however it is already well known by the institutional crowd.There are also 2.03 billion shares outstanding (S criteria), which can make it a less likely sprinter. Leadership shown by other firms in the Finance - Credit Card Payment Processing group (L criteria) has been a reassuring sign. Charts courtesy wwwstockcharts.com
 |
|
|
Color Codes Explained :
Y - Better candidates highlighted by our
staff of experts.
G - Previously featured
in past reports as yellow but may no longer be buyable under the
guidelines.
***Last / Change / Volume data in this table is the closing quote data***
Symbol/Exchange
Company Name
Industry Group |
PRICE |
CHANGE
(%Change) |
Day High |
Volume
(% DAV)
(% 50 day avg vol) |
52 Wk Hi
% From Hi |
Featured
Date |
Price
Featured |
Pivot Featured |
|
Max Buy |
SIVB
-
NASDAQ
S V B Financial Group
BANKING - Regional - Pacific Banks
|
$296.98
|
+2.43
0.82% |
$298.42
|
373,014
92.10% of 50 DAV
50 DAV is 405,000
|
$333.74
-11.01%
|
8/6/2018
|
$314.77
|
PP = $329.75
|
|
MB = $346.24
|
Most Recent Note - 10/12/2018 12:58:41 PM
G - Slumped below its 200 DMA ($287) with above average volume behind today's 7th consecutive loss raising greater concerns while also undercutting its 7/02/18 low ($284.42). A rebound above the 50 DMA line ($319) is needed for its outlook to improve. See the latest FSU analysis for more details and an annotated graph.
>>> FEATURED STOCK ARTICLE : Weak Action Amid Broader Market Declines - 10/11/2018 |
View all notes |
Set NEW NOTE alert |
Company Profile |
SEC
News |
Chart |
Request a new note
C
A
S
I |
GMED
-
NYSE
Globus Medical Inc Cl A
CHEMICALS - Specialty Chemicals
|
$55.24
|
+0.96
1.77% |
$55.33
|
694,765
115.41% of 50 DAV
50 DAV is 602,000
|
$57.55
-4.01%
|
9/26/2018
|
$56.11
|
PP = $57.65
|
|
MB = $60.53
|
Most Recent Note - 10/16/2018 4:00:53 PM
Y - Halted its slide at its 200 DMA line and today's rebound above the 50 DMA line ($52.76) helped its outlook improve. Color code is changed to yellow. Subsequent gains above the pivot point backed by more than +40% above average volume are needed to trigger a proper technical buy signal.
>>> FEATURED STOCK ARTICLE : Rallying Near Pivot Point With Volume-Driven Gains - 9/26/2018 |
View all notes |
Set NEW NOTE alert |
Company Profile |
SEC
News |
Chart |
Request a new note
C
A
S
I |
ZBRA
-
NASDAQ
Zebra Tech Corp Cl A
COMPUTER HARDWARE - Computer Peripherals
|
$169.06
|
+0.69
0.41% |
$169.34
|
325,576
79.02% of 50 DAV
50 DAV is 412,000
|
$179.47
-5.80%
|
8/7/2018
|
$164.26
|
PP = $161.82
|
|
MB = $169.91
|
Most Recent Note - 10/16/2018 6:12:39 PM
G - Rebounded above the 50 DMA line ($167.93) with above average volume behind today's 4th consecutive gain, helping its outlook to improve. Still faces near-term resistance due to overhead supply up to $179.
>>> FEATURED STOCK ARTICLE : Hovering Near All-Time High With Strong Fundamentals - 9/24/2018 |
View all notes |
Set NEW NOTE alert |
Company Profile |
SEC
News |
Chart |
Request a new note
C
A
S
I |
CME
-
NASDAQ
C M E Group Inc
DIVERSIFIED SERVICES - Business/Management Services
|
$181.32
|
+3.26
1.83% |
$181.60
|
1,712,608
123.39% of 50 DAV
50 DAV is 1,388,000
|
$182.97
-0.90%
|
10/4/2018
|
$179.29
|
PP = $177.45
|
|
MB = $186.32
|
Most Recent Note - 10/15/2018 4:38:07 PM
Y - Pulled back amid broad market weakness (M criteria), undercutting prior highs in the $177 area, raising concerns. The 50 DMA line ($172) defines important near-term support.
>>> FEATURED STOCK ARTICLE : CME Group Blasted to New Record High - 10/4/2018 |
View all notes |
Set NEW NOTE alert |
Company Profile |
SEC
News |
Chart |
Request a new note
C
A
S
I |
FLT
-
NYSE
Fleetcor Technologies
DIVERSIFIED SERVICES - Business/Management Services
|
$212.89
|
-1.00
-0.47% |
$214.40
|
432,993
89.83% of 50 DAV
50 DAV is 482,000
|
$230.24
-7.54%
|
9/12/2018
|
$221.01
|
PP = $226.02
|
|
MB = $237.32
|
Most Recent Note - 10/12/2018 6:01:22 PM
G - Rebounded near its 200 DMA line ($209) with today's volume-driven gain after 6 consecutive losses. A rebound above the 50 DMA line ($217) is needed for its outlook to improve. Subsequent volume-driven gains above the pivot point are needed to trigger a new (or add-on) technical buy signal.
>>> FEATURED STOCK ARTICLE : Perched Within Close Striking Distance of New Pivot Point - 9/20/2018 |
View all notes |
Set NEW NOTE alert |
Company Profile |
SEC
News |
Chart |
Request a new note
C
A
S
I |
Symbol/Exchange
Company Name
Industry Group |
PRICE |
CHANGE
(%Change) |
Day High |
Volume
(% DAV)
(% 50 day avg vol) |
52 Wk Hi
% From Hi |
Featured
Date |
Price
Featured |
Pivot Featured |
|
Max Buy |
MA
-
NYSE
Mastercard Inc Cl A
Finance-CrdtCard/PmtPr
|
$207.38
|
-0.40
-0.19% |
$208.00
|
3,370,709
98.76% of 50 DAV
50 DAV is 3,413,000
|
$225.35
-7.97%
|
7/11/2018
|
$203.84
|
PP = $204.10
|
|
MB = $214.31
|
Most Recent Note - 10/12/2018 12:45:30 PM
G - Bouncing back today after damaging losses. Slumped near its 200 DMA line ($189) after volume-driven losses this week triggered technical sell signals. A rebound above the 50 DMA line ($211) is needed for its outlook to improve.
>>> FEATURED STOCK ARTICLE : Hovering Near High, Extended From Any Sound Base - 9/27/2018 |
View all notes |
Set NEW NOTE alert |
Company Profile |
SEC
News |
Chart |
Request a new note
C
A
S
I |
V
-
NYSE
Visa Inc Cl A
Finance-CrdtCard/PmtPr
|
$142.45
|
+0.71
0.50% |
$142.86
|
9,152,782
117.77% of 50 DAV
50 DAV is 7,772,000
|
$151.56
-6.01%
|
4/26/2018
|
$126.68
|
PP = $126.98
|
|
MB = $133.33
|
 Most Recent Note - 10/17/2018 5:47:18 PM
G - Following noted technical sell signals, a rebound above the 50 DMA line ($144) is needed for its outlook to improve. Found support after slumping near its 200 DMA line ($131) last week. See the latest FSU analysis for more details and a new annotated graph.
>>> FEATURED STOCK ARTICLE : Visa Near Record but Endured Distributional Pressure - 9/13/2018 |
View all notes |
Set NEW NOTE alert |
Company Profile |
SEC
News |
Chart |
Request a new note
C
A
S
I |
TPL
-
NYSE
Texas Pacific Land Trust
Real Estate Dvlpmt/Ops
|
$795.71
|
-3.29
-0.41% |
$808.68
|
10,783
82.95% of 50 DAV
50 DAV is 13,000
|
$877.97
-9.37%
|
9/14/2018
|
$820.45
|
PP = $874.10
|
|
MB = $917.81
|
Most Recent Note - 10/15/2018 4:48:23 PM
G - Slumped further today after losses last week triggered technical sell signals. A rebound above the 50 DMA line ($828) is needed for its outlook to improve. The prior low ($760 on 8/15/18) defines the next important near-term support to watch.
>>> FEATURED STOCK ARTICLE : Slump Below 50-Day Moving Average Hurt Technical Stance - 10/12/2018 |
View all notes |
Set NEW NOTE alert |
Company Profile |
SEC
News |
Chart |
Request a new note
C
A
S
I |
ABMD
-
NASDAQ
Abiomed Inc
HEALTH SERVICES - Medical Instruments and Supplies
|
$389.79
|
+2.91
0.75% |
$391.57
|
355,297
61.47% of 50 DAV
50 DAV is 578,000
|
$459.75
-15.22%
|
9/25/2018
|
$441.96
|
PP = $451.03
|
|
MB = $473.58
|
Most Recent Note - 10/12/2018 5:42:27 PM
G - Posted a gain today with above average volume, breaking a streak of 9 consecutive losses. A prompt rebound above the 50 DMA line ($391) would help its outlook improve.
>>> FEATURED STOCK ARTICLE : Quick Rebound Near Prior High - 9/25/2018 |
View all notes |
Set NEW NOTE alert |
Company Profile |
SEC
News |
Chart |
Request a new note
C
A
S
I |
DPZ
-
NYSE
Dominos Pizza Inc
Retail-Restaurants
|
$267.69
|
+8.06
3.10% |
$268.40
|
953,590
179.58% of 50 DAV
50 DAV is 531,000
|
$305.34
-12.33%
|
8/13/2018
|
$288.60
|
PP = $293.91
|
|
MB = $308.61
|
Most Recent Note - 10/17/2018 12:39:58 PM
G - Managed a "positive reversal" after early lows today nearly tested its 200 DMA line. Gapped down on the prior session for a damaging volume-driven loss. Reported earnings +54% on +22% sales revenues for the Sep '18 quarter, continuing its strong earnings track record. The prior low ($253.63 on 7/31/18) and 200 DMA line ($253) and define important near-term support to watch. See the latest FSU analysis for more details and an annotated graph.
>>> FEATURED STOCK ARTICLE : Sank Below 50 DMA Line Ahead of Earnings News - 10/15/2018 |
View all notes |
Set NEW NOTE alert |
Company Profile |
SEC
News |
Chart |
Request a new note
C
A
S
I |
Symbol/Exchange
Company Name
Industry Group |
PRICE |
CHANGE
(%Change) |
Day High |
Volume
(% DAV)
(% 50 day avg vol) |
52 Wk Hi
% From Hi |
Featured
Date |
Price
Featured |
Pivot Featured |
|
Max Buy |
FIVE
-
NASDAQ
Five Below Inc
Retail-DiscountandVariety
|
$118.06
|
-2.13
-1.77% |
$119.83
|
603,150
63.22% of 50 DAV
50 DAV is 954,000
|
$136.13
-13.27%
|
7/6/2018
|
$98.90
|
PP = $104.09
|
|
MB = $109.29
|
Most Recent Note - 10/16/2018 3:58:40 PM
G - It has not formed a sound base but has rebounded above the 50 DMA line ($118.68) with today's quiet gain helping its outlook to improve. The prior high ($109.09 on 7/19/18) defines the next important support level to watch.
>>> FEATURED STOCK ARTICLE : Retreating After +138% Rally in Under 12 Months - 10/2/2018 |
View all notes |
Set NEW NOTE alert |
Company Profile |
SEC
News |
Chart |
Request a new note
C
A
S
I |
NVEE
-
NASDAQ
N V 5 Global Inc
Comml Svcs-Consulting
|
$84.99
|
+0.20
0.24% |
$85.31
|
72,115
84.84% of 50 DAV
50 DAV is 85,000
|
$92.75
-8.37%
|
6/15/2018
|
$7,070.00
|
PP = $72.00
|
|
MB = $75.60
|
Most Recent Note - 10/15/2018 4:35:29 PM
G - Posted a second consecutive small gain with lighter volume. A rebound above the 50 DMA line ($86.85) still is needed for its outlook to improve.
>>> FEATURED STOCK ARTICLE : Recently Slumped Below 50-Day Moving Average Line - 10/8/2018 |
View all notes |
Set NEW NOTE alert |
Company Profile |
SEC
News |
Chart |
Request a new note
C
A
S
I |
PANW
-
NYSE
Palo Alto Networks
Computer Sftwr-Security
|
$206.05
|
+1.05
0.51% |
$206.65
|
1,258,950
98.20% of 50 DAV
50 DAV is 1,282,000
|
$239.50
-13.97%
|
6/12/2018
|
$206.55
|
PP = $214.69
|
|
MB = $225.42
|
Most Recent Note - 10/16/2018 6:09:57 PM
G - Gapped down and suffered a loss on heavy volume today. A rebound above the 50 DMA line ($221) is needed for its outlook to improve. Its 200 DMA line ($196) defines the next important support level to watch.
>>> FEATURED STOCK ARTICLE : Perched Near All-Time High With Volume Totals Cooling - 9/17/2018 |
View all notes |
Set NEW NOTE alert |
Company Profile |
SEC
News |
Chart |
Request a new note
C
A
S
I |
HQY
-
NASDAQ
Healthequity Inc
COMPUTER SOFTWARE and SERVICES - Healthcare Information Service
|
$86.44
|
-0.01
-0.01% |
$87.95
|
417,210
53.35% of 50 DAV
50 DAV is 782,000
|
$99.99
-13.55%
|
8/13/2018
|
$82.39
|
PP = $83.44
|
|
MB = $87.61
|
Most Recent Note - 10/16/2018 4:09:40 PM
G - Posted a big gain today rebounding toward its 50 DMA line ($89.95) which may act as resistance. Found support near prior highs in the $82-83 area, but more damaging losses would raise serious concerns.
>>> FEATURED STOCK ARTICLE : Below 50-Day Moving Average Which May Act as Resistance - 10/16/2018 |
View all notes |
Set NEW NOTE alert |
Company Profile |
SEC
News |
Chart |
Request a new note
C
A
S
I |
OLLI
-
NASDAQ
Ollie's Bargain Outlet
Retail-DiscountandVariety
|
$91.59
|
-0.44
-0.48% |
$92.45
|
446,254
68.97% of 50 DAV
50 DAV is 647,000
|
$97.61
-6.17%
|
7/12/2018
|
$74.43
|
PP = $77.60
|
|
MB = $81.48
|
Most Recent Note - 10/12/2018 6:07:39 PM
G - Halted its slide at its 50 DMA line ($85.09) with a gain today on average volume after volume-driven losses this week. The 50 DMA line defines near-term support well above prior highs in the $77 area. Fundamentals remain strong.
>>> FEATURED STOCK ARTICLE : Encountered Distributional Pressure After a Great Rally - 10/9/2018 |
View all notes |
Set NEW NOTE alert |
Company Profile |
SEC
News |
Chart |
Request a new note
C
A
S
I |
Symbol/Exchange
Company Name
Industry Group |
PRICE |
CHANGE
(%Change) |
Day High |
Volume
(% DAV)
(% 50 day avg vol) |
52 Wk Hi
% From Hi |
Featured
Date |
Price
Featured |
Pivot Featured |
|
Max Buy |
|
|
|
THESE ARE NOT BUY RECOMMENDATIONS!
Comments contained in the body of this report are technical
opinions only. The material herein has been obtained
from sources believed to be reliable and accurate, however,
its accuracy and completeness cannot be guaranteed.
This site is not an investment advisor, hence it does
not endorse or recommend any securities or other investments.
Any recommendation contained in this report may not
be suitable for all investors and it is not to be deemed
an offer or solicitation on our part with respect to
the purchase or sale of any securities. All trademarks,
service marks and trade names appearing in this report
are the property of their respective owners, and are
likewise used for identification purposes only.
This report is a service available
only to active Paid Premium Members.
You may opt-out of receiving report notifications
at any time. Questions or comments may be submitted
by writing to Premium Membership Services 665 S.E. 10 Street, Suite 201 Deerfield Beach, FL 33441-5634 or by calling 1-800-965-8307
or 954-785-1121.
|
|
|

