You are not logged in.
This means you
CAN ONLY VIEW reports that were published prior to Monday, February 19, 2024.
You
MUST UPGRADE YOUR MEMBERSHIP if you want to see any current reports.
AFTER MARKET UPDATE - WEDNESDAY, OCTOBER 14TH, 2020
Previous After Market Report Next After Market Report >>>
|
|
|
|
DOW |
-165.81 |
28,514.00 |
-0.58% |
|
Volume |
764,083,609 |
+1% |
|
Volume |
3,403,344,100 |
-5% |
|
NASDAQ |
-96.91 |
11,766.99 |
-0.82% |
|
Advancers |
1,165 |
39% |
|
Advancers |
1,138 |
34% |
|
S&P 500 |
-23.26 |
3,488.67 |
-0.66% |
|
Decliners |
1,825 |
61% |
|
Decliners |
2,194 |
66% |
|
Russell 2000 |
-15.20 |
1,621.65 |
-0.93% |
|
52 Wk Highs |
88 |
|
|
52 Wk Highs |
154 |
|
|
S&P 600 |
-4.92 |
917.35 |
-0.53% |
|
52 Wk Lows |
19 |
|
|
52 Wk Lows |
18 |
|
|
The major indices have shown improvement and have resumed a market uptrend as leadership has improved. Disciplined investors carefully may buy leading stocks on a case-by-case basis. Always remain ready to reduce market exposure in the event of any more substantial market downdrafts.
|
 |
Leadership Contracted as Major Indices Lost Ground
Kenneth J. Gruneisen - Passed the CAN SLIM® Master's Exam
The Dow declined 165 points, while the S&P 500 fell 0.7%. The Nasdaq Composite lost 0.8%. The reported volume totals were mixed, higher than the prior session on the NYSE and lighter on the Nasdaq exchange. Breadth was negative as decliners led advancers by a 3-2 margin on the NYSE and nearly 2-1 on the Nasdaq exchange. There were 57 high-ranked companies from the Leaders List that hit new 52-week highs and were listed on the BreakOuts Page, versus the total of 77 on the prior session. New 52-week highs totals contracted yet still easily outnumbered new 52-week lows totals on the NYSE and on the Nasdaq exchange. The major indices are in a confirmed uptrend (M criteria). New buying efforts may be justified in leading stocks on a case-by-case basis. 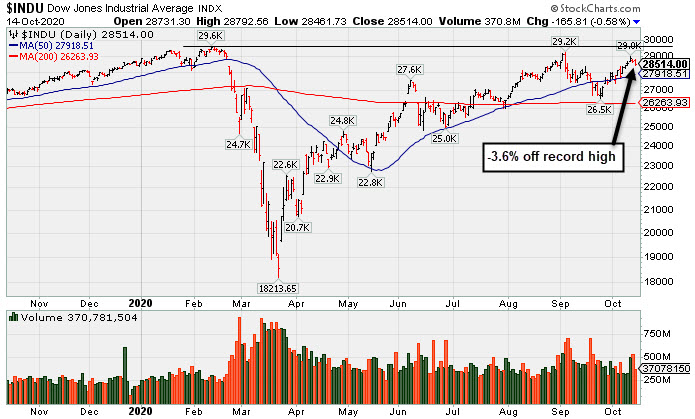 PICTURED: The Dow Jones Industrial Average is -3.6% off its record high.
Stocks finished lower Wednesday, in choppy trading as investors weighed corporate earnings reports and developments on the fiscal stimulus front. Investor sentiment was dampened after Treasury Secretary Steven Mnuchin casted doubt on a fifth coronavirus stimulus deal being coined before the election. This comes after the White House proposed a $1.8 trillion dollar package, however a gap of $400 billion remains between Republicans and Democrats.
Eight of 11 S&P 500 sectors ended the day in negative territory, with the Energy, Materials, and Industrial groups bucking the downtrend. In earnings, shares of Goldman Sachs (GS +0.20%) inched higher after earnings per share hit a record high and beating Wall Street profit and revenue estimates. Bank of America (BAC -5.33%) fell after its revenue fell short of expectations, and earnings declined 16% in the third quarter. In M&A news, Concho Resources (CXO +10.24%) rose after ConocoPhillips (COP -1.0%) said it was in talks to acquire the oil exploration company. In other corporate news, AMC Entertainment (AMC -16.38%) tumbled after disclosing liquidity issues likely to be faced in 2021.
On the data front, an update on inflation showed core producer prices (excluding food and energy) advanced 1.2% year-over-year, doubling the prior month’s 0.6% clip. Treasuries fluctuated, with the yield on the 10-year note ending the day unchanged at 0.72%. In commodities, WTI crude gained 2.0% to $41.02/barrel despite lingering demand worries. Elsewhere, COMEX gold gained 0.7% to $1901.30/ounce amid a weakening dollar. |
 Kenneth J. Gruneisen started out as a licensed stockbroker in August 1987, a couple of months prior to the historic stock market crash that took the Dow Jones Industrial Average down -22.6% in a single day. He has published daily fact-based fundamental and technical analysis on high-ranked stocks online for two decades. Through FACTBASEDINVESTING.COM, Kenneth provides educational articles, news, market commentary, and other information regarding proven investment systems that work in good times and bad.
Comments contained in the body of this report are technical opinions only and are not necessarily those of Gruneisen Growth Corp. The material herein has been obtained from sources believed to be reliable and accurate, however, its accuracy and completeness cannot be guaranteed. Our firm, employees, and customers may effect transactions, including transactions contrary to any recommendation herein, or have positions in the securities mentioned herein or options with respect thereto. Any recommendation contained in this report may not be suitable for all investors and it is not to be deemed an offer or solicitation on our part with respect to the purchase or sale of any securities. |
|
 |
Retail, Financial, and Tech Groups Fell; Commodities Rose
Kenneth J. Gruneisen - Passed the CAN SLIM® Master's Exam
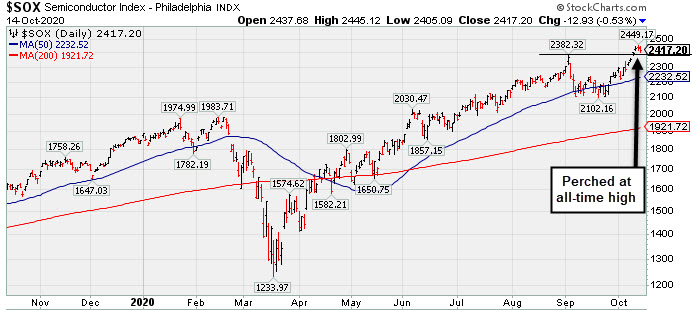
The Retail Index ($RLX -1.76%) lost ground and weakness in the Bank Index ($BKX -1.80%) and Broker/Dealer Index ($XBD -0.26%) also weighed on the major indices. The tech sector saw losses from the Biotech Index ($BTK -1.26%), Semiconductor Index ($SOX -0.53%), and the Networking Index ($NWX -0.13%). Commodity-linked groups rose as the Gold & Silver Index ($XAU +1.33%) and Oil Services Index ($OSX +1.41%) posted solid gains while the Integrated Oil Index ($XOI -0.29%) edged lower. PICTURED: The Semiconductor Index ($SOX -0.53%) is perched at its all-time high.
| Oil Services |
$OSX |
29.13 |
+0.41 |
+1.41% |
-62.79% |
| Integrated Oil |
$XOI |
610.66 |
-1.80 |
-0.29% |
-51.94% |
| Semiconductor |
$SOX |
2,417.20 |
-12.93 |
-0.53% |
+30.69% |
| Networking |
$NWX |
562.54 |
-0.71 |
-0.13% |
-3.58% |
| Broker/Dealer |
$XBD |
297.19 |
-0.78 |
-0.26% |
+2.34% |
| Retail |
$RLX |
3,596.21 |
-64.60 |
-1.76% |
+46.83% |
| Gold & Silver |
$XAU |
150.68 |
+1.97 |
+1.33% |
+40.93% |
| Bank |
$BKX |
76.81 |
-1.41 |
-1.80% |
-32.24% |
| Biotech |
$BTK |
5,547.71 |
-71.06 |
-1.26% |
+9.48% |
|
|
|
 |
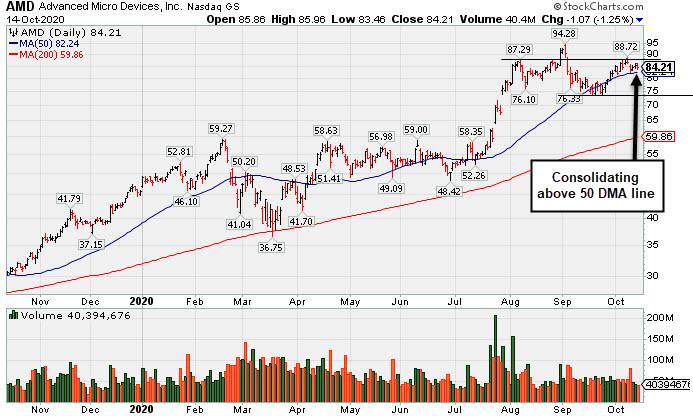
Consolidating Just Above 50-Day Moving Average
Kenneth J. Gruneisen - Passed the CAN SLIM® Master's Exam
Advanced Micro Devices (AMD -$1.07 or -1.25% to $84.21) pulled back today with lighter volume. The company reportedly is considering buying Xilinx Inc (XLNX). Recently it found support near its 50-day moving average (DMA) line ($82.24). Any deterioration below the 50 DMA line and the recent low ($73.85 on 9/18/20) would raise greater concerns and may trigger more worrisome technical sell signals. It has not formed an orderly base and still faces some near-term resistance due to overhead supply up to the $94 level.
Fundamentals remain strong. It reported earnings +125% on +26% sales revenues for the Jun '20 quarter versus the year ago period. The 4 latest quarterly comparisons through Jun '20 showed very strong earnings increases well above the +25% minimum guideline (C criteria) with strong underlying sales revenues growth versus the year ago periods. Annual earnings growth (A criteria) has been very strong after losses in FY '15 and '16. it has a highest possible 99 Earnings Per Share Rating.
AMD traded up more than +70% since highlighted in yellow in the 6/09/20 mid-day report (read here). A new pivot point had been cited in late August after an advanced "3-weeks tight" base pattern, but the rally above it was short lived. It was last shown in this FSU section on 9/28/20 with an annotated graph under the headline, "Rebound Above 50-Day Average With Light Volume Helped Stance".
AMD hails from the Electronics - Semiconductor Fabless industry which has a Group Relative Strength Rating of 85 (L criteria). It has a large supply of 1.17 billion shares outstanding (S criteria), which makes it less likely to be a quick sprinter. However, the number of top-rated funds owning its shares rose from 1,669 in Jun '19 to 2,209 in Jun '20, a reassuring sign concerning the I criteria. Its current Up/Down Volume Ratio of 1.0 is an unbiased indication its shares have been under slight accumulation over the past 50 days. It has a Timeliness Rating of A, a Sponsorship Rating of B, and an Accumulation/Distribution rating of B-.
|
|
|
Color Codes Explained :
Y - Better candidates highlighted by our
staff of experts.
G - Previously featured
in past reports as yellow but may no longer be buyable under the
guidelines.
***Last / Change / Volume data in this table is the closing quote data***
Symbol/Exchange
Company Name
Industry Group |
PRICE |
CHANGE
(%Change) |
Day High |
Volume
(% DAV)
(% 50 day avg vol) |
52 Wk Hi
% From Hi |
Featured
Date |
Price
Featured |
Pivot Featured |
|
Max Buy |
 ADBE
-
NASDAQ
ADBE
-
NASDAQ
Adobe Inc
COMPUTER SOFTWARE and SERVICES - Application Software
|
$506.31
|
-8.00
-1.56% |
$516.95
|
2,032,995
64.60% of 50 DAV
50 DAV is 3,147,000
|
$536.88
-5.69%
|
9/10/2020
|
$488.46
|
PP = $536.88
|
|
MB = $563.72
|
Most Recent Note - 10/12/2020 5:35:42 PM
G - Posted a solid gain today with higher (near average) volume. Subsequent losses below the 50 DMA line ($479.59) would raise great concerns and trigger a technical sell signal. Faces near-term resistance due to overhead supply up to the $536 level. Fundamentals remain strong.
>>> FEATURED STOCK ARTICLE : Showed Resilience Near 50-Day Moving Average - 10/8/2020 |
View all notes |
Set NEW NOTE alert |
Company Profile |
SEC
News |
Chart |
Request a new note
C
A
S
I |
CRL
-
NYSE
Charles River Labs Intl
DRUGS - Biotechnology
|
$244.64
|
-0.34
-0.14% |
$250.29
|
330,914
102.77% of 50 DAV
50 DAV is 322,000
|
$245.93
-0.52%
|
7/15/2020
|
$192.66
|
PP = $189.95
|
|
MB = $199.45
|
Most Recent Note - 10/13/2020 4:35:01 PM
G - Posted a 3rd consecutive gain today with below average volume for a new all-time high. Its 50 DMA line ($220) defines support where any subsequent violation would raise concerns and trigger a technical sell signal. Raised fundamental concerns when it recently reported Jun '20 quarterly earnings -3% on +4% sales revenues, below the +25% minimum guideline (C criteria).
>>> FEATURED STOCK ARTICLE : New Record High for Charles River Labs - 10/9/2020 |
View all notes |
Set NEW NOTE alert |
Company Profile |
SEC
News |
Chart |
Request a new note
C
A
S
I |
AMD
-
NASDAQ
Advanced Micro Devices
ELECTRONICS - Semiconductor - Broad Line
|
$84.21
|
-1.07
-1.25% |
$85.96
|
40,408,136
71.66% of 50 DAV
50 DAV is 56,389,000
|
$94.28
-10.68%
|
8/31/2020
|
$90.42
|
PP = $87.39
|
|
MB = $91.76
|
 Most Recent Note - 10/14/2020 7:27:46 PM
G - Pulled back today with lighter volume. Reportedly is considering buying Xilinx Inc (XLNX). Recently found support near its 50 DMA line ($82.24). Any deterioration below the 50 DMA line and the recent low ($73.85 on 9/18/20) would raise greater concerns and trigger more worrisome technical sell signals. It has not formed a sound base and faces some near-term resistance due to overhead supply up to the $94 level. Fundamentals remain strong. See the latest FSU analysis for more details and a new annotated graph.
>>> FEATURED STOCK ARTICLE : Consolidating Just Above 50-Day Moving Average - 10/14/2020 |
View all notes |
Set NEW NOTE alert |
Company Profile |
SEC
News |
Chart |
Request a new note
C
A
S
I |
TREX
-
NYSE
Trex Company Inc
MATERIALS and CONSTRUCTION - General Building Materials
|
$78.73
|
-1.21
-1.51% |
$81.22
|
554,373
60.52% of 50 DAV
50 DAV is 916,000
|
$81.23
-3.08%
|
6/26/2020
|
$54.53
|
PP = $66.47
|
|
MB = $69.79
|
Most Recent Note - 10/13/2020 4:36:35 PM
G - Posted a 4th consecutive gain today with below average volume while hitting a new all-time high. It did not form a sound base pattern. Any losses below the 50 DMA line ($71.89) or recent low ($63.32 on 9/21/20) would raise concerns and trigger technical sell signals. Do not be confused by the 2:1 share split effective 9/15/20 (Featured Price, Pivot Point, and Max Buy prices have been adjusted accordingly). Fundamentals remain strong.
>>> FEATURED STOCK ARTICLE : TREX Rebounded Above 50-Day Moving Average - 9/30/2020 |
View all notes |
Set NEW NOTE alert |
Company Profile |
SEC
News |
Chart |
Request a new note
C
A
S
I |
NFLX
-
NASDAQ
Netflix Inc
SPECIALTY RETAIL - Music and Video Stores
|
$541.45
|
-12.64
-2.28% |
$572.49
|
9,499,370
169.12% of 50 DAV
50 DAV is 5,617,000
|
$575.37
-5.90%
|
10/14/2020
|
$547.45
|
PP = $557.39
|
|
MB = $585.26
|
Most Recent Note - 10/14/2020 7:35:04 PM
Y - Color code was changed to yellow, however there was a "negative reversal" after gapping up today for early gains challenging its 52-week high and pivot point. New pivot point was cited as it formed a "double bottom" base. A subsequent gain and close above the pivot point backed by at least +40% above average volume may trigger a new (or add-on) technical buy signal. Its 50 DMA line ($503.13) and recent low ($458.60 on 9/18/20) define important near term support where any further deterioration would raise more serious concerns and trigger technical sell signals.
>>> FEATURED STOCK ARTICLE : Quiet Rebound Meeting Resistance at 50-Day Moving Average - 9/29/2020 |
View all notes |
Set NEW NOTE alert |
Company Profile |
SEC
News |
Chart |
Request a new note
C
A
S
I |
Symbol/Exchange
Company Name
Industry Group |
PRICE |
CHANGE
(%Change) |
Day High |
Volume
(% DAV)
(% 50 day avg vol) |
52 Wk Hi
% From Hi |
Featured
Date |
Price
Featured |
Pivot Featured |
|
Max Buy |
LGIH
-
NASDAQ
L G I Homes Inc
Bldg-Resident/Comml
|
$126.54
|
-1.56
-1.22% |
$128.68
|
158,569
56.03% of 50 DAV
50 DAV is 283,000
|
$131.95
-4.10%
|
10/1/2020
|
$123.17
|
PP = $124.04
|
|
MB = $130.24
|
Most Recent Note - 10/14/2020 7:33:17 PM
Y - Volume totals have been cooling while hovering near its all-time high. Color code was recently changed to yellow with new pivot point cited based on its 8/04/20 high plus 10 cents. Subsequent gains above the pivot point backed by at least +40% above average volume are still needed to clinch a proper new (or add-on) technical buy signal. The 50 DMA line ($114.67) and latest low ($101.30 on 9/21/20) define near-term support. Reported Jun '20 quarterly earnings +21% on +4% sales revenues, breaking a streak of 4 comparisons above the +25% minimum guideline (C criteria).
>>> FEATURED STOCK ARTICLE : New Base Formed by Strong Homebuilder - 10/1/2020 |
View all notes |
Set NEW NOTE alert |
Company Profile |
SEC
News |
Chart |
Request a new note
C
A
S
I |
NOW
-
NYSE
Servicenow Inc
Computer Sftwr-Enterprse
|
$516.89
|
-1.41
-0.27% |
$521.50
|
990,037
66.13% of 50 DAV
50 DAV is 1,497,000
|
$522.77
-1.12%
|
8/20/2020
|
$453.34
|
PP = $454.79
|
|
MB = $477.53
|
Most Recent Note - 10/13/2020 4:30:50 PM
G - Posted a 3rd consecutive gain today with below average volume for another new all-time high. Found support at its 50 DMA line ($465.50) but did not form a new base of sufficient length. Fundamentals remain strong. Any losses below the 50 DMA line and prior low ($432.85 on 9/08/20) would raise concerns and trigger technical sell signals. See the latest FSU analysis for more details and a new annotated graph.
>>> FEATURED STOCK ARTICLE : Record High With Light Volume Behind 3rd Consecutive Gain - 10/13/2020 |
View all notes |
Set NEW NOTE alert |
Company Profile |
SEC
News |
Chart |
Request a new note
C
A
S
I |
VEEV
-
NYSE
Veeva Systems Inc Cl A
Computer Sftwr-Medical
|
$300.61
|
-7.94
-2.57% |
$310.80
|
946,068
118.85% of 50 DAV
50 DAV is 796,000
|
$312.00
-3.65%
|
10/6/2020
|
$287.71
|
PP = $298.86
|
|
MB = $313.80
|
Most Recent Note - 10/14/2020 7:32:01 PM
Y - Pulled back today with higher volume, retreating from its all-time high after a streak of 7 consecutive gains. Found support at its 50 DMA line ($274) while forming a 6-week flat base. It was highlighted in yellow again in the 10/06/20 mid-day report with a new pivot point cited based on its 9/02/20 high plus 10 cents. A subsequent gain above the pivot point on 10/12/20 backed by +46% above average triggered a technical buy signal. Any losses below the 50 DMA line and recent lows would raise concerns and trigger technical sell signals. Reported earnings +31% on +33% sales revenues for the Jul '20 quarter versus the year ago period. Three of the past 4 quarterly comparisons were above the +25% minimum earnings guideline (C criteria)."
>>> FEATURED STOCK ARTICLE : First Sound Base Being Built After Considerable Rally - 10/6/2020 |
View all notes |
Set NEW NOTE alert |
Company Profile |
SEC
News |
Chart |
Request a new note
C
A
S
I |
TEAM
-
NASDAQ
Atlassian Corp Plc Cl A
Comp Sftwr-Spec Enterprs
|
$191.81
|
-1.18
-0.61% |
$194.90
|
1,801,782
118.62% of 50 DAV
50 DAV is 1,519,000
|
$199.95
-4.07%
|
10/12/2020
|
$193.77
|
PP = $199.60
|
|
MB = $209.58
|
Most Recent Note - 10/12/2020 5:37:29 PM
Y - Highlighted in yellow with new pivot point cited based on its 9/01/20 high plus 10 cents. Pulled back today with higher volume. It was perched within close striking distance of its 52-week high after recently wedging higher with gains lacking great volume conviction. Subsequent gains above the pivot point backed by at least +40% above average volume may trigger a new technical buy signal. Its Relative Strength Rating has improved to 84, above the 80+ minimum guideline for buy candidates. Three of the past 4 quarterly comparisons through Jun '20 were at or above the +25% minimum earnings guideline (C criteria). It was dropped from the Featured Stocks list on 8/07/20 and found support well above its 200 DMA line during recent consolidations. See the latest FSU analysis for more details and a new annotated graph.
>>> FEATURED STOCK ARTICLE : TEAM Perched Within Close Striking Distance of New Highs - 10/12/2020 |
View all notes |
Set NEW NOTE alert |
Company Profile |
SEC
News |
Chart |
Request a new note
C
A
S
I |
|
|
|
THESE ARE NOT BUY RECOMMENDATIONS!
Comments contained in the body of this report are technical
opinions only. The material herein has been obtained
from sources believed to be reliable and accurate, however,
its accuracy and completeness cannot be guaranteed.
This site is not an investment advisor, hence it does
not endorse or recommend any securities or other investments.
Any recommendation contained in this report may not
be suitable for all investors and it is not to be deemed
an offer or solicitation on our part with respect to
the purchase or sale of any securities. All trademarks,
service marks and trade names appearing in this report
are the property of their respective owners, and are
likewise used for identification purposes only.
This report is a service available
only to active Paid Premium Members.
You may opt-out of receiving report notifications
at any time. Questions or comments may be submitted
by writing to Premium Membership Services 665 S.E. 10 Street, Suite 201 Deerfield Beach, FL 33441-5634 or by calling 1-800-965-8307
or 954-785-1121.
|
|
|