You are not logged in.
This means you
CAN ONLY VIEW reports that were published prior to Sunday, February 25, 2024.
You
MUST UPGRADE YOUR MEMBERSHIP if you want to see any current reports.
AFTER MARKET UPDATE - TUESDAY, OCTOBER 13TH, 2020
Previous After Market Report Next After Market Report >>>
|
|
|
|
DOW |
-157.71 |
28,679.81 |
-0.55% |
|
Volume |
756,619,551 |
+1% |
|
Volume |
3,596,255,900 |
-6% |
|
NASDAQ |
-12.95 |
11,863.31 |
-0.11% |
|
Advancers |
1,002 |
33% |
|
Advancers |
1,299 |
39% |
|
S&P 500 |
-22.29 |
3,511.93 |
-0.63% |
|
Decliners |
1,993 |
67% |
|
Decliners |
2,057 |
61% |
|
Russell 2000 |
-12.21 |
1,636.85 |
-0.74% |
|
52 Wk Highs |
100 |
|
|
52 Wk Highs |
152 |
|
|
S&P 600 |
-10.51 |
922.27 |
-1.13% |
|
52 Wk Lows |
17 |
|
|
52 Wk Lows |
20 |
|
|
The major indices have shown improvement and have resumed a market uptrend as leadership has improved. Disciplined investors carefully may buy leading stocks on a case-by-case basis. Always remain ready to reduce market exposure in the event of any more substantial market downdrafts.
|
 |
Breadth Negative as Major Indices Pulled Back
Kenneth J. Gruneisen - Passed the CAN SLIM® Master's Exam
The S&P 500 dipped 0.6% after touching its best level in six weeks on Monday. The Dow snapped a four session winning streak, declining 157 points. The Nasdaq Composite slipped 0.1%. The reported volume totals were mixed, higher than the prior session on the NYSE and lighter on the Nasdaq exchange. Breadth was negative as decliners led advancers by almost a 2-1 margin on the NYSE and 3-2 on the Nasdaq exchange. There were 77 high-ranked companies from the Leaders List that hit new 52-week highs and were listed on the BreakOuts Page, versus the total of 119 on the prior session. New 52-week highs totals contracted yet easily outnumbered new 52-week lows totals on the NYSE and on the Nasdaq exchange. The major indices are in a confirmed uptrend (M criteria). New buying efforts may be justified in leading stocks on a case-by-case basis. 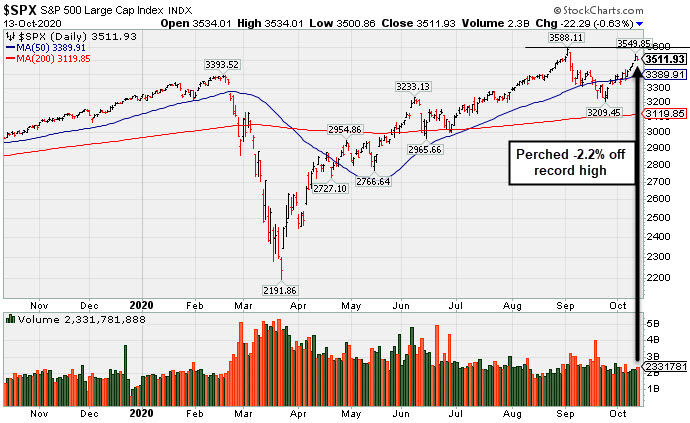 PICTURED: The S&P 500 Index is -2.2% off its record high.
Stocks fell on Tuesday as market participants weighed third-quarter corporate profit tallies and COVID-19 updates. Nine of 11 S&P 500 sectors finished in negative territory, with Financials leading laggards. In earnings, JP Morgan Chase & Co (JPM -1.62%) fell despite reporting smaller-than-forecasted loan loss provisions, with the Wall Street bank noting that this did not necessarily indicate an improved economic outlook. BlackRock (BLK +3.91%) rose as strong inflows helped the world’s largest asset manager exceed profit and revenue estimates. Elsewhere, Johnson & Johnson (JNJ -2.29%) fell despite better-than-expected quarterly figures, as an unexplained illness in one of its COVID-19 vaccine study participants resulted in an unexpected halt to its clinical trials. Adding to the downbeat coronavirus headlines was news that Eli Lily (LLY -2.85%) fell after it paused an experimental study of its antibody COVID-19 treatment due to potential safety concerns. In other corporate news, Walt Disney (DIS +3.19%) climbed after announcing its media and entertainment business would be reorganized to accelerate growth in its video streaming segments. Apple (AAPL -2.65%) slipped, paring Monday’s sharp gains after revealing its highly anticipated 5G compatible range of iPhones.
On the data front, the NFIB’s gauge of small business optimism improved more than anticipated in September, climbing to its highest level since February. Treasuries strengthened with the yield on the 10-year note down five basis points to 0.72%. In commodities, WTI crude rebounded 2.1% to $40.25/barrel after data showed strong demand from China. |
 Kenneth J. Gruneisen started out as a licensed stockbroker in August 1987, a couple of months prior to the historic stock market crash that took the Dow Jones Industrial Average down -22.6% in a single day. He has published daily fact-based fundamental and technical analysis on high-ranked stocks online for two decades. Through FACTBASEDINVESTING.COM, Kenneth provides educational articles, news, market commentary, and other information regarding proven investment systems that work in good times and bad.
Comments contained in the body of this report are technical opinions only and are not necessarily those of Gruneisen Growth Corp. The material herein has been obtained from sources believed to be reliable and accurate, however, its accuracy and completeness cannot be guaranteed. Our firm, employees, and customers may effect transactions, including transactions contrary to any recommendation herein, or have positions in the securities mentioned herein or options with respect thereto. Any recommendation contained in this report may not be suitable for all investors and it is not to be deemed an offer or solicitation on our part with respect to the purchase or sale of any securities. |
|
 |
Financial, Networking, and Energy-Linked Groups Led Decliners
Kenneth J. Gruneisen - Passed the CAN SLIM® Master's Exam
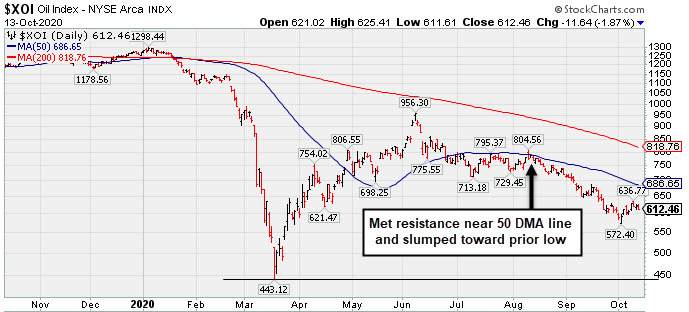
Financials created a drag on the major indices as the Bank Index ($BKX -2.85%) outpaced the Broker/Dealer Index ($XBD -1.29%) to the downside. The Retail Index ($RLX +0.28%) eked out a modest gain. The Networking Index ($NWX -1.57%) led the tech sector lower while both the Semiconductor Index ($SOX -0.14%) and the Biotech Index ($BTK +0.14%) were little changed. Commodity-linked groups had a negative bias as the Oil Services Index ($OSX -1.98%) and Integrated Oil Index ($XOI -1.87%) both outpaced the Gold & Silver Index ($XAU -0.77%) to the downside. PICTURED: The Integrated Oil Index ($XOI -1.87%) met resistance at its 50-day moving average (DMA) line and has been slumping toward the March low.
| Oil Services |
$OSX |
28.73 |
-0.58 |
-1.98% |
-63.31% |
| Integrated Oil |
$XOI |
612.46 |
-11.64 |
-1.87% |
-51.80% |
| Semiconductor |
$SOX |
2,430.13 |
-3.35 |
-0.14% |
+31.39% |
| Networking |
$NWX |
563.25 |
-9.01 |
-1.57% |
-3.46% |
| Broker/Dealer |
$XBD |
297.97 |
-3.89 |
-1.29% |
+2.61% |
| Retail |
$RLX |
3,660.81 |
+10.32 |
+0.28% |
+49.47% |
| Gold & Silver |
$XAU |
148.71 |
-1.15 |
-0.77% |
+39.08% |
| Bank |
$BKX |
78.22 |
-2.30 |
-2.85% |
-31.00% |
| Biotech |
$BTK |
5,618.77 |
+7.66 |
+0.14% |
+10.88% |
|
|
|
 |
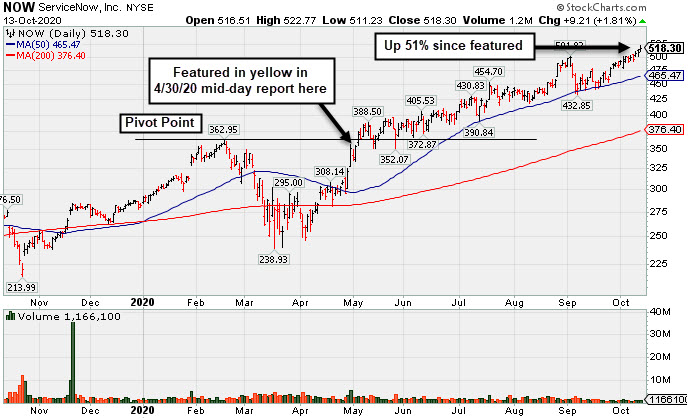
Record High With Light Volume Behind 3rd Consecutive Gain
Kenneth J. Gruneisen - Passed the CAN SLIM® Master's Exam
ServiceNow Inc (NOW +$9.21 or +1.81% to $518.30) posted a gain 3rd consecutive today with below average volume for yet another new all-time high. Found support at its 50-day moving average (DMA) line ($465.49) during the recent consolidation but did not form a new base of sufficient length. Fundamentals remain strong. Any losses below the 50 DMA line and prior low ($432.85 on 9/08/20) would raise concerns and trigger technical sell signals.
Keep in mind it is due to report Sep '20 quarterly results on 10/28/20. It reported Jun '20 quarterly earnings +73% on +28% sales revenues versus the year ago period. Results have been routinely above the +25% minimum earnings guideline (C criteria). It has an Earnings Per Share Rating of 99. The Computer Software - Enterprise group has a Group Relative Strength Rating of 93, a reassuring sign concerning the L criteria. NOW has a new CEO as of 1/01/20.
NOW is up+51% since first highlighted in yellow in the 4/30/20 mid-day report with a pivot point based on its 2/19/20 high plus 10 cents (read here). It was last shown in this FSU section on 9/25/20 with an annotated graph under the headline, "Gain Back Above "Max Buy" Level for ServiceNow". The number of top-rated funds owning its shares rose from 1,030 in Jun '17 to 2.382 in Jun '20, a reassuring sign concerning the I criteria. It has a Timeliness Rating of A and a Sponsorship Rating of A. Its current Up/Down Volume Ratio of 1.0 is an unbiased indication its shares have been neutral concerning accumulation/distribution over the past 50 days. |
|
|
Color Codes Explained :
Y - Better candidates highlighted by our
staff of experts.
G - Previously featured
in past reports as yellow but may no longer be buyable under the
guidelines.
***Last / Change / Volume data in this table is the closing quote data***
Symbol/Exchange
Company Name
Industry Group |
PRICE |
CHANGE
(%Change) |
Day High |
Volume
(% DAV)
(% 50 day avg vol) |
52 Wk Hi
% From Hi |
Featured
Date |
Price
Featured |
Pivot Featured |
|
Max Buy |
 ADBE
-
NASDAQ
ADBE
-
NASDAQ
Adobe Inc
COMPUTER SOFTWARE and SERVICES - Application Software
|
$514.31
|
+3.42
0.67% |
$519.60
|
2,395,601
76.29% of 50 DAV
50 DAV is 3,140,000
|
$536.88
-4.20%
|
9/10/2020
|
$488.46
|
PP = $536.88
|
|
MB = $563.72
|
Most Recent Note - 10/12/2020 5:35:42 PM
G - Posted a solid gain today with higher (near average) volume. Subsequent losses below the 50 DMA line ($479.59) would raise great concerns and trigger a technical sell signal. Faces near-term resistance due to overhead supply up to the $536 level. Fundamentals remain strong.
>>> FEATURED STOCK ARTICLE : Showed Resilience Near 50-Day Moving Average - 10/8/2020 |
View all notes |
Set NEW NOTE alert |
Company Profile |
SEC
News |
Chart |
Request a new note
C
A
S
I |
CRL
-
NYSE
Charles River Labs Intl
DRUGS - Biotechnology
|
$244.98
|
+1.71
0.70% |
$245.93
|
295,808
91.30% of 50 DAV
50 DAV is 324,000
|
$244.99
-0.00%
|
7/15/2020
|
$192.66
|
PP = $189.95
|
|
MB = $199.45
|
 Most Recent Note - 10/13/2020 4:35:01 PM
G - Posted a 3rd consecutive gain today with below average volume for a new all-time high. Its 50 DMA line ($220) defines support where any subsequent violation would raise concerns and trigger a technical sell signal. Raised fundamental concerns when it recently reported Jun '20 quarterly earnings -3% on +4% sales revenues, below the +25% minimum guideline (C criteria).
>>> FEATURED STOCK ARTICLE : New Record High for Charles River Labs - 10/9/2020 |
View all notes |
Set NEW NOTE alert |
Company Profile |
SEC
News |
Chart |
Request a new note
C
A
S
I |
AMD
-
NASDAQ
Advanced Micro Devices
ELECTRONICS - Semiconductor - Broad Line
|
$85.28
|
+0.99
1.17% |
$86.09
|
42,695,800
75.72% of 50 DAV
50 DAV is 56,386,000
|
$94.28
-9.55%
|
8/31/2020
|
$90.42
|
PP = $87.39
|
|
MB = $91.76
|
Most Recent Note - 10/13/2020 4:33:48 PM
G - Posted a 2nd consecutive gain with lighter volume. Reportedly is considering buying Xilinx Inc (XLNX). Recently found support near its 50 DMA line ($82.25). Any deterioration below the 50 DMA line and the recent low ($73.85 on 9/18/20) would raise greater concerns and trigger more worrisome technical sell signals. It has not formed a sound base and faces some resistance due to overhead supply up to the $94 level. Fundamentals remain strong.
>>> FEATURED STOCK ARTICLE : Rebound Above 50-Day Average With Light Volume Helped Stance - 9/28/2020 |
View all notes |
Set NEW NOTE alert |
Company Profile |
SEC
News |
Chart |
Request a new note
C
A
S
I |
TREX
-
NYSE
Trex Company Inc
MATERIALS and CONSTRUCTION - General Building Materials
|
$79.94
|
+0.29
0.36% |
$81.23
|
599,749
64.21% of 50 DAV
50 DAV is 934,000
|
$79.99
-0.06%
|
6/26/2020
|
$54.53
|
PP = $66.47
|
|
MB = $69.79
|
Most Recent Note - 10/13/2020 4:36:35 PM
G - Posted a 4th consecutive gain today with below average volume while hitting a new all-time high. It did not form a sound base pattern. Any losses below the 50 DMA line ($71.89) or recent low ($63.32 on 9/21/20) would raise concerns and trigger technical sell signals. Do not be confused by the 2:1 share split effective 9/15/20 (Featured Price, Pivot Point, and Max Buy prices have been adjusted accordingly). Fundamentals remain strong.
>>> FEATURED STOCK ARTICLE : TREX Rebounded Above 50-Day Moving Average - 9/30/2020 |
View all notes |
Set NEW NOTE alert |
Company Profile |
SEC
News |
Chart |
Request a new note
C
A
S
I |
NFLX
-
NASDAQ
Netflix Inc
SPECIALTY RETAIL - Music and Video Stores
|
$554.09
|
+14.28
2.65% |
$557.65
|
5,566,900
99.02% of 50 DAV
50 DAV is 5,622,000
|
$575.37
-3.70%
|
9/1/2020
|
$547.45
|
PP = $575.47
|
|
MB = $604.24
|
Most Recent Note - 10/13/2020 4:13:45 PM
G - Posted a 3rd consecutive gain today with volume just below average, rebounding near its prior high ($557 on 9/01/20) which may act as resistance. Its 50 DMA line ($502.54) and recent low ($458.60 on 9/18/20) define important near term support where any further deterioration would raise more serious concerns and trigger technical sell signals.
>>> FEATURED STOCK ARTICLE : Quiet Rebound Meeting Resistance at 50-Day Moving Average - 9/29/2020 |
View all notes |
Set NEW NOTE alert |
Company Profile |
SEC
News |
Chart |
Request a new note
C
A
S
I |
Symbol/Exchange
Company Name
Industry Group |
PRICE |
CHANGE
(%Change) |
Day High |
Volume
(% DAV)
(% 50 day avg vol) |
52 Wk Hi
% From Hi |
Featured
Date |
Price
Featured |
Pivot Featured |
|
Max Buy |
LGIH
-
NASDAQ
L G I Homes Inc
Bldg-Resident/Comml
|
$128.10
|
+0.27
0.21% |
$128.88
|
149,221
51.28% of 50 DAV
50 DAV is 291,000
|
$131.95
-2.92%
|
10/1/2020
|
$123.17
|
PP = $124.04
|
|
MB = $130.24
|
Most Recent Note - 10/12/2020 5:31:53 PM
Y - Posted another small gain today with light volume for a best-ever close. Color code was recently changed to yellow with new pivot point cited based on its 8/04/20 high plus 10 cents. Subsequent gains above the pivot point backed by at least +40% above average volume are still needed to clinch a proper new (or add-on) technical buy signal. The 50 DMA line ($114.67) and latest low ($101.30 on 9/21/20) define near-term support. Reported Jun '20 quarterly earnings +21% on +4% sales revenues, breaking a streak of 4 comparisons above the +25% minimum guideline (C criteria).
>>> FEATURED STOCK ARTICLE : New Base Formed by Strong Homebuilder - 10/1/2020 |
View all notes |
Set NEW NOTE alert |
Company Profile |
SEC
News |
Chart |
Request a new note
C
A
S
I |
NOW
-
NYSE
Servicenow Inc
Computer Sftwr-Enterprse
|
$518.30
|
+9.21
1.81% |
$522.77
|
1,179,620
78.12% of 50 DAV
50 DAV is 1,510,000
|
$515.55
0.53%
|
8/20/2020
|
$453.34
|
PP = $454.79
|
|
MB = $477.53
|
Most Recent Note - 10/13/2020 4:30:50 PM
G - Posted a 3rd consecutive gain today with below average volume for another new all-time high. Found support at its 50 DMA line ($465.50) but did not form a new base of sufficient length. Fundamentals remain strong. Any losses below the 50 DMA line and prior low ($432.85 on 9/08/20) would raise concerns and trigger technical sell signals. See the latest FSU analysis for more details and a new annotated graph.
>>> FEATURED STOCK ARTICLE : Record High With Light Volume Behind 3rd Consecutive Gain - 10/13/2020 |
View all notes |
Set NEW NOTE alert |
Company Profile |
SEC
News |
Chart |
Request a new note
C
A
S
I |
VEEV
-
NYSE
Veeva Systems Inc Cl A
Computer Sftwr-Medical
|
$308.55
|
+1.39
0.45% |
$312.00
|
747,252
94.23% of 50 DAV
50 DAV is 793,000
|
$308.75
-0.06%
|
10/6/2020
|
$287.71
|
PP = $298.86
|
|
MB = $313.80
|
Most Recent Note - 10/12/2020 12:38:59 PM
Y - Gapped up today hitting a new all-time high. Found support at its 50 DMA line ($272) while forming a 5-week flat base. It was highlighted in yellow again in the 10/06/20 mid-day report with a new pivot point cited based on its 9/02/20 high plus 10 cents when noted - "Subsequent gains above the pivot point backed by at least +40% above average volume may trigger a technical buy signal. Any losses below the 50 DMA line and recent lows would raise concerns and trigger technical sell signals. Reported earnings +31% on +33% sales revenues for the Jul '20 quarter versus the year ago period. Three of the past 4 quarterly comparisons were above the +25% minimum earnings guideline (C criteria)."
>>> FEATURED STOCK ARTICLE : First Sound Base Being Built After Considerable Rally - 10/6/2020 |
View all notes |
Set NEW NOTE alert |
Company Profile |
SEC
News |
Chart |
Request a new note
C
A
S
I |
TEAM
-
NASDAQ
Atlassian Corp Plc Cl A
Comp Sftwr-Spec Enterprs
|
$192.99
|
-1.28
-0.66% |
$196.64
|
1,428,928
92.43% of 50 DAV
50 DAV is 1,546,000
|
$199.95
-3.48%
|
10/12/2020
|
$193.77
|
PP = $199.60
|
|
MB = $209.58
|
Most Recent Note - 10/12/2020 5:37:29 PM
Y - Highlighted in yellow with new pivot point cited based on its 9/01/20 high plus 10 cents. Pulled back today with higher volume. It was perched within close striking distance of its 52-week high after recently wedging higher with gains lacking great volume conviction. Subsequent gains above the pivot point backed by at least +40% above average volume may trigger a new technical buy signal. Its Relative Strength Rating has improved to 84, above the 80+ minimum guideline for buy candidates. Three of the past 4 quarterly comparisons through Jun '20 were at or above the +25% minimum earnings guideline (C criteria). It was dropped from the Featured Stocks list on 8/07/20 and found support well above its 200 DMA line during recent consolidations. See the latest FSU analysis for more details and a new annotated graph.
>>> FEATURED STOCK ARTICLE : TEAM Perched Within Close Striking Distance of New Highs - 10/12/2020 |
View all notes |
Set NEW NOTE alert |
Company Profile |
SEC
News |
Chart |
Request a new note
C
A
S
I |
|
|
|
THESE ARE NOT BUY RECOMMENDATIONS!
Comments contained in the body of this report are technical
opinions only. The material herein has been obtained
from sources believed to be reliable and accurate, however,
its accuracy and completeness cannot be guaranteed.
This site is not an investment advisor, hence it does
not endorse or recommend any securities or other investments.
Any recommendation contained in this report may not
be suitable for all investors and it is not to be deemed
an offer or solicitation on our part with respect to
the purchase or sale of any securities. All trademarks,
service marks and trade names appearing in this report
are the property of their respective owners, and are
likewise used for identification purposes only.
This report is a service available
only to active Paid Premium Members.
You may opt-out of receiving report notifications
at any time. Questions or comments may be submitted
by writing to Premium Membership Services 665 S.E. 10 Street, Suite 201 Deerfield Beach, FL 33441-5634 or by calling 1-800-965-8307
or 954-785-1121.
|
|
|