You are not logged in.
This means you
CAN ONLY VIEW reports that were published prior to Saturday, February 24, 2024.
You
MUST UPGRADE YOUR MEMBERSHIP if you want to see any current reports.
AFTER MARKET UPDATE - FRIDAY, OCTOBER 12TH, 2018
Previous After Market Report Next After Market Report >>>
|
|
|
|
DOW |
+287.16 |
25,339.99 |
+1.15% |
|
Volume |
961,023,430 |
-18% |
|
Volume |
2,631,360,900 |
-16% |
|
NASDAQ |
+167.83 |
7,496.89 |
+2.29% |
|
Advancers |
1,729 |
57% |
|
Advancers |
1,836 |
60% |
|
S&P 500 |
+38.76 |
2,767.13 |
+1.42% |
|
Decliners |
1,280 |
43% |
|
Decliners |
1,215 |
40% |
|
Russell 2000 |
+1.30 |
1,546.68 |
+0.08% |
|
52 Wk Highs |
10 |
|
|
52 Wk Highs |
17 |
|
|
S&P 600 |
-1.85 |
965.38 |
-0.19% |
|
52 Wk Lows |
396 |
|
|
52 Wk Lows |
267 |
|
|
 |
Leadership Elusive as Major Indices Bounce Back With Less Volume
Kenneth J. Gruneisen - Passed the CAN SLIM® Master's Exam
For the week, the Dow fell 4.2%, the S&P 500 declined 4.1%, and the Nasdaq Composite lost 3.7%. Stocks finished higher Friday. The Dow climbed 287 points to 25339, while the S&P 500 gained 38 points to 2767. The Nasdaq Composite rallied 167 points to 7496. Volume totals reported were lighter on the NYSE and on the Nasdaq exchange versus the prior session, a clear indication of lackluster buying coming from the institutional crowd. Advancers led decliners by almost a 3-2 margin on the NYSE and on the Nasdaq exchange. For a second consecutive session there were 0 high-ranked companies from the Leaders List that made new 52-week highs and were listed on the BreakOuts Page - down considerably from 38 last Friday, providing clear proof that market leadership has completely evaporated. New 52-week lows totals solidly outnumbered new 52-week highs on both the NYSE and Nasdaq. Recent reports have noted that the major indices (M criteria) have shown action indicative of a market correction while leadership has evaporated. During market corrections investors should have a bias toward selling stocks on a case-by-case basis as technical sell signals occur, raising cash levels while reducing market exposure. The Featured Stocks Page provides the most timely analysis on high-ranked leaders. Charts used courtesy of www.stockcharts.com
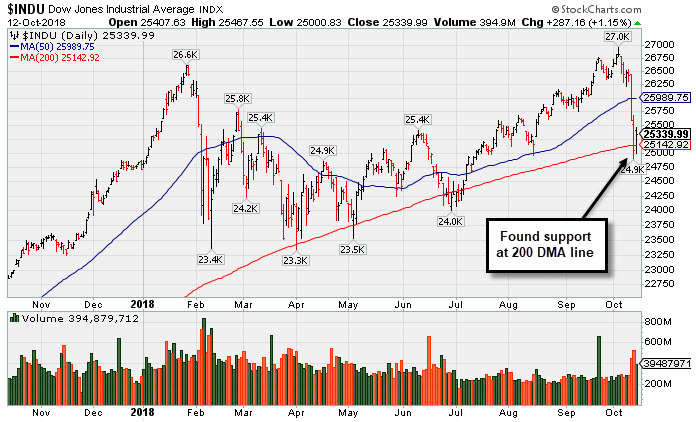
PICTURED: The Dow Jones Industrial Average found prompt support near its 200-day moving average (DMA) line. Recent losses on higher volume have been indicative of worrisome distributional pressure.
The major averages recovered from a steep two-day sell-off as generally positive earnings from large Wall Street banks helped lift investor sentiment. The S&P 500 pared its worst weekly decline since March as Tech shares rallied 3.2%. On the data front, a preliminary reading from the University of Michigan showed consumer sentiment is easing slightly in October. An additional survey revealed import prices unexpectedly increased 0.5% in September while export prices were unchanged from the prior month.
Ten of 11 S&P 500 sectors closed in positive territory with the Real Estate group the sole laggard. Tech shares led today’s rebound. Microsoft (MSFT +3.46%) rose following an analyst upgrade. Shares of Apple (AAPL +3.57%) rose. Consumer Discretionary stocks also outperformed as Amazon (AMZN +4.03%) and Nike (NKE +1.88%) rose. Financials lagged the broader market advance with PNC Financial (PNC -5.58%) after the lender revealed disappointing loan growth in the third-quarter.
Treasuries finished lower along the curve with the yield on the 10-year note up two basis points to 3.16%. In commodities, WTI crude rebounded 1.0% to $71.67/barrel. COMEX gold was off 0.4% to $1,218.10/ounce, though still advancing 2.2% so far in October. |
 Kenneth J. Gruneisen started out as a licensed stockbroker in August 1987, a couple of months prior to the historic stock market crash that took the Dow Jones Industrial Average down -22.6% in a single day. He has published daily fact-based fundamental and technical analysis on high-ranked stocks online for two decades. Through FACTBASEDINVESTING.COM, Kenneth provides educational articles, news, market commentary, and other information regarding proven investment systems that work in good times and bad.
Comments contained in the body of this report are technical opinions only and are not necessarily those of Gruneisen Growth Corp. The material herein has been obtained from sources believed to be reliable and accurate, however, its accuracy and completeness cannot be guaranteed. Our firm, employees, and customers may effect transactions, including transactions contrary to any recommendation herein, or have positions in the securities mentioned herein or options with respect thereto. Any recommendation contained in this report may not be suitable for all investors and it is not to be deemed an offer or solicitation on our part with respect to the purchase or sale of any securities. |
|
 |
Retail, Tech, Energy, and Broker/Dealer Indexes Rose
Kenneth J. Gruneisen - Passed the CAN SLIM® Master's Exam
While the Retail Index ($RLX +2.75%) was a standout gainer on Friday, the Bank Index ($BKX -0.82%) fell and the Broker/Dealer Index ($XBD +0.69%) rose, giving mixed signals. The tech sector had a positive bias as the Networking Index ($NWX +1.82%), Biotech Index ($BTK +2.00%), and the Semiconductor Index ($SOX +1.97%) each bounced back from a sharp sell-off. The Oil Services Index ($OSX +0.94%) and the Integrated Oil Index ($XOI +0.73%) both rose, meanwhile the Gold & Silver Index ($XAU -0.99%) ended slightly lower.
Charts courtesy of www.stockcharts.com
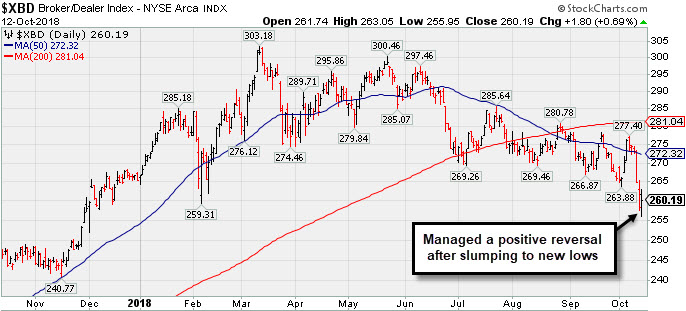 PICTURED: The Broker/Dealer Index ($XBD +0.69%) managed a "positive reversal" on Friday after slumping to new lows.
| Oil Services |
$OSX |
143.80 |
+1.34 |
+0.94% |
-3.84% |
| Integrated Oil |
$XOI |
1,494.84 |
+10.89 |
+0.73% |
+11.93% |
| Semiconductor |
$SOX |
1,253.58 |
+24.22 |
+1.97% |
+0.04% |
| Networking |
$NWX |
510.93 |
+9.14 |
+1.82% |
+4.16% |
| Broker/Dealer |
$XBD |
260.19 |
+1.80 |
+0.69% |
-1.90% |
| Retail |
$RLX |
2,237.06 |
+59.88 |
+2.75% |
+29.03% |
| Gold & Silver |
$XAU |
69.28 |
-0.69 |
-0.99% |
-18.75% |
| Bank |
$BKX |
100.47 |
-0.84 |
-0.83% |
-5.85% |
| Biotech |
$BTK |
4,912.92 |
+96.55 |
+2.00% |
+16.36% |
|
|
|
 |
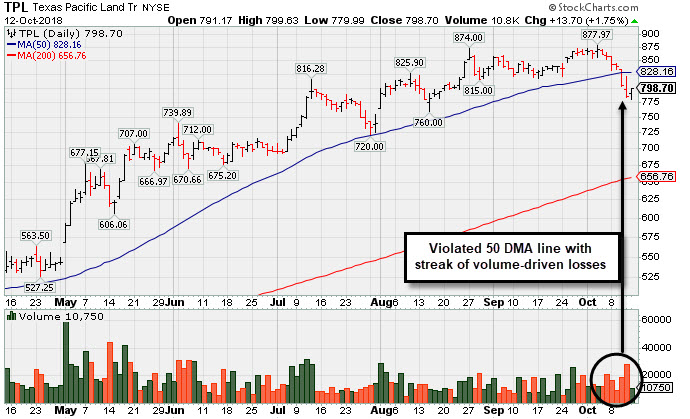
Slump Below 50-Day Moving Average Hurt Technical Stance
Kenneth J. Gruneisen - Passed the CAN SLIM® Master's Exam
Texas Pacific Land Trust (TPL +$13.70 or +1.75% to $798.70) bounced today after 6 consecutive losses marked by higher volume. Recently it violated its 50-day moving average (DMA) line and prior low ($828) triggering technical sell signals. A rebound above the 50 DMA line is needed for its outlook to improve. The prior low ($760 on 8/15/18) defines the next important near-term support to watch.
The thinly-traded Texas Real Estate Development firm has only 7.8 million shares outstanding (S criteria). It reported earnings +161% on +129% sales revenues for the Jun '18 quarter, marking its 7th very strong quarterly comparison above the +25% minimum guideline (C criteria). Annual earnings (A criteria) history has been strong.
TPL was last shown in this FSU section on 9/04/18 with an annotated graph under the headline, "Best Ever Close After a Solid Gain on Higher Volume". The number of top-rated funds owning its shares rose from 37 in Dec '16 to 74 in Jun '18, a reassuring sign concerning the I criteria. The current Up/Down Volume ratio of 1.1 is an unbiased indication its shares have been under slight institutional accumulation over the past 50 days. It has earned a Timeliness rating of A and a Sponsorship Rating of B.
|
|
|
Color Codes Explained :
Y - Better candidates highlighted by our
staff of experts.
G - Previously featured
in past reports as yellow but may no longer be buyable under the
guidelines.
***Last / Change / Volume data in this table is the closing quote data***
Symbol/Exchange
Company Name
Industry Group |
PRICE |
CHANGE
(%Change) |
Day High |
Volume
(% DAV)
(% 50 day avg vol) |
52 Wk Hi
% From Hi |
Featured
Date |
Price
Featured |
Pivot Featured |
|
Max Buy |
OSBC
-
NASDAQ
Old Second Bancorp Inc
BANKING - Regional - Midwest Banks
|
$14.55
|
-0.15
-1.02% |
$15.19
|
161,128
169.61% of 50 DAV
50 DAV is 95,000
|
$16.30
-10.74%
|
9/24/2018
|
$15.38
|
PP = $16.40
|
|
MB = $17.22
|
Most Recent Note - 10/10/2018 1:33:01 PM
G - Color code is changed to green while sputtering below its 50 DMA line ($15.34). Prior lows and its 200 DMA line define additional near-term support. Its Relative Strength Rating is 74, below the 80+ minimum guideline for buy candidates. Met stubborn resistance after hitting a new high on 7/26/18 with a big volume-driven gain. Fundamentals remain strong.
>>> FEATURED STOCK ARTICLE : Bank Recently Sputtering Below its 50-Day Moving Average - 10/10/2018 |
View all notes |
Set NEW NOTE alert |
Company Profile |
SEC
News |
Chart |
Request a new note
C
A
S
I |
SIVB
-
NASDAQ
S V B Financial Group
BANKING - Regional - Pacific Banks
|
$290.01
|
-2.88
-0.98% |
$303.55
|
1,116,995
289.38% of 50 DAV
50 DAV is 386,000
|
$333.74
-13.10%
|
8/6/2018
|
$314.77
|
PP = $329.75
|
|
MB = $346.24
|
 Most Recent Note - 10/12/2018 12:58:41 PM
G - Slumped below its 200 DMA ($287) with above average volume behind today's 7th consecutive loss raising greater concerns while also undercutting its 7/02/18 low ($284.42). A rebound above the 50 DMA line ($319) is needed for its outlook to improve. See the latest FSU analysis for more details and an annotated graph.
>>> FEATURED STOCK ARTICLE : Weak Action Amid Broader Market Declines - 10/11/2018 |
View all notes |
Set NEW NOTE alert |
Company Profile |
SEC
News |
Chart |
Request a new note
C
A
S
I |
GMED
-
NYSE
Globus Medical Inc Cl A
CHEMICALS - Specialty Chemicals
|
$51.46
|
+1.05
2.08% |
$51.76
|
794,050
129.11% of 50 DAV
50 DAV is 615,000
|
$57.55
-10.58%
|
9/26/2018
|
$56.11
|
PP = $57.65
|
|
MB = $60.53
|
Most Recent Note - 10/12/2018 6:04:14 PM
G - Halted its slide and stubbornly holding its ground this week at its 200 DMA line ($50.60). A rebound above the 50 DMA line ($52.73) is needed for its outlook to improve. Subsequent gains above the pivot point backed by more than +40% above average volume are needed to trigger a proper technical buy signal.
>>> FEATURED STOCK ARTICLE : Rallying Near Pivot Point With Volume-Driven Gains - 9/26/2018 |
View all notes |
Set NEW NOTE alert |
Company Profile |
SEC
News |
Chart |
Request a new note
C
A
S
I |
ZBRA
-
NASDAQ
Zebra Tech Corp Cl A
COMPUTER HARDWARE - Computer Peripherals
|
$157.71
|
+6.71
4.44% |
$158.55
|
942,770
240.50% of 50 DAV
50 DAV is 392,000
|
$179.47
-12.12%
|
8/7/2018
|
$164.26
|
PP = $161.82
|
|
MB = $169.91
|
Most Recent Note - 10/12/2018 5:46:57 PM
G - Posted a 2nd consecutive volume-driven gain. Recently noted losses triggered technical sell signals. Only a prompt rebound above the 50 DMA line ($167) would help its outlook improve.
>>> FEATURED STOCK ARTICLE : Hovering Near All-Time High With Strong Fundamentals - 9/24/2018 |
View all notes |
Set NEW NOTE alert |
Company Profile |
SEC
News |
Chart |
Request a new note
C
A
S
I |
TSC
-
NASDAQ
TriState Capital Hld Inc
CONSUMER NON-DURABLES - Personal Products
|
$26.18
|
-0.81
-3.00% |
$27.27
|
343,004
167.32% of 50 DAV
50 DAV is 205,000
|
$30.10
-13.02%
|
9/11/2018
|
$29.75
|
PP = $30.20
|
|
MB = $31.71
|
Most Recent Note - 10/12/2018 5:40:40 PM
Tested its 200 DMA line ($25.91) with a 5th consecutive volume-driven loss today. Faces near-term resistance due to overhead supply up to the $30 level. It will be dropped from the Featured Stocks list tonight.
>>> FEATURED STOCK ARTICLE : TriState Bank Perched Near All-Time High - 9/11/2018 |
View all notes |
Set NEW NOTE alert |
Company Profile |
SEC
News |
Chart |
Request a new note
C
A
S
I |
Symbol/Exchange
Company Name
Industry Group |
PRICE |
CHANGE
(%Change) |
Day High |
Volume
(% DAV)
(% 50 day avg vol) |
52 Wk Hi
% From Hi |
Featured
Date |
Price
Featured |
Pivot Featured |
|
Max Buy |
CME
-
NASDAQ
C M E Group Inc
DIVERSIFIED SERVICES - Business/Management Services
|
$176.50
|
+0.47
0.27% |
$177.55
|
1,732,606
127.59% of 50 DAV
50 DAV is 1,358,000
|
$182.97
-3.54%
|
10/4/2018
|
$179.29
|
PP = $177.45
|
|
MB = $186.32
|
Most Recent Note - 10/10/2018 5:53:05 PM
Y - Stubbornly holding its ground despite broad market weakness (M criteria). Prior highs in the $177 area define initial support to watch on pullbacks.
>>> FEATURED STOCK ARTICLE : CME Group Blasted to New Record High - 10/4/2018 |
View all notes |
Set NEW NOTE alert |
Company Profile |
SEC
News |
Chart |
Request a new note
C
A
S
I |
FLT
-
NYSE
Fleetcor Technologies
DIVERSIFIED SERVICES - Business/Management Services
|
$208.26
|
+7.66
3.82% |
$208.98
|
715,154
138.52% of 50 DAV
50 DAV is 516,300
|
$230.24
-9.55%
|
9/12/2018
|
$221.01
|
PP = $226.02
|
|
MB = $237.32
|
Most Recent Note - 10/12/2018 6:01:22 PM
G - Rebounded near its 200 DMA line ($209) with today's volume-driven gain after 6 consecutive losses. A rebound above the 50 DMA line ($217) is needed for its outlook to improve. Subsequent volume-driven gains above the pivot point are needed to trigger a new (or add-on) technical buy signal.
>>> FEATURED STOCK ARTICLE : Perched Within Close Striking Distance of New Pivot Point - 9/20/2018 |
View all notes |
Set NEW NOTE alert |
Company Profile |
SEC
News |
Chart |
Request a new note
C
A
S
I |
MA
-
NYSE
Mastercard Inc Cl A
Finance-CrdtCard/PmtPr
|
$204.22
|
+9.71
4.99% |
$204.84
|
6,090,007
184.32% of 50 DAV
50 DAV is 3,304,000
|
$225.35
-9.38%
|
7/11/2018
|
$203.84
|
PP = $204.10
|
|
MB = $214.31
|
Most Recent Note - 10/12/2018 12:45:30 PM
G - Bouncing back today after damaging losses. Slumped near its 200 DMA line ($189) after volume-driven losses this week triggered technical sell signals. A rebound above the 50 DMA line ($211) is needed for its outlook to improve.
>>> FEATURED STOCK ARTICLE : Hovering Near High, Extended From Any Sound Base - 9/27/2018 |
View all notes |
Set NEW NOTE alert |
Company Profile |
SEC
News |
Chart |
Request a new note
C
A
S
I |
V
-
NYSE
Visa Inc Cl A
Finance-CrdtCard/PmtPr
|
$140.06
|
+6.33
4.73% |
$140.98
|
12,959,569
171.13% of 50 DAV
50 DAV is 7,573,000
|
$151.56
-7.59%
|
4/26/2018
|
$126.68
|
PP = $126.98
|
|
MB = $133.33
|
Most Recent Note - 10/12/2018 1:03:00 PM
G - Bouncing today after slumping near its 200 DMA line ($131) following noted technical sell signals. A rebound above the 50 DMA line ($144) is needed for its outlook to improve.
>>> FEATURED STOCK ARTICLE : Visa Near Record but Endured Distributional Pressure - 9/13/2018 |
View all notes |
Set NEW NOTE alert |
Company Profile |
SEC
News |
Chart |
Request a new note
C
A
S
I |
ENV
-
NYSE
Envestnet Inc
FINANCIAL SERVICES - Diversified Investments
|
$56.12
|
+0.27
0.48% |
$57.50
|
240,572
94.30% of 50 DAV
50 DAV is 255,100
|
$64.80
-13.40%
|
6/15/2018
|
$57.85
|
PP = $60.37
|
|
MB = $63.39
|
Most Recent Note - 10/11/2018 12:25:42 PM
G - Testing its 200 DMA line ($57.05) with today's 5th consecutive loss. More damaging losses would raise greater concerns. A rebound above its 50 DMA line ($61.13) is needed for its outlook to improve. Its Relative Strength Rating is 80, right at the 80+ minimum guideline for buy candidates. Fundamentals remain strong.
>>> FEATURED STOCK ARTICLE : Found Recent Support at 50-Day Moving Average - 9/21/2018 |
View all notes |
Set NEW NOTE alert |
Company Profile |
SEC
News |
Chart |
Request a new note
C
A
S
I |
Symbol/Exchange
Company Name
Industry Group |
PRICE |
CHANGE
(%Change) |
Day High |
Volume
(% DAV)
(% 50 day avg vol) |
52 Wk Hi
% From Hi |
Featured
Date |
Price
Featured |
Pivot Featured |
|
Max Buy |
TPL
-
NYSE
Texas Pacific Land Trust
Real Estate Dvlpmt/Ops
|
$798.70
|
+13.70
1.75% |
$799.63
|
10,750
82.69% of 50 DAV
50 DAV is 13,000
|
$877.97
-9.03%
|
9/14/2018
|
$820.45
|
PP = $874.10
|
|
MB = $917.81
|
Most Recent Note - 10/11/2018 1:00:24 PM
G - Sputtering today, on track for a 6th consecutive loss marked by higher volume after violating its 50 DMA line and prior low ($818) on the prior session triggering technical sell signals. A rebound above the 50 DMA line ($828) is needed for its outlook to improve. The prior low ($760 on 8/15/18) defines the next important near-term support to watch.
>>> FEATURED STOCK ARTICLE : Slump Below 50-Day Moving Average Hurt Technical Stance - 10/12/2018 |
View all notes |
Set NEW NOTE alert |
Company Profile |
SEC
News |
Chart |
Request a new note
C
A
S
I |
ABMD
-
NASDAQ
Abiomed Inc
HEALTH SERVICES - Medical Instruments and Supplies
|
$384.78
|
+17.24
4.69% |
$396.19
|
973,930
167.34% of 50 DAV
50 DAV is 582,000
|
$459.75
-16.31%
|
9/25/2018
|
$441.96
|
PP = $451.03
|
|
MB = $473.58
|
Most Recent Note - 10/12/2018 5:42:27 PM
G - Posted a gain today with above average volume, breaking a streak of 9 consecutive losses. A prompt rebound above the 50 DMA line ($391) would help its outlook improve.
>>> FEATURED STOCK ARTICLE : Quick Rebound Near Prior High - 9/25/2018 |
View all notes |
Set NEW NOTE alert |
Company Profile |
SEC
News |
Chart |
Request a new note
C
A
S
I |
DPZ
-
NYSE
Dominos Pizza Inc
Retail-Restaurants
|
$277.34
|
+6.46
2.38% |
$280.95
|
583,335
118.08% of 50 DAV
50 DAV is 494,000
|
$305.34
-9.17%
|
8/13/2018
|
$288.60
|
PP = $293.91
|
|
MB = $308.61
|
Most Recent Note - 10/12/2018 5:55:24 PM
G - Still sputtering below its 50 DMA line ($287) after volume-driven losses this week raised greater concerns. The prior low ($253.63 on 7/31/18) and 200 DMA line ($252) and define important near-term support to watch.
>>> FEATURED STOCK ARTICLE : Pulling Back After Wedging Gains for Highs Lacked Great Volume - 9/5/2018 |
View all notes |
Set NEW NOTE alert |
Company Profile |
SEC
News |
Chart |
Request a new note
C
A
S
I |
FIVE
-
NASDAQ
Five Below Inc
Retail-DiscountandVariety
|
$114.56
|
+1.80
1.60% |
$116.76
|
792,021
84.26% of 50 DAV
50 DAV is 940,000
|
$136.13
-15.85%
|
7/6/2018
|
$98.90
|
PP = $104.09
|
|
MB = $109.29
|
Most Recent Note - 10/10/2018 5:56:26 PM
G - Violated its 50 DMA line ($117) with today's volume-driven loss triggering a technical sell signal. The prior high ($109.09 on 7/19/18) defines the next important support level to watch.
>>> FEATURED STOCK ARTICLE : Retreating After +138% Rally in Under 12 Months - 10/2/2018 |
View all notes |
Set NEW NOTE alert |
Company Profile |
SEC
News |
Chart |
Request a new note
C
A
S
I |
NVEE
-
NASDAQ
N V 5 Global Inc
Comml Svcs-Consulting
|
$82.42
|
+0.20
0.24% |
$84.00
|
65,330
72.59% of 50 DAV
50 DAV is 90,000
|
$92.75
-11.14%
|
6/15/2018
|
$7,070.00
|
PP = $72.00
|
|
MB = $75.60
|
Most Recent Note - 10/8/2018 6:55:02 PM
G - Still sputtering below its 50 DMA line ($86.32). A rebound above the 50 DMA line is needed for its outlook to improve. See the latest FSU analysis for more details and a new annotated graph.
>>> FEATURED STOCK ARTICLE : Recently Slumped Below 50-Day Moving Average Line - 10/8/2018 |
View all notes |
Set NEW NOTE alert |
Company Profile |
SEC
News |
Chart |
Request a new note
C
A
S
I |
Symbol/Exchange
Company Name
Industry Group |
PRICE |
CHANGE
(%Change) |
Day High |
Volume
(% DAV)
(% 50 day avg vol) |
52 Wk Hi
% From Hi |
Featured
Date |
Price
Featured |
Pivot Featured |
|
Max Buy |
PANW
-
NYSE
Palo Alto Networks
Computer Sftwr-Security
|
$211.95
|
+8.78
4.32% |
$213.78
|
1,727,393
139.64% of 50 DAV
50 DAV is 1,237,000
|
$239.50
-11.50%
|
6/12/2018
|
$206.55
|
PP = $214.69
|
|
MB = $225.42
|
Most Recent Note - 10/12/2018 5:45:24 PM
G - Posted a 2nd consecutive volume-driven gain. A rebound above the 50 DMA line ($221) is needed for its outlook to improve. Its 200 DMA line ($196) defines the next important support level to watch.
>>> FEATURED STOCK ARTICLE : Perched Near All-Time High With Volume Totals Cooling - 9/17/2018 |
View all notes |
Set NEW NOTE alert |
Company Profile |
SEC
News |
Chart |
Request a new note
C
A
S
I |
HQY
-
NASDAQ
Healthequity Inc
COMPUTER SOFTWARE and SERVICES - Healthcare Information Service
|
$83.48
|
+0.65
0.78% |
$85.62
|
754,069
99.61% of 50 DAV
50 DAV is 757,000
|
$99.99
-16.51%
|
8/13/2018
|
$82.39
|
PP = $83.44
|
|
MB = $87.61
|
Most Recent Note - 10/8/2018 6:48:54 PM
G - Quietly slumped below its 50 DMA line ($89.05) today raising concerns. More damaging losses would raise greater concerns. Prior highs in the $82-83 area define the next important support to watch.
>>> FEATURED STOCK ARTICLE : Very Extended From Any Sound Base After Streak of Gains - 9/10/2018 |
View all notes |
Set NEW NOTE alert |
Company Profile |
SEC
News |
Chart |
Request a new note
C
A
S
I |
OLLI
-
NASDAQ
Ollie's Bargain Outlet
Retail-DiscountandVariety
|
$87.97
|
+2.94
3.46% |
$88.67
|
679,692
105.05% of 50 DAV
50 DAV is 647,000
|
$97.61
-9.88%
|
7/12/2018
|
$74.43
|
PP = $77.60
|
|
MB = $81.48
|
Most Recent Note - 10/12/2018 6:07:39 PM
G - Halted its slide at its 50 DMA line ($85.09) with a gain today on average volume after volume-driven losses this week. The 50 DMA line defines near-term support well above prior highs in the $77 area. Fundamentals remain strong.
>>> FEATURED STOCK ARTICLE : Encountered Distributional Pressure After a Great Rally - 10/9/2018 |
View all notes |
Set NEW NOTE alert |
Company Profile |
SEC
News |
Chart |
Request a new note
C
A
S
I |
|
|
|
THESE ARE NOT BUY RECOMMENDATIONS!
Comments contained in the body of this report are technical
opinions only. The material herein has been obtained
from sources believed to be reliable and accurate, however,
its accuracy and completeness cannot be guaranteed.
This site is not an investment advisor, hence it does
not endorse or recommend any securities or other investments.
Any recommendation contained in this report may not
be suitable for all investors and it is not to be deemed
an offer or solicitation on our part with respect to
the purchase or sale of any securities. All trademarks,
service marks and trade names appearing in this report
are the property of their respective owners, and are
likewise used for identification purposes only.
This report is a service available
only to active Paid Premium Members.
You may opt-out of receiving report notifications
at any time. Questions or comments may be submitted
by writing to Premium Membership Services 665 S.E. 10 Street, Suite 201 Deerfield Beach, FL 33441-5634 or by calling 1-800-965-8307
or 954-785-1121.
|
|
|