You are not logged in.
This means you
CAN ONLY VIEW reports that were published prior to Sunday, February 18, 2024.
You
MUST UPGRADE YOUR MEMBERSHIP if you want to see any current reports.
AFTER MARKET UPDATE - THURSDAY, OCTOBER 10TH, 2019
Previous After Market Report Next After Market Report >>>
|
|
|
|
DOW |
+150.66 |
26,496.67 |
+0.57% |
|
Volume |
800,398,600 |
+22% |
|
Volume |
1,760,529,940 |
+16% |
|
NASDAQ |
+47.04 |
7,950.78 |
+0.60% |
|
Advancers |
1,754 |
62% |
|
Advancers |
1,733 |
57% |
|
S&P 500 |
+18.73 |
2,938.13 |
+0.64% |
|
Decliners |
1,071 |
38% |
|
Decliners |
1,331 |
43% |
|
Russell 2000 |
+5.90 |
1,485.36 |
+0.40% |
|
52 Wk Highs |
49 |
|
|
52 Wk Highs |
31 |
|
|
S&P 600 |
+2.19 |
918.36 |
+0.24% |
|
52 Wk Lows |
42 |
|
|
52 Wk Lows |
126 |
|
|
 |
Major Indices Rose But With Less Leadership
Kenneth J. Gruneisen - Passed the CAN SLIM® Master's Exam
The Dow added 150 points, while the S&P 500 and Nasdaq Composite both gained 0.6%. Volume totals reported were higher than the prior session totals on the Nasdaq exchange and on the NYSE, revealing an increase in institutional buying demand. Breadth was positive as advancers led decliners by a 3-2 margin on the NYSE and by 8-7 on the Nasdaq exchange. There were only 9 high-ranked companies from the Leaders List that hit a new 52-week high and were listed on the BreakOuts Page, versus the total of 12 on the prior session. New 52-week highs outnumbered new 52-week lows on the NYSE, but new lows outnumbered new highs on the Nasdaq exchange. The uptrend for the major indices (M criteria) has recently come under greater pressure, having the look of a more serious correction. Disciplined investors know to reduce exposure to stocks during market corrections. The Featured Stocks Page provides the most timely analysis on high-ranked leaders. Charts used courtesy of www.stockcharts.com
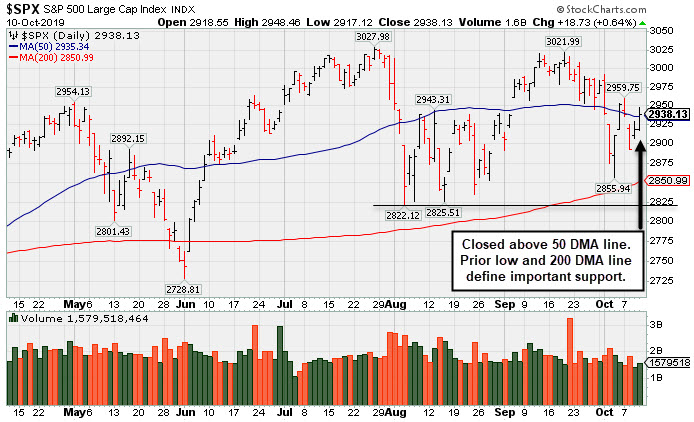
PICTURED: The S&P 500 Index rebounded and closed above its 50-day moving average (DMA) line again, leaving it perched only -2.9% off its record high. Prior lows and its 200 DMA line define important near-term support to watch. More damaging losses may bode poorly for the market outlook.
Stocks finish higher Thursday, as investors became more optimistic about recent trade developments. High level negotiations between the U.S. and China took place in Washington today, although reports indicated this week’s mid-level talks had not resulted in any progress on key issues. However, investor sentiment was boosted after President Trump confirmed a meeting with Chinese Vice Premier Liu He on Friday. Reports indicated possible progress with the White House considering rolling out a previously agreed upon currency pact that would suspend planned tariff increases next week.
Ten of 11 S&P sectors ended the day in positive territory, with Energy outperforming as WTI crude jumped 2.1% to $53.70/barrel. Elsewhere, Financials rose more than 1.0% after an uptick in yields. In corporate news, Delta Air Lines (DAL -1.52%) after its quarterly revenue missed analyst forecasts. Costco (COST +0.08%) was quiet even after the retailer’s comparable-store sales figure came in above expectations. Netflix (NFLX +4.84%) rose after a Wall Street analyst was positive on the streaming giants ability to grow despite increased competition.
On the data front, consumer prices were flat in September, the weakest reading since January. However, the annualized core CPI remained steady at a one-year high of 2.4%. Separately, initial jobless claims came in at 210,000, the lowest in three weeks. Treasuries weakened with the yield on the 10-year note adding eight basis points to 1.66%. In commodities, COMEX gold lost 0.8% to $1,494.80/ounce.
|
 Kenneth J. Gruneisen started out as a licensed stockbroker in August 1987, a couple of months prior to the historic stock market crash that took the Dow Jones Industrial Average down -22.6% in a single day. He has published daily fact-based fundamental and technical analysis on high-ranked stocks online for two decades. Through FACTBASEDINVESTING.COM, Kenneth provides educational articles, news, market commentary, and other information regarding proven investment systems that work in good times and bad.
Comments contained in the body of this report are technical opinions only and are not necessarily those of Gruneisen Growth Corp. The material herein has been obtained from sources believed to be reliable and accurate, however, its accuracy and completeness cannot be guaranteed. Our firm, employees, and customers may effect transactions, including transactions contrary to any recommendation herein, or have positions in the securities mentioned herein or options with respect thereto. Any recommendation contained in this report may not be suitable for all investors and it is not to be deemed an offer or solicitation on our part with respect to the purchase or sale of any securities. |
|
 |
Financial, Retail, Tech and Commodity-Linked Groups Rose
Kenneth J. Gruneisen - Passed the CAN SLIM® Master's Exam
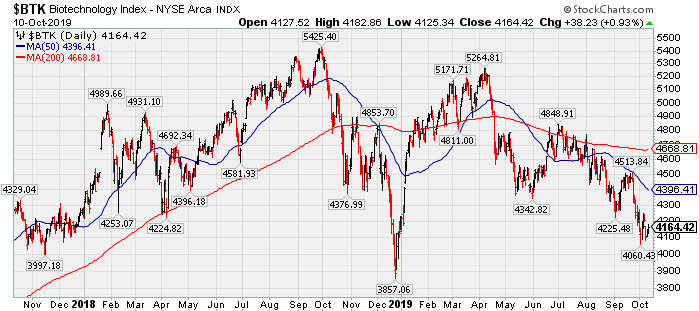
The Broker/Dealer Index ($XBD +1.33%) and the Bank Index ($BKX +1.50%) both outpaced the Retail Index ($RLX +0.60%). The tech sector had a positive bias as the Semiconductor Index ($SOX +0.97%) and the Biotech Index ($BTK +0.93%) rose while the Networking Index ($NWX -0.03) finished flat. Commodity-linked groups had a positive bias as the Oil Services Index ($OSX +1.77%) and Integrated Oil Index ($XOI +1.56%) both outpaced the Gold & Silver Index ($XAU +0.72%).
PICTURED: The 2-year graph of the Biotech Index ($BTK +0.93%) shows it recently slumping toward its December 2018 low.
| Oil Services |
$OSX |
62.42 |
+1.09 |
+1.78% |
-22.56% |
| Integrated Oil |
$XOI |
1,183.68 |
+18.20 |
+1.56% |
+2.12% |
| Semiconductor |
$SOX |
1,555.79 |
+14.94 |
+0.97% |
+34.68% |
| Networking |
$NWX |
540.83 |
-0.18 |
-0.03% |
+10.67% |
| Broker/Dealer |
$XBD |
248.87 |
+3.25 |
+1.33% |
+4.86% |
| Retail |
$RLX |
2,335.88 |
+14.00 |
+0.60% |
+19.70% |
| Gold & Silver |
$XAU |
92.13 |
+0.67 |
+0.73% |
+30.38% |
| Bank |
$BKX |
96.79 |
+1.43 |
+1.50% |
+12.82% |
| Biotech |
$BTK |
4,164.42 |
+38.23 |
+0.93% |
-1.34% |
|
|
|
 |
Rebound Above 50-Day Average Needed for Outlook to Improve
Kenneth J. Gruneisen - Passed the CAN SLIM® Master's Exam
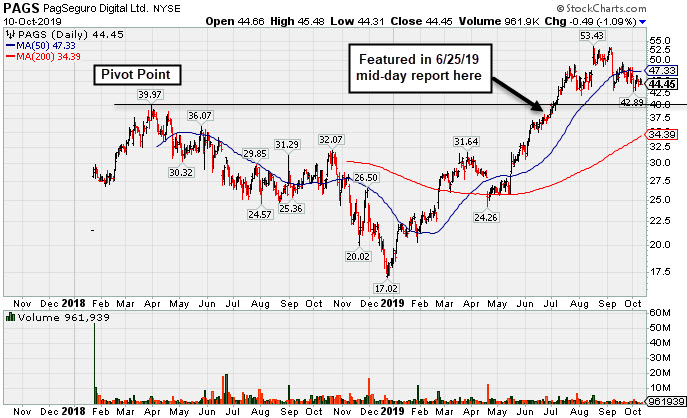
Pagseguro Digital Cl A (PAGS -0.49 or -1.09% to $44.45 ) has been sputtering below its 50-day moving average (DMA) line ($47.337) which recently acted as resistance. A convincing rebound above the 50 DMA line would help its outlook, however, it faces some additional near-term resistance due to overhead supply up to the $53 level. Meanwhile, the prior lows in the $42-43 area define very important support where violations may trigger more worrisome technical sell signals.
Fundamentals are strong. Bullish action came with on 8/16/19 with a gap up after it reported earnings +35% on +39% sales revenues for the quarter ended June 30,2019 versus the year ago period. That showed a strong sales revenues increase while continuing its strong track record of quarterly comparisons with earnings increases above the +25% minimum guideline (C criteria).It has a 98 Earnings Per Share Rating. The limited history for this Brazil-based firm was noted as a concern. It completed its $21.50 IPO on 1/24/18.
PAGS traded up as much as +41.9% since first highlighted in yellow with pivot point cited based on its 3/29/18 high plus 10 cents in the 6/25/19 mid-day report (read here). It showed resilience after last shown in this FSU section on 9/25/19 with an annotated graph under the headline, "Recent Lows Define Important Near-Term Support While Consolidating".
The number of top-rated funds owning its shares rose from 254 in Sep '18 to 401 in Sep '19, a reassuring sign concerning the I criteria. Its current Up/Down Volume Ratio of 1.0 is an unbiased indication its shares have been neutral concerning accumulation/distributional pressure over the past 50 days. It has earned a Timeliness Rating of B and Sponsorship Rating of B.
|
|
|
Color Codes Explained :
Y - Better candidates highlighted by our
staff of experts.
G - Previously featured
in past reports as yellow but may no longer be buyable under the
guidelines.
***Last / Change / Volume data in this table is the closing quote data***
Symbol/Exchange
Company Name
Industry Group |
PRICE |
CHANGE
(%Change) |
Day High |
Volume
(% DAV)
(% 50 day avg vol) |
52 Wk Hi
% From Hi |
Featured
Date |
Price
Featured |
Pivot Featured |
|
Max Buy |
 MLR
-
NYSE
MLR
-
NYSE
Miller Industries Inc
AUTOMOTIVE - Auto Parts
|
$31.57
|
+0.32
1.02% |
$31.73
|
16,178
47.58% of 50 DAV
50 DAV is 34,000
|
$35.26
-10.47%
|
9/24/2019
|
$34.00
|
PP = $35.36
|
|
MB = $37.13
|
Most Recent Note - 10/9/2019 5:47:46 PM
G - Halted its slide at its 200 DMA line today following a streak of 9 consecutive losses. A rebound above its 50 DMA line ($32.24) is needed for its outlook to improve. Subsequent gains above the pivot point backed by at least +40% above average volume may trigger a technical buy signal. Fundamentals remain strong. See the latest FSU analysis for more details and a new annotated graph.
>>> FEATURED STOCK ARTICLE : Tested Support at Long-Term 200-Day Moving Average - 10/9/2019 |
View all notes |
Set NEW NOTE alert |
Company Profile |
SEC
News |
Chart |
Request a new note
C
A
S
I |
CCBG
-
NASDAQ
Capital City Bk Gp
BANKING - Regional - Mid-Atlantic Banks
|
$26.60
|
-0.02
-0.08% |
$26.81
|
26,152
96.86% of 50 DAV
50 DAV is 27,000
|
$28.00
-5.00%
|
9/13/2019
|
$27.03
|
PP = $27.05
|
|
MB = $28.40
|
Most Recent Note - 10/9/2019 5:50:33 PM
Y - Posted a small gain on light volume today while still hovering near its 52-week high. Prior highs define initial support to watch above its 50 DMA line ($25.50).
>>> FEATURED STOCK ARTICLE : Stalled After Recent Rally for New High - 9/27/2019 |
View all notes |
Set NEW NOTE alert |
Company Profile |
SEC
News |
Chart |
Request a new note
C
A
S
I |
EPAM
-
NYSE
Epam Systems Inc
COMPUTER SOFTWARE and SERVICES - Information Technology Service
|
$184.44
|
-1.39
-0.75% |
$186.80
|
181,715
50.90% of 50 DAV
50 DAV is 357,000
|
$201.00
-8.24%
|
5/9/2019
|
$169.25
|
PP = $180.55
|
|
MB = $189.58
|
Most Recent Note - 10/8/2019 5:52:43 PM
G - Slumped back below its 50 DMA line ($186.83) again hurting its outlook. Faces resistance due to overhead supply up to the $201 level. Prior lows in the $174-175 area define the next important support level. Reported earnings +27% on +24% sales revenues for the Jun '19 quarter.
>>> FEATURED STOCK ARTICLE : Slumped and Sputtered Below 50-Day Moving Average - 9/30/2019 |
View all notes |
Set NEW NOTE alert |
Company Profile |
SEC
News |
Chart |
Request a new note
C
A
S
I |
AUDC
-
NASDAQ
Audiocodes Ltd
ELECTRONICS - Scientific and Technical Instrum
|
$17.87
|
+0.13
0.73% |
$18.18
|
166,852
82.19% of 50 DAV
50 DAV is 203,000
|
$22.50
-20.58%
|
9/13/2019
|
$19.68
|
PP = $19.84
|
|
MB = $20.83
|
Most Recent Note - 10/8/2019 5:49:16 PM
G - Color code is changed to green after slumping back below its 50 DMA line ($18.51) again. Prior lows in the $16.50 area define the next important support.
>>> FEATURED STOCK ARTICLE : Sank Below 50-Day Average as 7 Straight Losses Follow Reversal - 10/2/2019 |
View all notes |
Set NEW NOTE alert |
Company Profile |
SEC
News |
Chart |
Request a new note
C
A
S
I |
CHDN
-
NASDAQ
Churchill Downs Inc
LEISURE - Gaming Activities
|
$129.47
|
-0.61
-0.47% |
$130.97
|
254,813
107.97% of 50 DAV
50 DAV is 236,000
|
$132.73
-2.46%
|
10/8/2019
|
$129.77
|
PP = $132.83
|
|
MB = $139.47
|
Most Recent Note - 10/9/2019 12:41:28 PM
Y - Posted a 4th consecutive gain with higher volume on the prior session and finished at a record high close. Color code was changed to yellow with new pivot point cited based on its 8/01/19 high plus 10 cents. Subsequent gains above the pivot point backed by at least +40% above average volume may trigger a new (or add-on) technical buy signal. Its 50 DMA line ($122.63) acted as support in recent weeks during its consolidation. Jun '19 earnings +10% on +26% sales revenues versus the year ago period were below the +25% minimum earnings guideline (C criteria), noted recently raising fundamental concerns. See the latest FSU analysis for more details and an annotated graph.
>>> FEATURED STOCK ARTICLE : Volume-Driven Gain for Record High Close - 10/8/2019 |
View all notes |
Set NEW NOTE alert |
Company Profile |
SEC
News |
Chart |
Request a new note
C
A
S
I |
Symbol/Exchange
Company Name
Industry Group |
PRICE |
CHANGE
(%Change) |
Day High |
Volume
(% DAV)
(% 50 day avg vol) |
52 Wk Hi
% From Hi |
Featured
Date |
Price
Featured |
Pivot Featured |
|
Max Buy |
LULU
-
NASDAQ
Lululemon Athletica
MANUFACTURING - Textile Manufacturing
|
$198.13
|
+5.97
3.11% |
$198.22
|
2,435,423
135.83% of 50 DAV
50 DAV is 1,793,000
|
$204.44
-3.09%
|
9/6/2019
|
$201.25
|
PP = $194.35
|
|
MB = $204.07
|
 Most Recent Note - 10/10/2019 5:36:29 PM
Y - Finished near the session high with a solid volume-driven gain today. Found support at its 50 DMA line ($187.37) recently. More damaging losses would raise serious concerns and trigger a technical sell signal.
>>> FEATURED STOCK ARTICLE : Found Support After Undercutting 50-Day Moving Average - 10/3/2019 |
View all notes |
Set NEW NOTE alert |
Company Profile |
SEC
News |
Chart |
Request a new note
C
A
S
I |
CPRT
-
NASDAQ
Copart Inc
SPECIALTY RETAIL - Auto Dealerships
|
$81.06
|
+0.58
0.71% |
$81.74
|
1,033,019
69.99% of 50 DAV
50 DAV is 1,476,000
|
$83.70
-3.16%
|
9/5/2019
|
$79.13
|
PP = $79.84
|
|
MB = $83.83
|
Most Recent Note - 10/9/2019 5:52:19 PM
Y - Color code is changed to yellow after finding support above its 50 DMA line ($78.16) and trading back above its pivot point helping its outlook improve.
>>> FEATURED STOCK ARTICLE : Found Prompt Support Near 50-Day Moving Average - 10/4/2019 |
View all notes |
Set NEW NOTE alert |
Company Profile |
SEC
News |
Chart |
Request a new note
C
A
S
I |
PFPT
-
NASDAQ
Proofpoint Inc
Computer Sftwr-Security
|
$126.74
|
-0.54
-0.42% |
$128.00
|
528,783
75.00% of 50 DAV
50 DAV is 705,000
|
$133.00
-4.71%
|
10/1/2019
|
$129.59
|
PP = $132.95
|
|
MB = $139.60
|
Most Recent Note - 10/8/2019 5:51:10 PM
Y - Retreated from its all-time high with another volume-driven loss today. Its 50 DMA line ($121.91) defines near-term support. Met stubborn resistance in the $132 area in recent months. Subsequent gains above the pivot point backed by at least +40% above average volume may trigger a technical buy signal.
>>> FEATURED STOCK ARTICLE : Challenging Previously Stubborn Resistance - 10/1/2019 |
View all notes |
Set NEW NOTE alert |
Company Profile |
SEC
News |
Chart |
Request a new note
C
A
S
I |
BLD
-
NYSE
Topbuild Corp
Bldg-Constr Prds/Misc
|
$96.78
|
-0.87
-0.89% |
$97.95
|
174,544
59.17% of 50 DAV
50 DAV is 295,000
|
$97.99
-1.23%
|
5/17/2019
|
$82.19
|
PP = $87.31
|
|
MB = $91.68
|
Most Recent Note - 10/9/2019 5:49:29 PM
G - Posted a quiet gain today for a best-ever close. Stayed above its 50 DMA line, and challenging its all-time high, it is extended from the prior base after wedging higher with gains lacking great volume conviction. Earnings rose +39% on +9% sales revenues for the Jun '19 quarter versus the year ago period. Its 50 DMA line ($92.186) defines important support to watch along with its prior low ($86.53 on 8/28/19).
>>> FEATURED STOCK ARTICLE : Near High After Finding Support at 50-Day Average - 10/7/2019 |
View all notes |
Set NEW NOTE alert |
Company Profile |
SEC
News |
Chart |
Request a new note
C
A
S
I |
PAGS
-
NYSE
Pagseguro Digital Cl A
Finance-CrdtCard/PmtPr
|
$44.45
|
-0.49
-1.09% |
$45.48
|
958,808
56.97% of 50 DAV
50 DAV is 1,683,000
|
$53.43
-16.81%
|
6/25/2019
|
$37.69
|
PP = $40.07
|
|
MB = $42.07
|
Most Recent Note - 10/10/2019 5:34:54 PM
G - A rebound above the 50 DMA line ($47.33) still is needed for its outlook to improve. Recently testing prior lows in the $42-43 area noted as important near-term chart support to watch where violations may trigger a worrisome technical sell signal. See the latest FSU analysis for more details and a new annotated graph.
>>> FEATURED STOCK ARTICLE : Rebound Above 50-Day Average Needed for Outlook to Improve - 10/10/2019 |
View all notes |
Set NEW NOTE alert |
Company Profile |
SEC
News |
Chart |
Request a new note
C
A
S
I |
Symbol/Exchange
Company Name
Industry Group |
PRICE |
CHANGE
(%Change) |
Day High |
Volume
(% DAV)
(% 50 day avg vol) |
52 Wk Hi
% From Hi |
Featured
Date |
Price
Featured |
Pivot Featured |
|
Max Buy |
|
|
|
THESE ARE NOT BUY RECOMMENDATIONS!
Comments contained in the body of this report are technical
opinions only. The material herein has been obtained
from sources believed to be reliable and accurate, however,
its accuracy and completeness cannot be guaranteed.
This site is not an investment advisor, hence it does
not endorse or recommend any securities or other investments.
Any recommendation contained in this report may not
be suitable for all investors and it is not to be deemed
an offer or solicitation on our part with respect to
the purchase or sale of any securities. All trademarks,
service marks and trade names appearing in this report
are the property of their respective owners, and are
likewise used for identification purposes only.
This report is a service available
only to active Paid Premium Members.
You may opt-out of receiving report notifications
at any time. Questions or comments may be submitted
by writing to Premium Membership Services 665 S.E. 10 Street, Suite 201 Deerfield Beach, FL 33441-5634 or by calling 1-800-965-8307
or 954-785-1121.
|
|
|