You are not logged in.
This means you
CAN ONLY VIEW reports that were published prior to Saturday, February 24, 2024.
You
MUST UPGRADE YOUR MEMBERSHIP if you want to see any current reports.
AFTER MARKET UPDATE - FRIDAY, OCTOBER 9TH, 2020
Previous After Market Report Next After Market Report >>>
|
|
|
|
DOW |
+161.39 |
28,586.90 |
+0.57% |
|
Volume |
851,343,798 |
+7% |
|
Volume |
3,471,374,500 |
+0% |
|
NASDAQ |
+158.93 |
11,579.91 |
+1.39% |
|
Advancers |
1,526 |
51% |
|
Advancers |
1,945 |
57% |
|
S&P 500 |
+30.30 |
3,477.13 |
+0.88% |
|
Decliners |
1,458 |
49% |
|
Decliners |
1,461 |
43% |
|
Russell 2000 |
+9.00 |
1,637.55 |
+0.55% |
|
52 Wk Highs |
179 |
|
|
52 Wk Highs |
202 |
|
|
S&P 600 |
+4.12 |
926.19 |
+0.45% |
|
52 Wk Lows |
17 |
|
|
52 Wk Lows |
18 |
|
|
The major indices have shown improvement and have resumed a market uptrend as leadership has improved. Disciplined investors carefully may buy leading stocks on a case-by-case basis. Always remain ready to reduce market exposure in the event of any more substantial market downdrafts.
|
 |
Leadership Improved as Indices Rose and Closed a Very Strong Week
Kenneth J. Gruneisen - Passed the CAN SLIM® Master's Exam
The Dow jumped 161 points, extending its weekly climb to 3.3%. The S&P 500 rose 0.9%, notching its second consecutive weekly advance with a 3.8% gain. The Nasdaq Composite rallied 1.4% for the day and 4.6% for the week. The reported volume totals were higher than the prior session on the NYSE and on the Nasdaq exchange. Breadth was slightly positive as advancers led decliners by a narrow margin on the NYSE and 5-4 on the Nasdaq exchange. There were 106 high-ranked companies from the Leaders List that hit new 52-week highs and were listed on the BreakOuts Page, versus the total of 90 on the prior session. New 52-week highs totals expanded again and easily outnumbered new 52-week lows totals on the NYSE and on the Nasdaq exchange. The major indices are in a confirmed uptrend (M criteria). New buying efforts may be justified in leading stocks on a case-by-case basis.
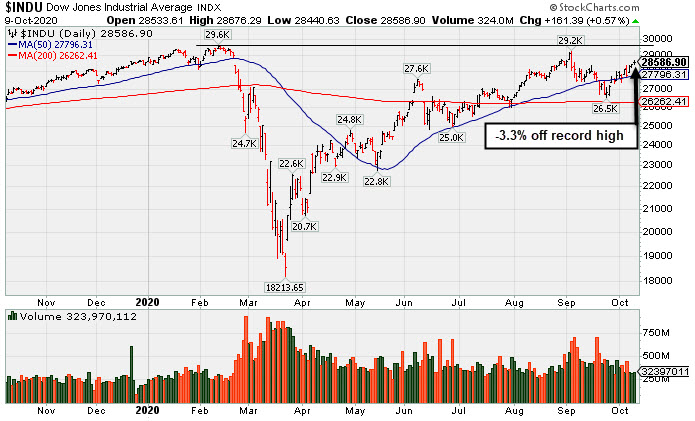 PICTURED: The Dow Jones Industrial Average is consolidating above its 50-day moving average (DMA) lines and -3.3% off its record high.
Stocks ended higher on Friday as market participants digested fiscal stimulus developments, and upbeat corporate news provided a boost to investor sentiment. The White House said they were working on a $1.8 trillion package, up from its previous $1.6 trillion proposal. This followed earlier optimism that stemmed from a phone conversation between House Speaker Nancy Pelosi and Treasury Secretary Steven Mnuchin which mentioned “prospects of an imminent agreement” for fiscal aid.
Eight of 11 S&P 500 sectors finished in positive territory with the Information Technology and Consumer Discretionary stocks leading the advance. In corporate news, Xilinx (XLNX +14.11%) rallied after reports indicated Advanced Micro Devices (AMD -3.94%) was looking to acquire the specialty chipmaker. Elsewhere, NXP Semiconductors (NXPI +4.97%) rose after raising profit outlook amid “material” improvement in demand. Gilead Sciences (GILD +0.82%) rose following positive data from its COVID-19 anti-viral treatment, remdesivir, which showed a reduction in recovery time by five days compared to patients who were given a placebo.
On the data front, the lone update showed wholesale inventories rose by 0.4% in August, slightly lower from the prior reading of 0.5%. Treasuries modestly weakened, with the yield on the benchmark 10-year note up one basis points to 0.77%. In commodities, WTI crude fell 1.6% to $40.53/barrel, paring its weekly advance to 9%. COMEX gold jumped 2.1% to $1929.10/ounce amid a weaker dollar. |
 Kenneth J. Gruneisen started out as a licensed stockbroker in August 1987, a couple of months prior to the historic stock market crash that took the Dow Jones Industrial Average down -22.6% in a single day. He has published daily fact-based fundamental and technical analysis on high-ranked stocks online for two decades. Through FACTBASEDINVESTING.COM, Kenneth provides educational articles, news, market commentary, and other information regarding proven investment systems that work in good times and bad.
Comments contained in the body of this report are technical opinions only and are not necessarily those of Gruneisen Growth Corp. The material herein has been obtained from sources believed to be reliable and accurate, however, its accuracy and completeness cannot be guaranteed. Our firm, employees, and customers may effect transactions, including transactions contrary to any recommendation herein, or have positions in the securities mentioned herein or options with respect thereto. Any recommendation contained in this report may not be suitable for all investors and it is not to be deemed an offer or solicitation on our part with respect to the purchase or sale of any securities. |
|
 |
Gold & Silver, Retail, Semiconductor, and Networking Indexes Rose
Kenneth J. Gruneisen - Passed the CAN SLIM® Master's Exam
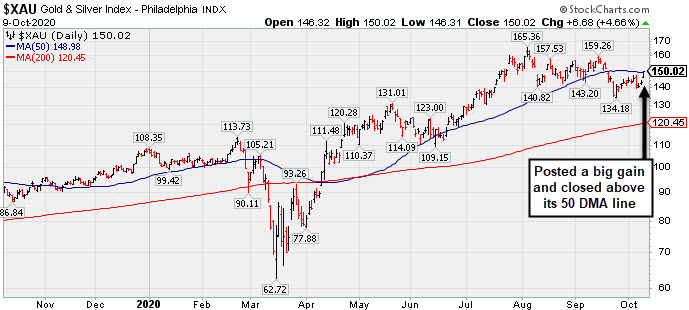
The Retail Index ($RLX +2.08%) posted a solid gain to underpin the major indices while the Broker/Dealer Index ($XBD +0.03%) finished flat and the Bank Index ($BKX -0.33%) edged lower. The Semiconductor Index ($SOX +1.75%) and Networking Index ($NWX +1.30%) both notched solid gains while the Biotech Index ($BTK +0.38%) edged higher. The Oil Services Index ($OSX -1.86%) and Integrated Oil Index ($XOI -1.08%) both pulled back. PICTURED: The Gold & Silver Index ($XAU +4.66%) posted a standout gain as it rebounded to close above its 50-day moving average (DMA) line.
| Oil Services |
$OSX |
29.50 |
-0.56 |
-1.86% |
-62.33% |
| Integrated Oil |
$XOI |
621.73 |
-6.80 |
-1.08% |
-51.07% |
| Semiconductor |
$SOX |
2,397.29 |
+41.13 |
+1.75% |
+29.61% |
| Networking |
$NWX |
572.06 |
+7.34 |
+1.30% |
-1.95% |
| Broker/Dealer |
$XBD |
296.46 |
+0.09 |
+0.03% |
+2.09% |
| Retail |
$RLX |
3,548.26 |
+72.34 |
+2.08% |
+44.87% |
| Gold & Silver |
$XAU |
150.02 |
+6.68 |
+4.66% |
+40.31% |
| Bank |
$BKX |
79.55 |
-0.27 |
-0.33% |
-29.82% |
| Biotech |
$BTK |
5,585.63 |
+21.42 |
+0.38% |
+10.23% |
|
|
|
 |
New Record High for Charles River Labs
Kenneth J. Gruneisen - Passed the CAN SLIM® Master's Exam
Charles River Labs Intl (CRL +$6.08 or +2.57% to $242.57) posted a big gain with +22% above average volume today for a new all-time high. During its recent consolidations it found prompt support at its 50-day moving average (DMA) line ($218.54) where any subsequent violation would raise concerns and trigger a technical sell signal.
Fundamental concerns were raised when it reported Jun '20 quarterly earnings -3% on +4% sales revenues, below the +25% minimum guideline (C criteria), but the results were better than expected and the company also raised its guidance. It now has a 92 Earnings Per Share Rating, down from 96 prior to the report. The 2 prior quarterly earnings increases were above the +25% minimum guideline (C criteria) of the fact-based investment system. Annual earnings (A criteria) history has been strong and steady.
It hails from the Medical - Research Equipment/Services industry group which has an 65 Group Relative Strength Rating (L criteria). The number of top-rated funds owning its shares rose from 681 in Dec '19 to 771 in Jun '20, and its Up/Down Volume Ratio is 0.9 is an unbiased indication its shares have been under slight distributional pressure over the past 50 days. There is a small number of only 49.7 million shares (S criteria) outstanding, which can contribute to greater price volatility in the event of institutional buying or selling.
|
|
|
Color Codes Explained :
Y - Better candidates highlighted by our
staff of experts.
G - Previously featured
in past reports as yellow but may no longer be buyable under the
guidelines.
***Last / Change / Volume data in this table is the closing quote data***
Symbol/Exchange
Company Name
Industry Group |
PRICE |
CHANGE
(%Change) |
Day High |
Volume
(% DAV)
(% 50 day avg vol) |
52 Wk Hi
% From Hi |
Featured
Date |
Price
Featured |
Pivot Featured |
|
Max Buy |
 ADBE
-
NASDAQ
ADBE
-
NASDAQ
Adobe Inc
COMPUTER SOFTWARE and SERVICES - Application Software
|
$502.16
|
+11.32
2.31% |
$502.17
|
1,852,007
59.57% of 50 DAV
50 DAV is 3,109,000
|
$536.88
-6.47%
|
9/10/2020
|
$488.46
|
PP = $536.88
|
|
MB = $563.72
|
Most Recent Note - 10/8/2020 5:30:25 PM
G - Volume totals have been cooling while consolidating above its 50 DMA line ($477). More damaging losses below the 50 DMA would raise greater concerns. Faces near-term resistance due to overhead supply up to the $536 level. Fundamentals remain strong. See the latest FSU analysis for more details and a new annotated graph.
>>> FEATURED STOCK ARTICLE : Showed Resilience Near 50-Day Moving Average - 10/8/2020 |
View all notes |
Set NEW NOTE alert |
Company Profile |
SEC
News |
Chart |
Request a new note
C
A
S
I |
CRL
-
NYSE
Charles River Labs Intl
DRUGS - Biotechnology
|
$242.57
|
+6.08
2.57% |
$243.46
|
391,544
122.36% of 50 DAV
50 DAV is 320,000
|
$238.63
1.65%
|
7/15/2020
|
$192.66
|
PP = $189.95
|
|
MB = $199.45
|
 Most Recent Note - 10/9/2020 6:06:29 PM
G - Posted a big gain with +22% above average volume today for a new all-time high. Its 50 DMA line ($218) defines support where any subsequent violation would raise concerns and trigger a technical sell signal. Raised fundamental concerns when it recently reported Jun '20 quarterly earnings -3% on +4% sales revenues, below the +25% minimum guideline (C criteria). See the latest FSU analysis for more details and a new annotated graph.
>>> FEATURED STOCK ARTICLE : New Record High for Charles River Labs - 10/9/2020 |
View all notes |
Set NEW NOTE alert |
Company Profile |
SEC
News |
Chart |
Request a new note
C
A
S
I |
AMD
-
NASDAQ
Advanced Micro Devices
ELECTRONICS - Semiconductor - Broad Line
|
$83.10
|
-3.41
-3.94% |
$85.75
|
80,129,593
140.91% of 50 DAV
50 DAV is 56,865,000
|
$94.28
-11.86%
|
8/31/2020
|
$90.42
|
PP = $87.39
|
|
MB = $91.76
|
Most Recent Note - 10/9/2020 6:08:45 PM
G - Pulled back today with above average volume as the company reportedly was considering buying Xilinx Inc (XLNX). Recently found support near its 50 DMA line ($81.96). Any deterioration below the 50 DMA line and the recent low ($73.85 on 9/18/20) would raise greater concerns and trigger more worrisome technical sell signals. It has not formed a sound base of sufficient length and faces some resistance due to overhead supply up to the $94 level. Fundamentals remain strong.
>>> FEATURED STOCK ARTICLE : Rebound Above 50-Day Average With Light Volume Helped Stance - 9/28/2020 |
View all notes |
Set NEW NOTE alert |
Company Profile |
SEC
News |
Chart |
Request a new note
C
A
S
I |
TREX
-
NYSE
Trex Company Inc
MATERIALS and CONSTRUCTION - General Building Materials
|
$78.22
|
+1.89
2.48% |
$79.19
|
359,634
37.66% of 50 DAV
50 DAV is 955,000
|
$78.61
-0.50%
|
6/26/2020
|
$54.53
|
PP = $66.47
|
|
MB = $69.79
|
Most Recent Note - 10/9/2020 6:13:12 PM
G - Posted a gain today with below average volume for a new all-time high, however it did not form a sound base pattern. Any losses below the 50 DMA line ($71.53) or recent low ($63.32 on 9/21/20) would raise concerns and trigger technical sell signals. Do not be confused by the 2:1 share split effective 9/15/20 (Featured Price, Pivot Point, and Max Buy prices have been adjusted accordingly). Fundamentals remain strong.
>>> FEATURED STOCK ARTICLE : TREX Rebounded Above 50-Day Moving Average - 9/30/2020 |
View all notes |
Set NEW NOTE alert |
Company Profile |
SEC
News |
Chart |
Request a new note
C
A
S
I |
NFLX
-
NASDAQ
Netflix Inc
SPECIALTY RETAIL - Music and Video Stores
|
$539.44
|
+7.65
1.44% |
$544.28
|
4,775,327
84.22% of 50 DAV
50 DAV is 5,670,000
|
$575.37
-6.24%
|
9/1/2020
|
$547.45
|
PP = $575.47
|
|
MB = $604.24
|
Most Recent Note - 10/7/2020 12:51:25 PM
G - Rebounding toward its prior high ($557 on 9/01/20) which may act as resistance. Consolidating above its 50 DMA line ($498) and above the recent low ($458.60 on 9/18/20). Those levels define important near term support where any further deterioration would raise more serious concerns and trigger technical sell signals.
>>> FEATURED STOCK ARTICLE : Quiet Rebound Meeting Resistance at 50-Day Moving Average - 9/29/2020 |
View all notes |
Set NEW NOTE alert |
Company Profile |
SEC
News |
Chart |
Request a new note
C
A
S
I |
Symbol/Exchange
Company Name
Industry Group |
PRICE |
CHANGE
(%Change) |
Day High |
Volume
(% DAV)
(% 50 day avg vol) |
52 Wk Hi
% From Hi |
Featured
Date |
Price
Featured |
Pivot Featured |
|
Max Buy |
LGIH
-
NASDAQ
L G I Homes Inc
Bldg-Resident/Comml
|
$126.26
|
+1.98
1.59% |
$130.09
|
192,575
65.50% of 50 DAV
50 DAV is 294,000
|
$131.95
-4.31%
|
10/1/2020
|
$123.17
|
PP = $124.04
|
|
MB = $130.24
|
Most Recent Note - 10/6/2020 9:07:12 PM
Y - Pulled back today after 4 consecutive gains into new high territory. Color code was recently changed to yellow with new pivot point cited based on its 8/04/20 high plus 10 cents. Subsequent gains above the pivot point backed by at least +40% above average volume are still needed to trigger a new (or add-on) technical buy signal. Recent rebound above its 50 DMA line ($113.76) helped its outlook to improve. Any losses below the 50 DMA line and latest low ($101.30 on 9/21/20) would raise greater concerns and trigger worrisome technical sell signals. Reported Jun '20 quarterly earnings +21% on +4% sales revenues, breaking a streak of 4 comparisons above the +25% minimum guideline (C criteria).
>>> FEATURED STOCK ARTICLE : New Base Formed by Strong Homebuilder - 10/1/2020 |
View all notes |
Set NEW NOTE alert |
Company Profile |
SEC
News |
Chart |
Request a new note
C
A
S
I |
NOW
-
NYSE
Servicenow Inc
Computer Sftwr-Enterprse
|
$508.61
|
+12.11
2.44% |
$510.88
|
1,192,849
76.17% of 50 DAV
50 DAV is 1,566,000
|
$505.00
0.71%
|
8/20/2020
|
$453.34
|
PP = $454.79
|
|
MB = $477.53
|
Most Recent Note - 10/9/2020 6:10:11 PM
G - Posted a gain today with below average volume for another new all-time high. Found support at its 50 DMA line ($462.51) but did not form a new base of sufficient length. Fundamentals remain strong. Any losses below the 50 DMA line and prior low ($432.85 on 9/08/20) would raise concerns and trigger technical sell signals.
>>> FEATURED STOCK ARTICLE : Gain Back Above "Max Buy" Level for ServiceNow - 9/25/2020 |
View all notes |
Set NEW NOTE alert |
Company Profile |
SEC
News |
Chart |
Request a new note
C
A
S
I |
VEEV
-
NYSE
Veeva Systems Inc Cl A
Computer Sftwr-Medical
|
$294.12
|
+3.37
1.16% |
$297.06
|
512,513
65.29% of 50 DAV
50 DAV is 785,000
|
$298.76
-1.55%
|
10/6/2020
|
$287.71
|
PP = $298.86
|
|
MB = $313.80
|
Most Recent Note - 10/6/2020 9:05:42 PM
Y - Color code was changed to yellow with new pivot point cited based on its 9/02/20 high plus 10 cents. Found support at its its 50 DMA line ($269.66) while forming a 5-week flat base. Subsequent gains above the pivot point backed by at least +40% above average volume may trigger a technical buy signal. Any losses below the 50 DMA line and recent lows would raise concerns and trigger technical sell signals. Reported earnings +31% on +33% sales revenues for the Jul '20 quarter versus the year ago period. Three of the past 4 quarterly comparisons were above the +25% minimum earnings guideline (C criteria). See the latest FSU analysis for more details and a new annotated graph.
>>> FEATURED STOCK ARTICLE : First Sound Base Being Built After Considerable Rally - 10/6/2020 |
View all notes |
Set NEW NOTE alert |
Company Profile |
SEC
News |
Chart |
Request a new note
C
A
S
I |
|
|
|
THESE ARE NOT BUY RECOMMENDATIONS!
Comments contained in the body of this report are technical
opinions only. The material herein has been obtained
from sources believed to be reliable and accurate, however,
its accuracy and completeness cannot be guaranteed.
This site is not an investment advisor, hence it does
not endorse or recommend any securities or other investments.
Any recommendation contained in this report may not
be suitable for all investors and it is not to be deemed
an offer or solicitation on our part with respect to
the purchase or sale of any securities. All trademarks,
service marks and trade names appearing in this report
are the property of their respective owners, and are
likewise used for identification purposes only.
This report is a service available
only to active Paid Premium Members.
You may opt-out of receiving report notifications
at any time. Questions or comments may be submitted
by writing to Premium Membership Services 665 S.E. 10 Street, Suite 201 Deerfield Beach, FL 33441-5634 or by calling 1-800-965-8307
or 954-785-1121.
|
|
|