You are not logged in.
This means you
CAN ONLY VIEW reports that were published prior to Tuesday, February 20, 2024.
You
MUST UPGRADE YOUR MEMBERSHIP if you want to see any current reports.
AFTER MARKET UPDATE - WEDNESDAY, OCTOBER 9TH, 2019
Previous After Market Report Next After Market Report >>>
|
|
|
|
DOW |
+181.97 |
26,346.01 |
+0.70% |
|
Volume |
658,683,800 |
-18% |
|
Volume |
1,523,009,674 |
-21% |
|
NASDAQ |
+79.96 |
7,903.74 |
+1.02% |
|
Advancers |
1,784 |
65% |
|
Advancers |
1,858 |
60% |
|
S&P 500 |
+26.34 |
2,919.40 |
+0.91% |
|
Decliners |
954 |
35% |
|
Decliners |
1,215 |
40% |
|
Russell 2000 |
+6.86 |
1,479.46 |
+0.47% |
|
52 Wk Highs |
86 |
|
|
52 Wk Highs |
31 |
|
|
S&P 600 |
+3.53 |
916.17 |
+0.39% |
|
52 Wk Lows |
71 |
|
|
52 Wk Lows |
116 |
|
|
 |
Major Indices Rose With Less Volume Conviction
Kenneth J. Gruneisen - Passed the CAN SLIM® Master's Exam
The Dow rallied 181 points, while the S&P 500 jumped 0.9%. The Nasdaq Composite advanced 1%. Volume totals reported were lighter than the prior session totals on the Nasdaq exchange and on the NYSE, revealing lackluster institutional buying demand. Breadth was positive as advancers led decliners by a 9-5 margin on the NYSE and by 3-2 on the Nasdaq exchange. There were 12 high-ranked companies from the Leaders List that hit a new 52-week high and were listed on the BreakOuts Page, versus the total of 5 on the prior session. New 52-week highs outnumbered new 52-week lows on the NYSE, but new lows outnumbered new highs on the Nasdaq exchange. The uptrend for the major indices (M criteria) has recently come under greater pressure, having the look of a more serious correction. Disciplined investors know to reduce exposure to stocks during market corrections. The Featured Stocks Page provides the most timely analysis on high-ranked leaders. Charts used courtesy of www.stockcharts.com
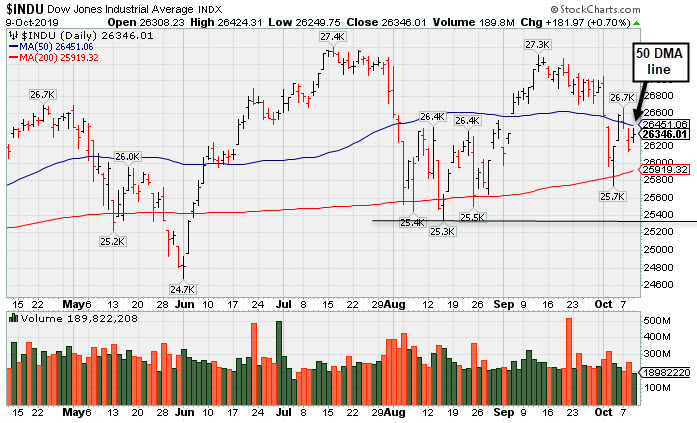
PICTURED: The Dow Jones Industrial Average's prior low and its 200-day moving average (DMA) line define important near-term support to watch while it is sputtering below its 50 DMA line. More damaging losses may bode poorly for the market outlook. Meanwhile, it remains perched only -3.8% off its record high.
Stocks ended firmly higher on Wednesday amid optimism on the trade front. Media outlets revealed China is open to a partial trade deal with the U.S., despite reports yesterday that Washington placed restrictions on Chinese companies and government officials connected to alleged human rights violations. Beijing also indicated a willingness to increase purchases on agricultural products, but noted negotiators would not concede on key sticking points. The boost in investor sentiment came ahead of planned high-level negotiations on Thursday.
In central bank news, the Federal Reserve revealed the minutes of the September FOMC meeting. The release showed officials debated when to end monetary policy easing in light of growing risks to the U.S. economy. On the data front, The Job Openings and Labor Turnover Survey (JOLTS) showed job openings unexpectedly fell to 7.05 million in August, the lowest level since March 2018. Treasuries weakened with the yield on the benchmark 10-year note up three basis points to 1.58%.
All 11 S&P 500 sectors ended in positive territory, with four groups adding more than 1%. Technology stocks paced the gains amid a rally in chipmakers. In corporate news, Johnson & Johnson (JNJ -1.9%) fell after being ordered to pay $8 billion in a drug related lawsuit. Target (TGT +1.7%) rose following positive analyst comments surrounding its ecommerce partnership with the parent company of Toys R Us.
In commodities, WTI crude added 0.1% to $52.69/barrel. COMEX gold gained 0.7% to $1,507.00/ounce.
|
 Kenneth J. Gruneisen started out as a licensed stockbroker in August 1987, a couple of months prior to the historic stock market crash that took the Dow Jones Industrial Average down -22.6% in a single day. He has published daily fact-based fundamental and technical analysis on high-ranked stocks online for two decades. Through FACTBASEDINVESTING.COM, Kenneth provides educational articles, news, market commentary, and other information regarding proven investment systems that work in good times and bad.
Comments contained in the body of this report are technical opinions only and are not necessarily those of Gruneisen Growth Corp. The material herein has been obtained from sources believed to be reliable and accurate, however, its accuracy and completeness cannot be guaranteed. Our firm, employees, and customers may effect transactions, including transactions contrary to any recommendation herein, or have positions in the securities mentioned herein or options with respect thereto. Any recommendation contained in this report may not be suitable for all investors and it is not to be deemed an offer or solicitation on our part with respect to the purchase or sale of any securities. |
|
 |
Retail, Financial, Tech, and Energy-Linked Groups Rose
Kenneth J. Gruneisen - Passed the CAN SLIM® Master's Exam
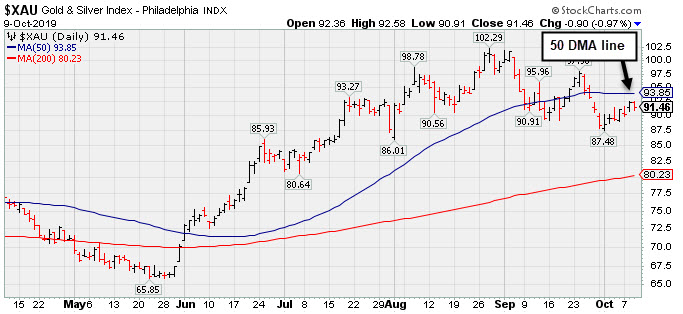
The Broker/Dealer Index ($XBD +1.04%), Bank Index ($BKX +0.81%) and the Retail Index ($RLX +0.91%) each posted a solid gain. The tech sector had a positive bias as the Semiconductor Index ($SOX +1.74%) outpaced the Biotech Index ($BTK +0.68%) and the Networking Index ($NWX +0.50%). Commodity-linked groups were mixed as the Oil Services Index ($OSX +0.71%) and Integrated Oil Index ($XOI +1.21%) rose, meanwhile, the Gold & Silver Index ($XAU -0.97%) was a standout decliner.
PICTURED: The Gold & Silver Index ($XAU -0.97%) is sputtering below its 50-day moving average (DMA) line again, consolidating following an impressive late-May to August rally.
| Oil Services |
$OSX |
61.33 |
+0.43 |
+0.71% |
-23.91% |
| Integrated Oil |
$XOI |
1,165.48 |
+13.90 |
+1.21% |
+0.55% |
| Semiconductor |
$SOX |
1,540.85 |
+26.40 |
+1.74% |
+33.39% |
| Networking |
$NWX |
541.01 |
+2.68 |
+0.50% |
+10.71% |
| Broker/Dealer |
$XBD |
245.61 |
+2.53 |
+1.04% |
+3.49% |
| Retail |
$RLX |
2,321.88 |
+21.04 |
+0.91% |
+18.98% |
| Gold & Silver |
$XAU |
91.46 |
-0.90 |
-0.97% |
+29.44% |
| Bank |
$BKX |
95.36 |
+0.77 |
+0.81% |
+11.16% |
| Biotech |
$BTK |
4,126.19 |
+27.82 |
+0.68% |
-2.24% |
|
|
|
 |
Tested Support at Long-Term 200-Day Moving Average
Kenneth J. Gruneisen - Passed the CAN SLIM® Master's Exam
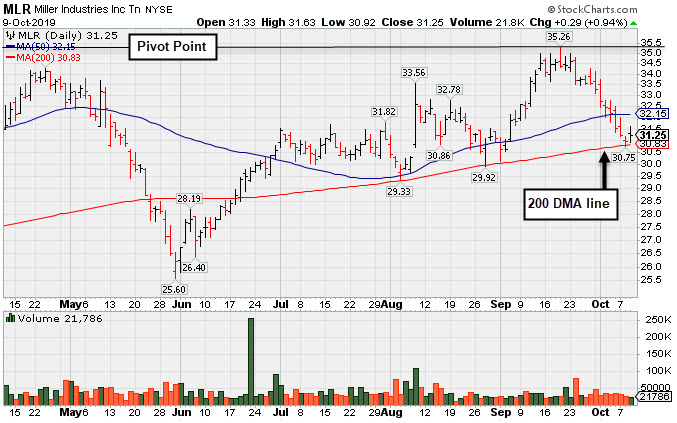
Miller Industries Inc (MLR +$0.29 or +0.94% to $31.25) halted its slide today at its 200-day moving average (DMA) line ($31.15). More damagaing losses would raise serious concerns. Its color code was changed to green after violating its 50 DMA line ($32.24) during a streak of noted losses. A rebound above the 50 DMA line is needed for its outlook to improve. Subsequent gains above the pivot point backed by at least +40% above average volume may trigger a technical buy signal.
June '19 quarterly earnings rose +40% on +26% sales revenues versus the year ago period, and 3 of the past 4 comparisons were above the +25% minimum earnings guideline (C criteria). Annual earnings history (A criteria) has also been good. Very small supply of only 11.4 million shares outstanding (S criteria) can contribute to greater price volatility in the event of institutional buying or selling.
MLR was dropped from the Featured Stocks list on 5/22/19 and went through a choppy consolidation below its 200-day moving average then rebounded. It returned to the Featured Stocks list on 9/24/19 when highlighted in yellow in the mid-day report (read here) and shown in this FSU section that evening with an annotated graph under the headline, "Encountered Distributional Pressure After Challenging Prior High".
The number of top-rated funds owning its shares rose from 196 in Mar '18 to 236 in Sep '19, a reassuring sign concerning the I criteria. The current Up/Down Volume Ratio of 0.9 is an unbiased indication its shares have been under slight distributional pressure over the past 50 days. It has earned an B Timeliness rating and a E Sponsorship Rating.
Charts courtesy of www.stockcharts.com
 |
|
|
Color Codes Explained :
Y - Better candidates highlighted by our
staff of experts.
G - Previously featured
in past reports as yellow but may no longer be buyable under the
guidelines.
***Last / Change / Volume data in this table is the closing quote data***
Symbol/Exchange
Company Name
Industry Group |
PRICE |
CHANGE
(%Change) |
Day High |
Volume
(% DAV)
(% 50 day avg vol) |
52 Wk Hi
% From Hi |
Featured
Date |
Price
Featured |
Pivot Featured |
|
Max Buy |
 MLR
-
NYSE
MLR
-
NYSE
Miller Industries Inc
AUTOMOTIVE - Auto Parts
|
$31.25
|
+0.29
0.94% |
$31.63
|
21,786
62.60% of 50 DAV
50 DAV is 34,800
|
$35.26
-11.37%
|
9/24/2019
|
$34.00
|
PP = $35.36
|
|
MB = $37.13
|
 Most Recent Note - 10/9/2019 5:47:46 PM
G - Halted its slide at its 200 DMA line today following a streak of 9 consecutive losses. A rebound above its 50 DMA line ($32.24) is needed for its outlook to improve. Subsequent gains above the pivot point backed by at least +40% above average volume may trigger a technical buy signal. Fundamentals remain strong. See the latest FSU analysis for more details and a new annotated graph.
>>> FEATURED STOCK ARTICLE : Tested Support at Long-Term 200-Day Moving Average - 10/9/2019 |
View all notes |
Set NEW NOTE alert |
Company Profile |
SEC
News |
Chart |
Request a new note
C
A
S
I |
CCBG
-
NASDAQ
Capital City Bk Gp
BANKING - Regional - Mid-Atlantic Banks
|
$26.62
|
+0.44
1.68% |
$26.77
|
15,684
58.09% of 50 DAV
50 DAV is 27,000
|
$28.00
-4.93%
|
9/13/2019
|
$27.03
|
PP = $27.05
|
|
MB = $28.40
|
Most Recent Note - 10/9/2019 5:50:33 PM
Y - Posted a small gain on light volume today while still hovering near its 52-week high. Prior highs define initial support to watch above its 50 DMA line ($25.50).
>>> FEATURED STOCK ARTICLE : Stalled After Recent Rally for New High - 9/27/2019 |
View all notes |
Set NEW NOTE alert |
Company Profile |
SEC
News |
Chart |
Request a new note
C
A
S
I |
EPAM
-
NYSE
Epam Systems Inc
COMPUTER SOFTWARE and SERVICES - Information Technology Service
|
$185.83
|
+1.32
0.72% |
$186.76
|
211,522
59.25% of 50 DAV
50 DAV is 357,000
|
$201.00
-7.55%
|
5/9/2019
|
$169.25
|
PP = $180.55
|
|
MB = $189.58
|
Most Recent Note - 10/8/2019 5:52:43 PM
G - Slumped back below its 50 DMA line ($186.83) again hurting its outlook. Faces resistance due to overhead supply up to the $201 level. Prior lows in the $174-175 area define the next important support level. Reported earnings +27% on +24% sales revenues for the Jun '19 quarter.
>>> FEATURED STOCK ARTICLE : Slumped and Sputtered Below 50-Day Moving Average - 9/30/2019 |
View all notes |
Set NEW NOTE alert |
Company Profile |
SEC
News |
Chart |
Request a new note
C
A
S
I |
AUDC
-
NASDAQ
Audiocodes Ltd
ELECTRONICS - Scientific and Technical Instrum
|
$17.74
|
+0.14
0.80% |
$17.85
|
125,939
61.73% of 50 DAV
50 DAV is 204,000
|
$22.50
-21.16%
|
9/13/2019
|
$19.68
|
PP = $19.84
|
|
MB = $20.83
|
Most Recent Note - 10/8/2019 5:49:16 PM
G - Color code is changed to green after slumping back below its 50 DMA line ($18.51) again. Prior lows in the $16.50 area define the next important support.
>>> FEATURED STOCK ARTICLE : Sank Below 50-Day Average as 7 Straight Losses Follow Reversal - 10/2/2019 |
View all notes |
Set NEW NOTE alert |
Company Profile |
SEC
News |
Chart |
Request a new note
C
A
S
I |
CHDN
-
NASDAQ
Churchill Downs Inc
LEISURE - Gaming Activities
|
$130.08
|
+0.31
0.24% |
$131.27
|
378,713
162.54% of 50 DAV
50 DAV is 233,000
|
$132.73
-2.00%
|
10/8/2019
|
$129.77
|
PP = $132.83
|
|
MB = $139.47
|
Most Recent Note - 10/9/2019 12:41:28 PM
Y - Posted a 4th consecutive gain with higher volume on the prior session and finished at a record high close. Color code was changed to yellow with new pivot point cited based on its 8/01/19 high plus 10 cents. Subsequent gains above the pivot point backed by at least +40% above average volume may trigger a new (or add-on) technical buy signal. Its 50 DMA line ($122.63) acted as support in recent weeks during its consolidation. Jun '19 earnings +10% on +26% sales revenues versus the year ago period were below the +25% minimum earnings guideline (C criteria), noted recently raising fundamental concerns. See the latest FSU analysis for more details and an annotated graph.
>>> FEATURED STOCK ARTICLE : Volume-Driven Gain for Record High Close - 10/8/2019 |
View all notes |
Set NEW NOTE alert |
Company Profile |
SEC
News |
Chart |
Request a new note
C
A
S
I |
Symbol/Exchange
Company Name
Industry Group |
PRICE |
CHANGE
(%Change) |
Day High |
Volume
(% DAV)
(% 50 day avg vol) |
52 Wk Hi
% From Hi |
Featured
Date |
Price
Featured |
Pivot Featured |
|
Max Buy |
LULU
-
NASDAQ
Lululemon Athletica
MANUFACTURING - Textile Manufacturing
|
$192.16
|
+0.79
0.41% |
$194.50
|
903,180
50.26% of 50 DAV
50 DAV is 1,797,000
|
$204.44
-6.01%
|
9/6/2019
|
$201.25
|
PP = $194.35
|
|
MB = $204.07
|
Most Recent Note - 10/7/2019 5:57:49 PM
Y - Found support at its 50 DMA line ($187.23) but recently sputtering below the prior high ($194.25) raising concerns. More damaging losses would raise serious concerns and trigger a technical sell signal.
>>> FEATURED STOCK ARTICLE : Found Support After Undercutting 50-Day Moving Average - 10/3/2019 |
View all notes |
Set NEW NOTE alert |
Company Profile |
SEC
News |
Chart |
Request a new note
C
A
S
I |
CPRT
-
NASDAQ
Copart Inc
SPECIALTY RETAIL - Auto Dealerships
|
$80.48
|
+0.33
0.41% |
$80.77
|
1,650,891
112.77% of 50 DAV
50 DAV is 1,464,000
|
$83.70
-3.85%
|
9/5/2019
|
$79.13
|
PP = $79.84
|
|
MB = $83.83
|
Most Recent Note - 10/9/2019 5:52:19 PM
Y - Color code is changed to yellow after finding support above its 50 DMA line ($78.16) and trading back above its pivot point helping its outlook improve.
>>> FEATURED STOCK ARTICLE : Found Prompt Support Near 50-Day Moving Average - 10/4/2019 |
View all notes |
Set NEW NOTE alert |
Company Profile |
SEC
News |
Chart |
Request a new note
C
A
S
I |
PFPT
-
NASDAQ
Proofpoint Inc
Computer Sftwr-Security
|
$127.28
|
+2.23
1.78% |
$127.78
|
487,673
69.57% of 50 DAV
50 DAV is 701,000
|
$133.00
-4.30%
|
10/1/2019
|
$129.59
|
PP = $132.95
|
|
MB = $139.60
|
Most Recent Note - 10/8/2019 5:51:10 PM
Y - Retreated from its all-time high with another volume-driven loss today. Its 50 DMA line ($121.91) defines near-term support. Met stubborn resistance in the $132 area in recent months. Subsequent gains above the pivot point backed by at least +40% above average volume may trigger a technical buy signal.
>>> FEATURED STOCK ARTICLE : Challenging Previously Stubborn Resistance - 10/1/2019 |
View all notes |
Set NEW NOTE alert |
Company Profile |
SEC
News |
Chart |
Request a new note
C
A
S
I |
BLD
-
NYSE
Topbuild Corp
Bldg-Constr Prds/Misc
|
$97.65
|
+2.20
2.30% |
$97.79
|
169,087
56.74% of 50 DAV
50 DAV is 298,000
|
$97.99
-0.35%
|
5/17/2019
|
$82.19
|
PP = $87.31
|
|
MB = $91.68
|
Most Recent Note - 10/9/2019 5:49:29 PM
G - Posted a quiet gain today for a best-ever close. Stayed above its 50 DMA line, and challenging its all-time high, it is extended from the prior base after wedging higher with gains lacking great volume conviction. Earnings rose +39% on +9% sales revenues for the Jun '19 quarter versus the year ago period. Its 50 DMA line ($92.186) defines important support to watch along with its prior low ($86.53 on 8/28/19).
>>> FEATURED STOCK ARTICLE : Near High After Finding Support at 50-Day Average - 10/7/2019 |
View all notes |
Set NEW NOTE alert |
Company Profile |
SEC
News |
Chart |
Request a new note
C
A
S
I |
PAGS
-
NYSE
Pagseguro Digital Cl A
Finance-CrdtCard/PmtPr
|
$44.94
|
+0.67
1.51% |
$45.64
|
572,231
31.72% of 50 DAV
50 DAV is 1,804,000
|
$53.43
-15.89%
|
6/25/2019
|
$37.69
|
PP = $40.07
|
|
MB = $42.07
|
Most Recent Note - 10/7/2019 5:55:25 PM
G - A rebound above the 50 DMA line ($47.36) is needed for its outlook to improve. Recently testing prior lows in the $42-43 area noted as important near-term chart support to watch where violations may trigger a worrisome technical sell signal.
>>> FEATURED STOCK ARTICLE : Recent Lows Define Important Near-Term Support While Consolidating - 9/25/2019 |
View all notes |
Set NEW NOTE alert |
Company Profile |
SEC
News |
Chart |
Request a new note
C
A
S
I |
Symbol/Exchange
Company Name
Industry Group |
PRICE |
CHANGE
(%Change) |
Day High |
Volume
(% DAV)
(% 50 day avg vol) |
52 Wk Hi
% From Hi |
Featured
Date |
Price
Featured |
Pivot Featured |
|
Max Buy |
|
|
|
THESE ARE NOT BUY RECOMMENDATIONS!
Comments contained in the body of this report are technical
opinions only. The material herein has been obtained
from sources believed to be reliable and accurate, however,
its accuracy and completeness cannot be guaranteed.
This site is not an investment advisor, hence it does
not endorse or recommend any securities or other investments.
Any recommendation contained in this report may not
be suitable for all investors and it is not to be deemed
an offer or solicitation on our part with respect to
the purchase or sale of any securities. All trademarks,
service marks and trade names appearing in this report
are the property of their respective owners, and are
likewise used for identification purposes only.
This report is a service available
only to active Paid Premium Members.
You may opt-out of receiving report notifications
at any time. Questions or comments may be submitted
by writing to Premium Membership Services 665 S.E. 10 Street, Suite 201 Deerfield Beach, FL 33441-5634 or by calling 1-800-965-8307
or 954-785-1121.
|
|
|