You are not logged in.
This means you
CAN ONLY VIEW reports that were published prior to Saturday, February 24, 2024.
You
MUST UPGRADE YOUR MEMBERSHIP if you want to see any current reports.
AFTER MARKET UPDATE - THURSDAY, OCTOBER 8TH, 2020
Previous After Market Report Next After Market Report >>>
|
|
|
|
DOW |
+122.05 |
28,425.51 |
+0.43% |
|
Volume |
798,788,092 |
-9% |
|
Volume |
3,469,763,300 |
-11% |
|
NASDAQ |
+56.38 |
11,420.98 |
+0.50% |
|
Advancers |
2,267 |
75% |
|
Advancers |
2,274 |
67% |
|
S&P 500 |
+27.38 |
3,446.83 |
+0.80% |
|
Decliners |
747 |
25% |
|
Decliners |
1,130 |
33% |
|
Russell 2000 |
+17.51 |
1,628.55 |
+1.09% |
|
52 Wk Highs |
162 |
|
|
52 Wk Highs |
165 |
|
|
S&P 600 |
+13.58 |
922.07 |
+1.49% |
|
52 Wk Lows |
14 |
|
|
52 Wk Lows |
10 |
|
|
 |
Major Indices Rose With Lighter Volume Yet Again
Kenneth J. Gruneisen - Passed the CAN SLIM® Master's Exam
The Dow rose 122 points, while the S&P 500 rose 0.8% to a five week high. The Nasdaq Composite advanced 0.5%. The reported volume totals were lighter than the prior session on the NYSE and on the Nasdaq exchange, revealing less enthusiastic institutional buying. Breadth was positive as advancers led decliners by a 3-1 margin on the NYSE and 2-1 on the Nasdaq exchange. There were 90 high-ranked companies from the Leaders List that hit new 52-week highs and were listed on the BreakOuts Page, versus the total of 79 on the prior session. New 52-week highs totals expanded again and easily outnumbered shrinking new 52-week lows totals on the NYSE and on the Nasdaq exchange. The major indices are in a confirmed uptrend (M criteria). New buying efforts may be justified in leading stocks on a case-by-case basis.
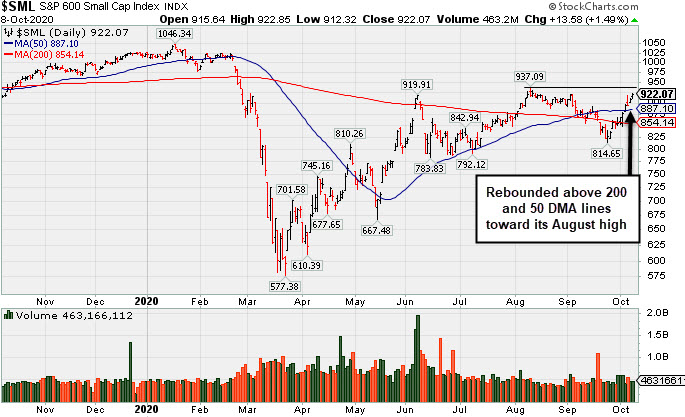 PICTURED: The S&P 600 Small Cap Index is has rebounded above its 200-day and 50-day moving average (DMA) lines in recent weeks. That technical improvement has it approaching its August high. A technically stronger small cap index bodes well for investors who use the fact-based investment system, which usually focuses more closely on smaller stocks.
Stocks finished higher Thursday, as investors digested a slew of corporate updates and developments on the fiscal stimulus front. President Trump boosted sentiment in early trading noting that the two sides were having “productive talks.” However, House Speaker Nancy Pelosi contradicted the President’s comments after issuing a statement opposing a standalone bill for airlines without a larger aid package.
On the data front, initial jobless claims came in higher than anticipated at 840,000 in the week ending October 3, but declined from the prior period’s upwardly revised 849,000 figure. Meanwhile, continuing claims fell more than expected to 10.98 million in the week ending September 26. Treasuries strengthened, with the yield on the 10-year slipping three basis points to 0.76%. In commodities, WTI crude jumped 3.2% to $41.22/barrel as investors monitor hurricane Delta in the Gulf of Mexico.
All 11 S&P 500 sectors ended the day in positive territory, with the Energy group rising more than 3.5%. In corporate news, Eaton Vance (EV +48.14%) advanced after Morgan Stanley (MS +0.60%) agreed to buy the company for $7 billion. IBM (IBM +5.98%) after announcing a spin-off of its managed infrastructure service unit into a new publicly traded company. Elsewhere, Regeneron Pharmaceutical (REGN +1.38%) rose after requesting emergency use authorization for its experiential COVID-19 antibody cocktail. In earnings, Domino’s (DPZ -6.97%) fell after higher than expected delivery costs weighed on results. |
 Kenneth J. Gruneisen started out as a licensed stockbroker in August 1987, a couple of months prior to the historic stock market crash that took the Dow Jones Industrial Average down -22.6% in a single day. He has published daily fact-based fundamental and technical analysis on high-ranked stocks online for two decades. Through FACTBASEDINVESTING.COM, Kenneth provides educational articles, news, market commentary, and other information regarding proven investment systems that work in good times and bad.
Comments contained in the body of this report are technical opinions only and are not necessarily those of Gruneisen Growth Corp. The material herein has been obtained from sources believed to be reliable and accurate, however, its accuracy and completeness cannot be guaranteed. Our firm, employees, and customers may effect transactions, including transactions contrary to any recommendation herein, or have positions in the securities mentioned herein or options with respect thereto. Any recommendation contained in this report may not be suitable for all investors and it is not to be deemed an offer or solicitation on our part with respect to the purchase or sale of any securities. |
|
 |
Financial, Energy, and Tech Indices Led Group Gainers
Kenneth J. Gruneisen - Passed the CAN SLIM® Master's Exam
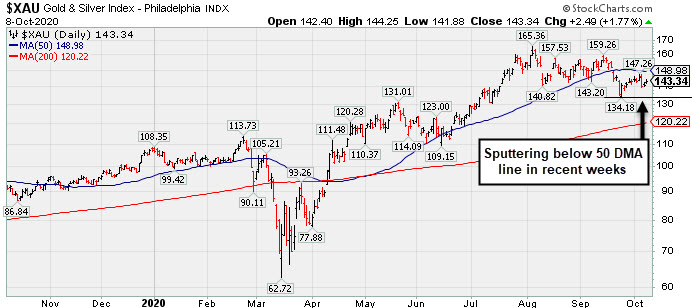
Financial shares helped underpin the major indices' gains as the Broker/Dealer Index ($XBD +1.45%) and Bank Index ($BKX +1.59%) both rose on Thursday. The Retail Index ($RLX +0.35%) edged higher. The Networking Index ($NWX +2.12%) led the tech sector while the Semiconductor Index ($SOX +1.17%) posted a smaller gain and the Biotech Index ($BTK +0.18%) inched higher. Energy-linked shares had a strong showing as the Oil Services Index ($OSX +5.33%) and Integrated Oil Index ($XOI +3.55%) posted standout gains. PICTURED: The Gold & Silver Index ($XAU +1.77%) also rose on Thursday. In recent weeks it has been sputtering below its 50-day moving average (DMA) line.
| Oil Services |
$OSX |
30.05 |
+1.52 |
+5.33% |
-61.61% |
| Integrated Oil |
$XOI |
628.53 |
+21.53 |
+3.55% |
-50.53% |
| Semiconductor |
$SOX |
2,356.16 |
+27.32 |
+1.17% |
+27.39% |
| Networking |
$NWX |
564.72 |
+11.74 |
+2.12% |
-3.20% |
| Broker/Dealer |
$XBD |
296.37 |
+4.23 |
+1.45% |
+2.06% |
| Retail |
$RLX |
3,475.90 |
+12.26 |
+0.35% |
+41.92% |
| Gold & Silver |
$XAU |
143.34 |
+2.49 |
+1.77% |
+34.06% |
| Bank |
$BKX |
79.82 |
+1.25 |
+1.59% |
-29.59% |
| Biotech |
$BTK |
5,564.21 |
+9.84 |
+0.18% |
+9.80% |
|
|
|
 |
Showed Resilience Near 50-Day Moving Average
Kenneth J. Gruneisen - Passed the CAN SLIM® Master's Exam
Adobe Inc (ADBE -$2.31 or -0.47% to $490.84) has seen its volume totals cooling while consolidating above its 50-day moving average (DMA) line ($477). More damaging losses below the 50 DMA would raise greater concerns. It faces some near-term resistance due to overhead supply up to the $536 level. Fundamentals remain strong.
ADBE was last shown in this FSU section on 9/23/20 with an annotated graph under the headline, "Light Volume Loss Falling Near 50-Day Moving Average Line Again" after highlighted in yellow in the 9/10/20 mid-day report (read here). It was noted that after finding support at its 10 week-moving average (WMA). A valid secondary buy point exists up to 5% above the latest high. Disciplined investors always limit losses by selling any stock that falls more than 7-8% from their purchase price.
This well-known Computer Software - Desktop firm reported Aug '20 quarterly earnings +25% on +14% sales revenues versus the year ago period, which marked its 4th consecutive quarterly earnings increase above the +25% minimum guideline (C criteria). Annual earnings history (A criteria) has been strong and steady.
It has a large supply of 479.7 million shares outstanding (S criteria) which makes it a less likely sprinter. However, the number of top-rated funds owning its shares rose from 3,285 in Sep '19 to 3,949 in Jun '20, a reassuring sign concerning the I criteria. Its current Up/Down Volume Ratio of 1.1 is an unbiased indication its shares have been under slight accumulation over the past 50 days. It has an A Timeliness Rating and a B Sponsorship rating, however, its Accumulation/Distribution rating is currently a D. |
|
|
Color Codes Explained :
Y - Better candidates highlighted by our
staff of experts.
G - Previously featured
in past reports as yellow but may no longer be buyable under the
guidelines.
***Last / Change / Volume data in this table is the closing quote data***
Symbol/Exchange
Company Name
Industry Group |
PRICE |
CHANGE
(%Change) |
Day High |
Volume
(% DAV)
(% 50 day avg vol) |
52 Wk Hi
% From Hi |
Featured
Date |
Price
Featured |
Pivot Featured |
|
Max Buy |
 ADBE
-
NASDAQ
ADBE
-
NASDAQ
Adobe Inc
COMPUTER SOFTWARE and SERVICES - Application Software
|
$490.84
|
-2.31
-0.47% |
$499.49
|
1,588,849
51.14% of 50 DAV
50 DAV is 3,107,000
|
$536.88
-8.58%
|
9/10/2020
|
$488.46
|
PP = $536.88
|
|
MB = $563.72
|
 Most Recent Note - 10/8/2020 5:30:25 PM
G - Volume totals have been cooling while consolidating above its 50 DMA line ($477). More damaging losses below the 50 DMA would raise greater concerns. Faces near-term resistance due to overhead supply up to the $536 level. Fundamentals remain strong. See the latest FSU analysis for more details and a new annotated graph.
>>> FEATURED STOCK ARTICLE : Showed Resilience Near 50-Day Moving Average - 10/8/2020 |
View all notes |
Set NEW NOTE alert |
Company Profile |
SEC
News |
Chart |
Request a new note
C
A
S
I |
CRL
-
NYSE
Charles River Labs Intl
DRUGS - Biotechnology
|
$236.49
|
-0.86
-0.36% |
$238.63
|
218,296
68.00% of 50 DAV
50 DAV is 321,000
|
$237.73
-0.52%
|
7/15/2020
|
$192.66
|
PP = $189.95
|
|
MB = $199.45
|
Most Recent Note - 10/5/2020 5:14:42 PM
G - Posted a big gain with -34% below average volume today for a new all-time high. Found prompt support at its 50 DMA line ($215.51) where any subsequent violation would raise concerns and trigger a technical sell signal. Raised fundamental concerns when it recently reported Jun '20 quarterly earnings -3% on +4% sales revenues, below the +25% minimum guideline (C criteria).
>>> FEATURED STOCK ARTICLE : Showed Resilience When Testing 50-Day Moving Average Line Again - 9/24/2020 |
View all notes |
Set NEW NOTE alert |
Company Profile |
SEC
News |
Chart |
Request a new note
C
A
S
I |
AMD
-
NASDAQ
Advanced Micro Devices
ELECTRONICS - Semiconductor - Broad Line
|
$86.51
|
-0.18
-0.21% |
$88.72
|
54,062,346
92.51% of 50 DAV
50 DAV is 58,440,000
|
$94.28
-8.24%
|
8/31/2020
|
$90.42
|
PP = $87.39
|
|
MB = $91.76
|
Most Recent Note - 10/5/2020 5:21:10 PM
G - Rebounding toward its prior high after finding prompt support near its 50 DMA line ($80.97). Any deterioration below the 50 DMA line and the recent low ($73.85 on 9/18/20) would raise greater concerns and trigger more worrisome technical sell signals. It has not formed a sound base of sufficient length and faces some resistance due to overhead supply up to the $94 level. Fundamentals remain strong.
>>> FEATURED STOCK ARTICLE : Rebound Above 50-Day Average With Light Volume Helped Stance - 9/28/2020 |
View all notes |
Set NEW NOTE alert |
Company Profile |
SEC
News |
Chart |
Request a new note
C
A
S
I |
TREX
-
NYSE
Trex Company Inc
MATERIALS and CONSTRUCTION - General Building Materials
|
$76.33
|
+0.68
0.90% |
$77.26
|
339,240
35.23% of 50 DAV
50 DAV is 963,000
|
$78.61
-2.90%
|
6/26/2020
|
$54.53
|
PP = $66.47
|
|
MB = $69.79
|
Most Recent Note - 10/5/2020 5:18:28 PM
G - Posted a 4th consecutive gain today with below average volume for a 2nd best ever close. Recently rebounding well above its 50 DMA line ($70.94) helping its outlook to improve. Any losses below the 50 DMA line or recent low ($63.32 on 9/21/20) would raise concerns and trigger technical sell signals. Do not be confused by the 2:1 share split effective 9/15/20 (Featured Price, Pivot Point, and Max Buy prices have been adjusted accordingly). Fundamentals remain strong. See the latest FSU analysis for more details and an annotated graph.
>>> FEATURED STOCK ARTICLE : TREX Rebounded Above 50-Day Moving Average - 9/30/2020 |
View all notes |
Set NEW NOTE alert |
Company Profile |
SEC
News |
Chart |
Request a new note
C
A
S
I |
NFLX
-
NASDAQ
Netflix Inc
SPECIALTY RETAIL - Music and Video Stores
|
$531.79
|
-2.87
-0.54% |
$535.00
|
5,342,891
93.83% of 50 DAV
50 DAV is 5,694,000
|
$575.37
-7.57%
|
9/1/2020
|
$547.45
|
PP = $575.47
|
|
MB = $604.24
|
Most Recent Note - 10/7/2020 12:51:25 PM
G - Rebounding toward its prior high ($557 on 9/01/20) which may act as resistance. Consolidating above its 50 DMA line ($498) and above the recent low ($458.60 on 9/18/20). Those levels define important near term support where any further deterioration would raise more serious concerns and trigger technical sell signals.
>>> FEATURED STOCK ARTICLE : Quiet Rebound Meeting Resistance at 50-Day Moving Average - 9/29/2020 |
View all notes |
Set NEW NOTE alert |
Company Profile |
SEC
News |
Chart |
Request a new note
C
A
S
I |
Symbol/Exchange
Company Name
Industry Group |
PRICE |
CHANGE
(%Change) |
Day High |
Volume
(% DAV)
(% 50 day avg vol) |
52 Wk Hi
% From Hi |
Featured
Date |
Price
Featured |
Pivot Featured |
|
Max Buy |
LGIH
-
NASDAQ
L G I Homes Inc
Bldg-Resident/Comml
|
$124.28
|
+2.26
1.85% |
$126.80
|
165,339
55.86% of 50 DAV
50 DAV is 296,000
|
$131.95
-5.81%
|
10/1/2020
|
$123.17
|
PP = $124.04
|
|
MB = $130.24
|
Most Recent Note - 10/6/2020 9:07:12 PM
Y - Pulled back today after 4 consecutive gains into new high territory. Color code was recently changed to yellow with new pivot point cited based on its 8/04/20 high plus 10 cents. Subsequent gains above the pivot point backed by at least +40% above average volume are still needed to trigger a new (or add-on) technical buy signal. Recent rebound above its 50 DMA line ($113.76) helped its outlook to improve. Any losses below the 50 DMA line and latest low ($101.30 on 9/21/20) would raise greater concerns and trigger worrisome technical sell signals. Reported Jun '20 quarterly earnings +21% on +4% sales revenues, breaking a streak of 4 comparisons above the +25% minimum guideline (C criteria).
>>> FEATURED STOCK ARTICLE : New Base Formed by Strong Homebuilder - 10/1/2020 |
View all notes |
Set NEW NOTE alert |
Company Profile |
SEC
News |
Chart |
Request a new note
C
A
S
I |
NOW
-
NYSE
Servicenow Inc
Computer Sftwr-Enterprse
|
$496.50
|
-3.50
-0.70% |
$505.00
|
823,031
51.63% of 50 DAV
50 DAV is 1,594,000
|
$504.21
-1.53%
|
8/20/2020
|
$453.34
|
PP = $454.79
|
|
MB = $477.53
|
Most Recent Note - 10/5/2020 5:16:49 PM
G - Posted a gain today with light volume for a best-ever close. Found support at its 50 DMA line ($457.50) but did not form a new base of sufficient length. Fundamentals remain strong. Any losses below the 50 DMA line and prior low ($432.85 on 9/08/20) would raise concerns and trigger technical sell signals.
>>> FEATURED STOCK ARTICLE : Gain Back Above "Max Buy" Level for ServiceNow - 9/25/2020 |
View all notes |
Set NEW NOTE alert |
Company Profile |
SEC
News |
Chart |
Request a new note
C
A
S
I |
VEEV
-
NYSE
Veeva Systems Inc Cl A
Computer Sftwr-Medical
|
$290.75
|
+3.34
1.16% |
$290.90
|
550,700
69.97% of 50 DAV
50 DAV is 787,000
|
$298.76
-2.68%
|
10/6/2020
|
$287.71
|
PP = $298.86
|
|
MB = $313.80
|
Most Recent Note - 10/6/2020 9:05:42 PM
Y - Color code was changed to yellow with new pivot point cited based on its 9/02/20 high plus 10 cents. Found support at its its 50 DMA line ($269.66) while forming a 5-week flat base. Subsequent gains above the pivot point backed by at least +40% above average volume may trigger a technical buy signal. Any losses below the 50 DMA line and recent lows would raise concerns and trigger technical sell signals. Reported earnings +31% on +33% sales revenues for the Jul '20 quarter versus the year ago period. Three of the past 4 quarterly comparisons were above the +25% minimum earnings guideline (C criteria). See the latest FSU analysis for more details and a new annotated graph.
>>> FEATURED STOCK ARTICLE : First Sound Base Being Built After Considerable Rally - 10/6/2020 |
View all notes |
Set NEW NOTE alert |
Company Profile |
SEC
News |
Chart |
Request a new note
C
A
S
I |
|
|
|
THESE ARE NOT BUY RECOMMENDATIONS!
Comments contained in the body of this report are technical
opinions only. The material herein has been obtained
from sources believed to be reliable and accurate, however,
its accuracy and completeness cannot be guaranteed.
This site is not an investment advisor, hence it does
not endorse or recommend any securities or other investments.
Any recommendation contained in this report may not
be suitable for all investors and it is not to be deemed
an offer or solicitation on our part with respect to
the purchase or sale of any securities. All trademarks,
service marks and trade names appearing in this report
are the property of their respective owners, and are
likewise used for identification purposes only.
This report is a service available
only to active Paid Premium Members.
You may opt-out of receiving report notifications
at any time. Questions or comments may be submitted
by writing to Premium Membership Services 665 S.E. 10 Street, Suite 201 Deerfield Beach, FL 33441-5634 or by calling 1-800-965-8307
or 954-785-1121.
|
|
|