You are not logged in.
This means you
CAN ONLY VIEW reports that were published prior to Monday, February 19, 2024.
You
MUST UPGRADE YOUR MEMBERSHIP if you want to see any current reports.
AFTER MARKET UPDATE - TUESDAY, OCTOBER 6TH, 2020
Previous After Market Report Next After Market Report >>>
|
|
|
|
DOW |
-375.88 |
27,772.76 |
-1.34% |
|
Volume |
991,724,604 |
+17% |
|
Volume |
4,367,454,300 |
+23% |
|
NASDAQ |
-166.87 |
11,165.61 |
-1.47% |
|
Advancers |
1,158 |
39% |
|
Advancers |
1,365 |
41% |
|
S&P 500 |
-47.68 |
3,360.95 |
-1.40% |
|
Decliners |
1,818 |
61% |
|
Decliners |
1,973 |
59% |
|
Russell 2000 |
-4.67 |
1,577.29 |
-0.30% |
|
52 Wk Highs |
148 |
|
|
52 Wk Highs |
135 |
|
|
S&P 600 |
-1.18 |
895.26 |
-0.13% |
|
52 Wk Lows |
18 |
|
|
52 Wk Lows |
23 |
|
|
The major indices have shown improvement and have resumed a market uptrend as leadership has improved. Disciplined investors carefully may buy leading stocks on a case-by-case basis. Always remain ready to reduce market exposure in the event of any more substantial market downdrafts.
Today's Big Gainers
|
 |
Major Indices Fell With Higher Volume Indicating Distribution
Kenneth J. Gruneisen - Passed the CAN SLIM® Master's Exam
The Dow declined 375 points, while the S&P 500 fell 1.4%. The Nasdaq Composite lost 1.6%. The reported volume totals were higher than the prior session on the NYSE and on the Nasdaq exchange, revealing an increase in institutional selling. Breadth was negative as decliners led advancers by a 3-2 margin on the NYSE and nearly 3-1 on the Nasdaq exchange. Leadership improved as there were 80 high-ranked companies from the Leaders List that hit new 52-week highs and were listed on the BreakOuts Page, versus the total of 72 on the prior session. New 52-week highs totals expanded and easily outnumbered new 52-week lows totals on the NYSE and on the Nasdaq exchange. The weakness marked the worst session since the major indices' noted shifted back to a confirmed uptrend (M criteria). New buying efforts may be justified in leading stocks on a case-by-case basis.
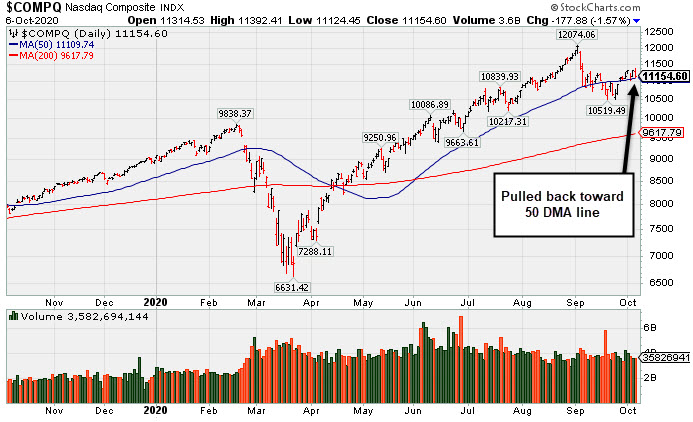 PICTURED: The Nasdaq Composite Index is consolidating just above its 50-day moving average (DMA) line. Recent technical improvement was coupled with an expansion in leadership (stocks hitting new 52-week highs).
Stocks finished lower Tuesday, as investors digested reports that President Donald Trump halted fiscal stimulus negotiations until after the election. Coming into the day investors had been cautiously optimistic that House Speaker Nancy Pelosi and Treasury Secretary Steven Mnuchin could coin a fifth coronavirus relief bill, despite a significant gap in funding between the two parties. COVID-19 also remained a sticking point, as New York rolled back restrictions in high risk areas starting as soon as Wednesday.
On the data front, the U.S. trade deficit widened the most since August 2006 after jumping 5.9%. Separately, the job openings and labor turnover survey (JOLTS) showed the pace of hiring slowed during August for the first time in four months. Treasuries strengthened, with the yield on the benchmark 10-year note falling three basis points to 0.74%.
Ten of 11 S&P 500 sectors ended the day in negative territory with Utilities bucking the downtrend. WTI crude extended its rebound, rising 2.2% to $40.07/barrel as a strengthening hurricane in the Gulf of Mexico disrupts offshore oil rig operations. In corporate news, shares of Logitech (LOGI -6.12%) and Sonos (SONO -7.03%) both slipped after Apple (AAPL -2.87%) announced it will no longer sell competitors headphones or speakers. Elsewhere, shares of Amazon (AMZN -3.10%) as mega-cap companies came under pressure amid regulatory scrutiny. The House Judiciary Committee’s antitrust subcommittee is poised to unveil a proposal for sweeping reforms that would make it easier to break-up the companies. |
 Kenneth J. Gruneisen started out as a licensed stockbroker in August 1987, a couple of months prior to the historic stock market crash that took the Dow Jones Industrial Average down -22.6% in a single day. He has published daily fact-based fundamental and technical analysis on high-ranked stocks online for two decades. Through FACTBASEDINVESTING.COM, Kenneth provides educational articles, news, market commentary, and other information regarding proven investment systems that work in good times and bad.
Comments contained in the body of this report are technical opinions only and are not necessarily those of Gruneisen Growth Corp. The material herein has been obtained from sources believed to be reliable and accurate, however, its accuracy and completeness cannot be guaranteed. Our firm, employees, and customers may effect transactions, including transactions contrary to any recommendation herein, or have positions in the securities mentioned herein or options with respect thereto. Any recommendation contained in this report may not be suitable for all investors and it is not to be deemed an offer or solicitation on our part with respect to the purchase or sale of any securities. |
|
 |
Retail and Commodity-Linked Groups Led Decliners
Kenneth J. Gruneisen - Passed the CAN SLIM® Master's Exam
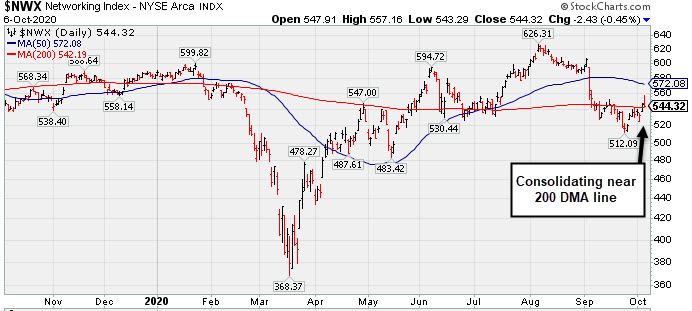
The Retail Index ($RLX -2.59%) lost ground Tuesday and weighed on the major indices while the Bank Index ($BKX -0.93%) and Broker/Dealer Index ($XBD -0.58%) also edged lower. The tech sector had a slightly negative bias as the Biotech Index ($BTK -1.28%), Semiconductor Index ($SOX -0.63%), and Networking Index ($NWX -0.45%) lost ground. Commodity-linked groups were under pressure as the Gold & Silver Index ($XAU -3.97%) outpaced the Oil Services Index ($OSX -1.64%) and Integrated Oil Index ($XOI -1.74%) both to the downside.
PICTURED: The is consolidating above its 50-day moving average (DMA) line.
| Oil Services |
$OSX |
28.26 |
-0.47 |
-1.64% |
-63.91% |
| Integrated Oil |
$XOI |
600.72 |
-10.64 |
-1.74% |
-52.72% |
| Semiconductor |
$SOX |
2,281.09 |
-14.47 |
-0.63% |
+23.33% |
| Networking |
$NWX |
544.32 |
-2.43 |
-0.45% |
-6.70% |
| Broker/Dealer |
$XBD |
288.07 |
-1.69 |
-0.58% |
-0.80% |
| Retail |
$RLX |
3,373.78 |
-89.68 |
-2.59% |
+37.75% |
| Gold & Silver |
$XAU |
139.81 |
-5.77 |
-3.97% |
+30.76% |
| Bank |
$BKX |
76.31 |
-0.72 |
-0.93% |
-32.68% |
| Biotech |
$BTK |
5,411.53 |
-70.21 |
-1.28% |
+6.79% |
|
|
|
 |
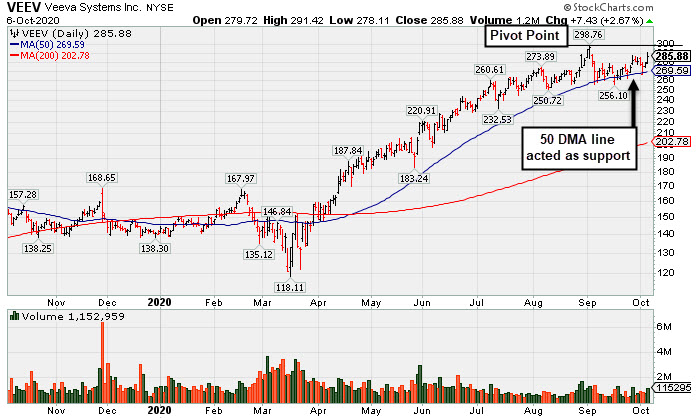
First Sound Base Being Built After Considerable Rally
Kenneth J. Gruneisen - Passed the CAN SLIM® Master's Exam
Veeva Systems Inc Cl A (VEEV+$7.43 or +2.67% to $285.88) was highlighted in yellow with new pivot point cited based on its 9/02/20 high plus 10 cents in the earlier mid-day report (read here) . Found support at its its 50-day moving average (DMA) line ($269.66) while forming a 5-week flat base. Subsequent gains above the pivot point backed by at least +40% above average volume may trigger a technical buy signal. Any losses below the 50 DMA line and recent lows would raise concerns and trigger technical sell signals.
VEEV went through long and choppy consolidation after last shown in this FSU section on 8/23/19 with an annotated graph under the headline, "Met Resistance After Slumping Below 50-Day Moving Average" . It has not spent much time base building since it first began wedging into new high territory back in April.
Veeva has the highest possible 99 Earnings Per Share (EPS) rank and it has a 93 Relative Strength (RS) rating. Both of those ratings must be above 80 for a stock to meet the guidelines for consideration. It reported earnings +31% on +33% sales revenues for the Jul '20 quarter versus the year ago period. Three of the past 4 quarterly comparisons were above the +25% minimum earnings guideline (C criteria). Its annual earnings (A criteria) history has been strong.
There are 134.4 million shares (S criteria) in the publicly traded float. The number of top-rated funds owning its shares rose from 814 in Jun '18 to 1,525 in Jun '20, a reassuring sign concerning the I criteria. Its current Up/Down Volume Ratio of 1.6 is an unbiased indication its shares have been under accumulation over the past 50 days.
|
|
|
Color Codes Explained :
Y - Better candidates highlighted by our
staff of experts.
G - Previously featured
in past reports as yellow but may no longer be buyable under the
guidelines.
***Last / Change / Volume data in this table is the closing quote data***
Symbol/Exchange
Company Name
Industry Group |
PRICE |
CHANGE
(%Change) |
Day High |
Volume
(% DAV)
(% 50 day avg vol) |
52 Wk Hi
% From Hi |
Featured
Date |
Price
Featured |
Pivot Featured |
|
Max Buy |
 ADBE
-
NASDAQ
ADBE
-
NASDAQ
Adobe Inc
COMPUTER SOFTWARE and SERVICES - Application Software
|
$478.98
|
-7.49
-1.54% |
$491.51
|
2,040,553
66.08% of 50 DAV
50 DAV is 3,088,000
|
$536.88
-10.78%
|
9/10/2020
|
$488.46
|
PP = $536.88
|
|
MB = $563.72
|
Most Recent Note - 10/5/2020 5:25:30 PM
G - Volume totals have been cooling while consolidating above its 50 DMA line ($473.85). More damaging losses below the 50 DMA would raise greater concerns. Faces near-term resistance due to overhead supply up to the $536 level. Fundamentals remain strong.
>>> FEATURED STOCK ARTICLE : Light Volume Loss Falling Near 50-Day Moving Average Line Again - 9/23/2020 |
View all notes |
Set NEW NOTE alert |
Company Profile |
SEC
News |
Chart |
Request a new note
C
A
S
I |
CRL
-
NYSE
Charles River Labs Intl
DRUGS - Biotechnology
|
$233.38
|
-1.59
-0.68% |
$236.35
|
271,228
85.29% of 50 DAV
50 DAV is 318,000
|
$235.99
-1.11%
|
7/15/2020
|
$192.66
|
PP = $189.95
|
|
MB = $199.45
|
Most Recent Note - 10/5/2020 5:14:42 PM
G - Posted a big gain with -34% below average volume today for a new all-time high. Found prompt support at its 50 DMA line ($215.51) where any subsequent violation would raise concerns and trigger a technical sell signal. Raised fundamental concerns when it recently reported Jun '20 quarterly earnings -3% on +4% sales revenues, below the +25% minimum guideline (C criteria).
>>> FEATURED STOCK ARTICLE : Showed Resilience When Testing 50-Day Moving Average Line Again - 9/24/2020 |
View all notes |
Set NEW NOTE alert |
Company Profile |
SEC
News |
Chart |
Request a new note
C
A
S
I |
AMD
-
NASDAQ
Advanced Micro Devices
ELECTRONICS - Semiconductor - Broad Line
|
$84.48
|
-1.67
-1.94% |
$87.25
|
52,635,906
86.91% of 50 DAV
50 DAV is 60,566,000
|
$94.28
-10.39%
|
8/31/2020
|
$90.42
|
PP = $87.39
|
|
MB = $91.76
|
Most Recent Note - 10/5/2020 5:21:10 PM
G - Rebounding toward its prior high after finding prompt support near its 50 DMA line ($80.97). Any deterioration below the 50 DMA line and the recent low ($73.85 on 9/18/20) would raise greater concerns and trigger more worrisome technical sell signals. It has not formed a sound base of sufficient length and faces some resistance due to overhead supply up to the $94 level. Fundamentals remain strong.
>>> FEATURED STOCK ARTICLE : Rebound Above 50-Day Average With Light Volume Helped Stance - 9/28/2020 |
View all notes |
Set NEW NOTE alert |
Company Profile |
SEC
News |
Chart |
Request a new note
C
A
S
I |
TREX
-
NYSE
Trex Company Inc
MATERIALS and CONSTRUCTION - General Building Materials
|
$76.05
|
-0.53
-0.69% |
$78.61
|
714,974
73.33% of 50 DAV
50 DAV is 975,000
|
$78.32
-2.90%
|
6/26/2020
|
$54.53
|
PP = $66.47
|
|
MB = $69.79
|
Most Recent Note - 10/5/2020 5:18:28 PM
G - Posted a 4th consecutive gain today with below average volume for a 2nd best ever close. Recently rebounding well above its 50 DMA line ($70.94) helping its outlook to improve. Any losses below the 50 DMA line or recent low ($63.32 on 9/21/20) would raise concerns and trigger technical sell signals. Do not be confused by the 2:1 share split effective 9/15/20 (Featured Price, Pivot Point, and Max Buy prices have been adjusted accordingly). Fundamentals remain strong. See the latest FSU analysis for more details and an annotated graph.
>>> FEATURED STOCK ARTICLE : TREX Rebounded Above 50-Day Moving Average - 9/30/2020 |
View all notes |
Set NEW NOTE alert |
Company Profile |
SEC
News |
Chart |
Request a new note
C
A
S
I |
NFLX
-
NASDAQ
Netflix Inc
SPECIALTY RETAIL - Music and Video Stores
|
$505.87
|
-14.78
-2.84% |
$521.82
|
4,176,230
72.92% of 50 DAV
50 DAV is 5,727,000
|
$575.37
-12.08%
|
9/1/2020
|
$547.45
|
PP = $575.47
|
|
MB = $604.24
|
 Most Recent Note - 10/6/2020 9:08:16 PM
G - Volume totals have been cooling while consolidating above its 50 DMA line ($497). Faces near-term resistance at prior highs. The 50 DMA and recent low ($458.60 on 9/18/20) define important near term support where any further deterioration would raise more serious concerns.
>>> FEATURED STOCK ARTICLE : Quiet Rebound Meeting Resistance at 50-Day Moving Average - 9/29/2020 |
View all notes |
Set NEW NOTE alert |
Company Profile |
SEC
News |
Chart |
Request a new note
C
A
S
I |
Symbol/Exchange
Company Name
Industry Group |
PRICE |
CHANGE
(%Change) |
Day High |
Volume
(% DAV)
(% 50 day avg vol) |
52 Wk Hi
% From Hi |
Featured
Date |
Price
Featured |
Pivot Featured |
|
Max Buy |
LGIH
-
NASDAQ
L G I Homes Inc
Bldg-Resident/Comml
|
$122.58
|
-4.18
-3.30% |
$130.44
|
276,008
93.88% of 50 DAV
50 DAV is 294,000
|
$131.95
-7.10%
|
10/1/2020
|
$123.17
|
PP = $124.04
|
|
MB = $130.24
|
Most Recent Note - 10/6/2020 9:07:12 PM
Y - Pulled back today after 4 consecutive gains into new high territory. Color code was recently changed to yellow with new pivot point cited based on its 8/04/20 high plus 10 cents. Subsequent gains above the pivot point backed by at least +40% above average volume are still needed to trigger a new (or add-on) technical buy signal. Recent rebound above its 50 DMA line ($113.76) helped its outlook to improve. Any losses below the 50 DMA line and latest low ($101.30 on 9/21/20) would raise greater concerns and trigger worrisome technical sell signals. Reported Jun '20 quarterly earnings +21% on +4% sales revenues, breaking a streak of 4 comparisons above the +25% minimum guideline (C criteria).
>>> FEATURED STOCK ARTICLE : New Base Formed by Strong Homebuilder - 10/1/2020 |
View all notes |
Set NEW NOTE alert |
Company Profile |
SEC
News |
Chart |
Request a new note
C
A
S
I |
NOW
-
NYSE
Servicenow Inc
Computer Sftwr-Enterprse
|
$491.54
|
-10.25
-2.04% |
$502.60
|
1,075,299
67.37% of 50 DAV
50 DAV is 1,596,000
|
$502.63
-2.21%
|
8/20/2020
|
$453.34
|
PP = $454.79
|
|
MB = $477.53
|
Most Recent Note - 10/5/2020 5:16:49 PM
G - Posted a gain today with light volume for a best-ever close. Found support at its 50 DMA line ($457.50) but did not form a new base of sufficient length. Fundamentals remain strong. Any losses below the 50 DMA line and prior low ($432.85 on 9/08/20) would raise concerns and trigger technical sell signals.
>>> FEATURED STOCK ARTICLE : Gain Back Above "Max Buy" Level for ServiceNow - 9/25/2020 |
View all notes |
Set NEW NOTE alert |
Company Profile |
SEC
News |
Chart |
Request a new note
C
A
S
I |
VEEV
-
NYSE
Veeva Systems Inc Cl A
Computer Sftwr-Medical
|
$285.88
|
+7.43
2.67% |
$291.42
|
1,152,499
148.14% of 50 DAV
50 DAV is 778,000
|
$298.76
-4.31%
|
10/6/2020
|
$287.71
|
PP = $298.86
|
|
MB = $313.80
|
Most Recent Note - 10/6/2020 9:05:42 PM
Y - Color code was changed to yellow with new pivot point cited based on its 9/02/20 high plus 10 cents. Found support at its its 50 DMA line ($269.66) while forming a 5-week flat base. Subsequent gains above the pivot point backed by at least +40% above average volume may trigger a technical buy signal. Any losses below the 50 DMA line and recent lows would raise concerns and trigger technical sell signals. Reported earnings +31% on +33% sales revenues for the Jul '20 quarter versus the year ago period. Three of the past 4 quarterly comparisons were above the +25% minimum earnings guideline (C criteria). See the latest FSU analysis for more details and a new annotated graph.
>>> FEATURED STOCK ARTICLE : First Sound Base Being Built After Considerable Rally - 10/6/2020 |
View all notes |
Set NEW NOTE alert |
Company Profile |
SEC
News |
Chart |
Request a new note
C
A
S
I |
|
|
|
THESE ARE NOT BUY RECOMMENDATIONS!
Comments contained in the body of this report are technical
opinions only. The material herein has been obtained
from sources believed to be reliable and accurate, however,
its accuracy and completeness cannot be guaranteed.
This site is not an investment advisor, hence it does
not endorse or recommend any securities or other investments.
Any recommendation contained in this report may not
be suitable for all investors and it is not to be deemed
an offer or solicitation on our part with respect to
the purchase or sale of any securities. All trademarks,
service marks and trade names appearing in this report
are the property of their respective owners, and are
likewise used for identification purposes only.
This report is a service available
only to active Paid Premium Members.
You may opt-out of receiving report notifications
at any time. Questions or comments may be submitted
by writing to Premium Membership Services 665 S.E. 10 Street, Suite 201 Deerfield Beach, FL 33441-5634 or by calling 1-800-965-8307
or 954-785-1121.
|
|
|