You are not logged in.
This means you
CAN ONLY VIEW reports that were published prior to Sunday, February 25, 2024.
You
MUST UPGRADE YOUR MEMBERSHIP if you want to see any current reports.
AFTER MARKET UPDATE - MONDAY, OCTOBER 5TH, 2020
Previous After Market Report Next After Market Report >>>
|
|
|
|
DOW |
+465.83 |
28,148.64 |
+1.68% |
|
Volume |
851,060,844 |
-6% |
|
Volume |
3,558,242,000 |
-4% |
|
NASDAQ |
+257.47 |
11,332.49 |
+2.32% |
|
Advancers |
2,255 |
75% |
|
Advancers |
2,581 |
74% |
|
S&P 500 |
+60.18 |
3,408.62 |
+1.80% |
|
Decliners |
763 |
25% |
|
Decliners |
891 |
26% |
|
Russell 2000 |
+42.67 |
1,581.96 |
+2.77% |
|
52 Wk Highs |
119 |
|
|
52 Wk Highs |
128 |
|
|
S&P 600 |
+19.86 |
896.44 |
+2.27% |
|
52 Wk Lows |
22 |
|
|
52 Wk Lows |
22 |
|
|
The major indices have shown improvement and have resumed a market uptrend as leadership has improved. Disciplined investors carefully may buy leading stocks on a case-by-case basis. Always remain ready to reduce market exposure in the event of any more substantial market downdrafts.
|
 |
Major Indices Rose With Positive Breadth and Greater Leadership
Kenneth J. Gruneisen - Passed the CAN SLIM® Master's Exam
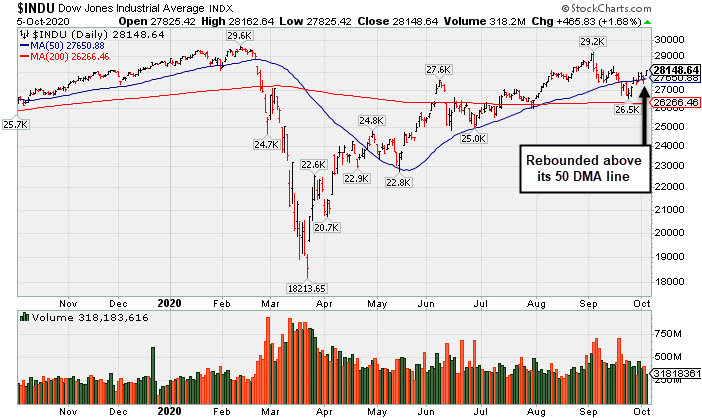
The Dow advanced 465 points, while the S&P 500 climbed 1.8%. The Nasdaq Composite rallied 2.3%. The reported volume totals were lighter than the prior session on the NYSE and on the Nasdaq exchange, revealing lackluster institutional buying demand. Breadth was positive as advancers led decliners by a 3-1 margin on the NYSE and nearly 3-1 on the Nasdaq exchange. Leadership improved as there were 72 high-ranked companies from the Leaders List that hit new 52-week highs and were listed on the BreakOuts Page, versus the total of 38 on the prior session. New 52-week highs totals expanded and easily outnumbered shrinking new 52-week lows totals on the NYSE and on the Nasdaq exchange. The major indices appear to have avoided a more serious market correction and have shifted back to a confirmed uptrend (M criteria). New buying efforts may be justified in leading stocks on a case-by-case basis.
PICTURED: The Dow Jones Industrial Average has rebounded above its 50-day moving average (DMA) line. Recent technical improvement was coupled with an expansion in leadership (stocks hitting new 52-week highs). Last Wednesday's session was considered a sufficient follow-through day by the Dow Jones Industrial Average to shift the market direction (M criteria) back to a confirmed uptrend.
Stocks finished near session highs on Monday as political risks appeared to wane. Renewed hopes for a bipartisan fiscal stimulus plan buoyed investor sentiment. Reports showed that House Speaker Nancy Pelosi and Treasury Secretary Steven Mnuchin ended an hour-long conversation with plans to continue negotiations for a coronavirus relief package on Tuesday.
Positive updates on President Trump’s COVID-19 prognosis further lifted the mood. The medical team at Walter Reed Medical Center confirmed an earlier announcement that the president would be discharged from the hospital later today. Elsewhere, indications that Democratic presidential nominee Joe Biden has widened his lead in the polls is reducing concern over the possibility of a contested November election. On the data front, an update from the Institute for Supply Management (ISM) showed U.S. services sector activity unexpectedly accelerated in September. Treasuries weakened, with the yield on the benchmark 10-year note jumping eight basis points to 0.77%.
All 11 S&P 500 sectors ended in positive territory, with nine groups adding more than 1%. Energy stocks paced the gains, with WTI crude rebounding from a three-week low with its best one-day jump since May. In corporate news, Regeneron Pharmaceuticals (REGN +7.13%) following reports that President Trump had received the company’s experimental antibody drug cocktail on Friday, while the drugmaker was also the subject of a Wall Street rating upgrade. In the M&A space, MyoKardia (MYOK +57.84%) rose after the biotech company agreed to be purchased by Bristol-Myers Squibb (BMY +0.82%) for $13.1 billion. |
 Kenneth J. Gruneisen started out as a licensed stockbroker in August 1987, a couple of months prior to the historic stock market crash that took the Dow Jones Industrial Average down -22.6% in a single day. He has published daily fact-based fundamental and technical analysis on high-ranked stocks online for two decades. Through FACTBASEDINVESTING.COM, Kenneth provides educational articles, news, market commentary, and other information regarding proven investment systems that work in good times and bad.
Comments contained in the body of this report are technical opinions only and are not necessarily those of Gruneisen Growth Corp. The material herein has been obtained from sources believed to be reliable and accurate, however, its accuracy and completeness cannot be guaranteed. Our firm, employees, and customers may effect transactions, including transactions contrary to any recommendation herein, or have positions in the securities mentioned herein or options with respect thereto. Any recommendation contained in this report may not be suitable for all investors and it is not to be deemed an offer or solicitation on our part with respect to the purchase or sale of any securities. |
|
 |
Retail, Financial, Tech, and Commodity-Linked Groups Rose
Kenneth J. Gruneisen - Passed the CAN SLIM® Master's Exam
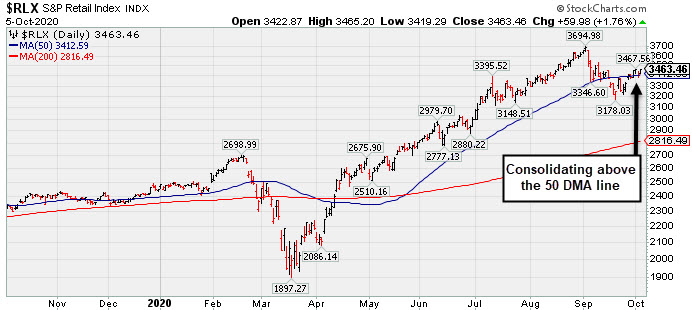
The Retail Index ($RLX +1.76%) and financials helped boost the major indices as the Broker/Dealer Index ($XBD +1.56%) and Bank Index ($BKX +3.08%) each notched solid gains. The tech sector had a positive bias as the Biotech Index ($BTK +3.78%), Semiconductor Index ($SOX +3.35%), and Networking Index ($NWX +2.59%) posted unanimous gains. Commodity-linked groups also rose as the Oil Services Index ($OSX +3.01%) and Integrated Oil Index ($XOI +3.11%) both outpaced the Gold & Silver Index ($XAU +1.92%). PICTURED: The Retail Index ($RLX +1.76%) is consolidating above its 50-day moving average (DMA) line.
| Oil Services |
$OSX |
28.73 |
+0.84 |
+3.01% |
-63.31% |
| Integrated Oil |
$XOI |
611.36 |
+18.46 |
+3.11% |
-51.88% |
| Semiconductor |
$SOX |
2,295.56 |
+74.44 |
+3.35% |
+24.11% |
| Networking |
$NWX |
546.76 |
+13.80 |
+2.59% |
-6.28% |
| Broker/Dealer |
$XBD |
289.31 |
+4.46 |
+1.56% |
-0.37% |
| Retail |
$RLX |
3,463.46 |
+59.98 |
+1.76% |
+41.41% |
| Gold & Silver |
$XAU |
145.58 |
+2.74 |
+1.92% |
+36.16% |
| Bank |
$BKX |
77.03 |
+2.30 |
+3.08% |
-32.05% |
| Biotech |
$BTK |
5,481.74 |
+199.61 |
+3.78% |
+8.18% |
|
|
|
 |
Featured Stocks
Kenneth J. Gruneisen - Passed the CAN SLIM® Master's Exam
|
|
|
Color Codes Explained :
Y - Better candidates highlighted by our
staff of experts.
G - Previously featured
in past reports as yellow but may no longer be buyable under the
guidelines.
***Last / Change / Volume data in this table is the closing quote data***
Symbol/Exchange
Company Name
Industry Group |
PRICE |
CHANGE
(%Change) |
Day High |
Volume
(% DAV)
(% 50 day avg vol) |
52 Wk Hi
% From Hi |
Featured
Date |
Price
Featured |
Pivot Featured |
|
Max Buy |
 ADBE
-
NASDAQ
ADBE
-
NASDAQ
Adobe Inc
COMPUTER SOFTWARE and SERVICES - Application Software
|
$486.47
|
+7.48
1.56% |
$486.69
|
1,967,037
63.74% of 50 DAV
50 DAV is 3,086,000
|
$536.88
-9.39%
|
9/10/2020
|
$488.46
|
PP = $536.88
|
|
MB = $563.72
|
 Most Recent Note - 10/5/2020 5:25:30 PM
G - Volume totals have been cooling while consolidating above its 50 DMA line ($473.85). More damaging losses below the 50 DMA would raise greater concerns. Faces near-term resistance due to overhead supply up to the $536 level. Fundamentals remain strong.
>>> FEATURED STOCK ARTICLE : Light Volume Loss Falling Near 50-Day Moving Average Line Again - 9/23/2020 |
View all notes |
Set NEW NOTE alert |
Company Profile |
SEC
News |
Chart |
Request a new note
C
A
S
I |
CRL
-
NYSE
Charles River Labs Intl
DRUGS - Biotechnology
|
$234.97
|
+6.10
2.67% |
$235.99
|
209,836
65.78% of 50 DAV
50 DAV is 319,000
|
$231.97
1.29%
|
7/15/2020
|
$192.66
|
PP = $189.95
|
|
MB = $199.45
|
Most Recent Note - 10/5/2020 5:14:42 PM
G - Posted a big gain with -34% below average volume today for a new all-time high. Found prompt support at its 50 DMA line ($215.51) where any subsequent violation would raise concerns and trigger a technical sell signal. Raised fundamental concerns when it recently reported Jun '20 quarterly earnings -3% on +4% sales revenues, below the +25% minimum guideline (C criteria).
>>> FEATURED STOCK ARTICLE : Showed Resilience When Testing 50-Day Moving Average Line Again - 9/24/2020 |
View all notes |
Set NEW NOTE alert |
Company Profile |
SEC
News |
Chart |
Request a new note
C
A
S
I |
AMD
-
NASDAQ
Advanced Micro Devices
ELECTRONICS - Semiconductor - Broad Line
|
$86.15
|
+4.35
5.32% |
$86.28
|
46,710,336
73.29% of 50 DAV
50 DAV is 63,731,000
|
$94.28
-8.62%
|
8/31/2020
|
$90.42
|
PP = $87.39
|
|
MB = $91.76
|
Most Recent Note - 10/5/2020 5:21:10 PM
G - Rebounding toward its prior high after finding prompt support near its 50 DMA line ($80.97). Any deterioration below the 50 DMA line and the recent low ($73.85 on 9/18/20) would raise greater concerns and trigger more worrisome technical sell signals. It has not formed a sound base of sufficient length and faces some resistance due to overhead supply up to the $94 level. Fundamentals remain strong.
>>> FEATURED STOCK ARTICLE : Rebound Above 50-Day Average With Light Volume Helped Stance - 9/28/2020 |
View all notes |
Set NEW NOTE alert |
Company Profile |
SEC
News |
Chart |
Request a new note
C
A
S
I |
TREX
-
NYSE
Trex Company Inc
MATERIALS and CONSTRUCTION - General Building Materials
|
$76.58
|
+2.85
3.87% |
$76.83
|
856,987
88.08% of 50 DAV
50 DAV is 973,000
|
$78.32
-2.22%
|
6/26/2020
|
$54.53
|
PP = $66.47
|
|
MB = $69.79
|
Most Recent Note - 10/5/2020 5:18:28 PM
G - Posted a 4th consecutive gain today with below average volume for a 2nd best ever close. Recently rebounding well above its 50 DMA line ($70.94) helping its outlook to improve. Any losses below the 50 DMA line or recent low ($63.32 on 9/21/20) would raise concerns and trigger technical sell signals. Do not be confused by the 2:1 share split effective 9/15/20 (Featured Price, Pivot Point, and Max Buy prices have been adjusted accordingly). Fundamentals remain strong. See the latest FSU analysis for more details and an annotated graph.
>>> FEATURED STOCK ARTICLE : TREX Rebounded Above 50-Day Moving Average - 9/30/2020 |
View all notes |
Set NEW NOTE alert |
Company Profile |
SEC
News |
Chart |
Request a new note
C
A
S
I |
NFLX
-
NASDAQ
Netflix Inc
SPECIALTY RETAIL - Music and Video Stores
|
$520.65
|
+17.59
3.50% |
$520.99
|
4,026,536
69.41% of 50 DAV
50 DAV is 5,801,000
|
$575.37
-9.51%
|
9/1/2020
|
$547.45
|
PP = $575.47
|
|
MB = $604.24
|
Most Recent Note - 10/5/2020 5:22:36 PM
G - Consolidating above its 50 DMA line ($497). Faces near-term resistance at prior highs. The 50 DMA and recent low ($458.60 on 9/18/20) define important near term support where any further deterioration would raise more serious concerns.
>>> FEATURED STOCK ARTICLE : Quiet Rebound Meeting Resistance at 50-Day Moving Average - 9/29/2020 |
View all notes |
Set NEW NOTE alert |
Company Profile |
SEC
News |
Chart |
Request a new note
C
A
S
I |
Symbol/Exchange
Company Name
Industry Group |
PRICE |
CHANGE
(%Change) |
Day High |
Volume
(% DAV)
(% 50 day avg vol) |
52 Wk Hi
% From Hi |
Featured
Date |
Price
Featured |
Pivot Featured |
|
Max Buy |
LGIH
-
NASDAQ
L G I Homes Inc
Bldg-Resident/Comml
|
$126.76
|
+0.56
0.44% |
$131.95
|
382,307
131.38% of 50 DAV
50 DAV is 291,000
|
$127.59
-0.65%
|
10/1/2020
|
$123.17
|
PP = $124.04
|
|
MB = $130.24
|
Most Recent Note - 10/5/2020 12:35:10 PM
Y - Reversed into the red today after early gains into new high territory. Color code was recently changed to yellow with new pivot point cited based on its 8/04/20 high plus 10 cents. Subsequent gains above the pivot point backed by at least +40% above average volume are still needed to trigger a new (or add-on) technical buy signal. Recent rebound above its 50 DMA line ($113.76) helped its outlook to improve. Any losses below the 50 DMA line and latest low ($101.30 on 9/21/20) would raise greater concerns and trigger worrisome technical sell signals. Reported Jun '20 quarterly earnings +21% on +4% sales revenues, breaking a streak of 4 comparisons above the +25% minimum guideline (C criteria). See the latest FSU analysis for more details and ann annotated graph.
>>> FEATURED STOCK ARTICLE : New Base Formed by Strong Homebuilder - 10/1/2020 |
View all notes |
Set NEW NOTE alert |
Company Profile |
SEC
News |
Chart |
Request a new note
C
A
S
I |
NOW
-
NYSE
Servicenow Inc
Computer Sftwr-Enterprse
|
$501.79
|
+8.64
1.75% |
$502.23
|
1,236,425
77.71% of 50 DAV
50 DAV is 1,591,000
|
$502.63
-0.17%
|
8/20/2020
|
$453.34
|
PP = $454.79
|
|
MB = $477.53
|
Most Recent Note - 10/5/2020 5:16:49 PM
G - Posted a gain today with light volume for a best-ever close. Found support at its 50 DMA line ($457.50) but did not form a new base of sufficient length. Fundamentals remain strong. Any losses below the 50 DMA line and prior low ($432.85 on 9/08/20) would raise concerns and trigger technical sell signals.
>>> FEATURED STOCK ARTICLE : Gain Back Above "Max Buy" Level for ServiceNow - 9/25/2020 |
View all notes |
Set NEW NOTE alert |
Company Profile |
SEC
News |
Chart |
Request a new note
C
A
S
I |
|
|
|
THESE ARE NOT BUY RECOMMENDATIONS!
Comments contained in the body of this report are technical
opinions only. The material herein has been obtained
from sources believed to be reliable and accurate, however,
its accuracy and completeness cannot be guaranteed.
This site is not an investment advisor, hence it does
not endorse or recommend any securities or other investments.
Any recommendation contained in this report may not
be suitable for all investors and it is not to be deemed
an offer or solicitation on our part with respect to
the purchase or sale of any securities. All trademarks,
service marks and trade names appearing in this report
are the property of their respective owners, and are
likewise used for identification purposes only.
This report is a service available
only to active Paid Premium Members.
You may opt-out of receiving report notifications
at any time. Questions or comments may be submitted
by writing to Premium Membership Services 665 S.E. 10 Street, Suite 201 Deerfield Beach, FL 33441-5634 or by calling 1-800-965-8307
or 954-785-1121.
|
|
|