You are not logged in.
This means you
CAN ONLY VIEW reports that were published prior to Sunday, February 18, 2024.
You
MUST UPGRADE YOUR MEMBERSHIP if you want to see any current reports.
AFTER MARKET UPDATE - FRIDAY, OCTOBER 4TH, 2019
Previous After Market Report Next After Market Report >>>
|
|
|
|
DOW |
+372.68 |
26,573.72 |
+1.42% |
|
Volume |
720,259,630 |
-10% |
|
Volume |
1,734,843,520 |
-18% |
|
NASDAQ |
+110.21 |
7,982.47 |
+1.40% |
|
Advancers |
2,098 |
74% |
|
Advancers |
2,064 |
67% |
|
S&P 500 |
+41.38 |
2,952.01 |
+1.42% |
|
Decliners |
723 |
26% |
|
Decliners |
1,004 |
33% |
|
Russell 2000 |
+14.36 |
1,500.70 |
+0.97% |
|
52 Wk Highs |
70 |
|
|
52 Wk Highs |
20 |
|
|
S&P 600 |
+9.35 |
930.46 |
+1.02% |
|
52 Wk Lows |
32 |
|
|
52 Wk Lows |
69 |
|
|
 |
Major Indices Rallied With Less Volume Behind Gains
Kenneth J. Gruneisen - Passed the CAN SLIM® Master's Exam
The Dow jumped 372 points, trimming its weekly retreat to 0.9%. The S&P 500 climbed 1.4%, but notched its third consecutive weekly loss with a 0.3% decline. The Nasdaq Composite gained 1.4%, flipping its weekly performance into positive territory with a 0.5% advance. Volume totals reported were lower than the prior session on the NYSE and on the Nasdaq exchange, revealing lackluster institutional buying demand. Breadth was positive as advancers led decliners by a 2-1 margin on the Nasdaq exchange and by nearly 3-1 on the NYSE. There were 13 high-ranked companies from the Leaders List that hit a new 52-week high and were listed on the BreakOuts Page, versus the total of 2 on the prior session. New 52-week lows outnumbered new 52-week highs on the Nasdaq exchange while new highs outnumbered new lows on the NYSE. The uptrend for the major indices (M criteria) has recently come under greater pressure, having the look of a more serious correction. Disciplined investors know to reduce exposure to stocks during market corrections. The Featured Stocks Page provides the most timely analysis on high-ranked leaders. Charts used courtesy of www.stockcharts.com
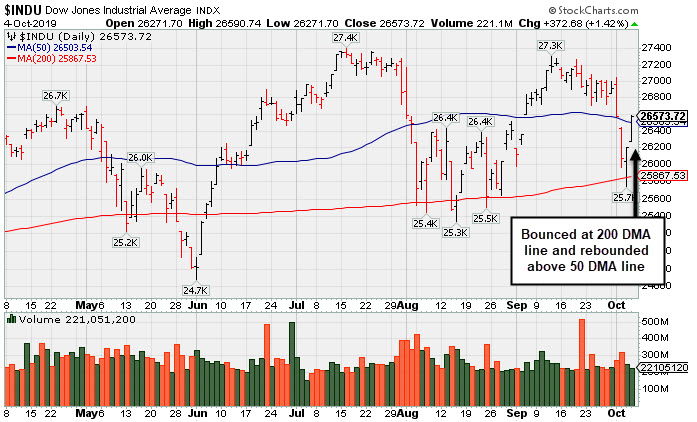
PICTURED: The S&P 500 Index's prior low and its 200-day moving average (DMA) line define important near-term support to watch. More damaging losses may bode poorly for the market outlook. Meanwhile, it remains perched only -3.9% off its record high.
Stocks finished firmly higher Friday as investors assessed the monthly jobs report. The major averages rallied after the Labor Department revealed non-farm payrolls increased by 136,000 in September, just below analyst projections of 145,000. Average hourly earnings were flat month-over-month in September, missing expectations of a 0.3% advance. Additionally, the unemployment rate dipped to a 50-year low of 3.5%. Investor sentiment was buoyed after the so-called “Goldilocks” release dampened recessionary concerns, but still supported expectations for another Federal Reserve rate cut later this month. Market participants also weighed comments from Fed Chair Jerome Powell, who reiterated the U.S. economy “faces some risks” but is “in a good place.” Treasuries were mixed, with the yield on the 10-year note off one basis points to 1.52% on its seventh consecutive decline.
All 11 S&P 500 sectors ended in positive territory, with seven groups jumping more than 1%. In corporate news, Apple (AAPL +2.80%) rose amid reports the Tech giant ordered a 10% increase in production for the iPhone 11. HP (HPQ -9.57%) missed out on the broad advance, falling after the computer hardware company revealed its restructuring plan.
In commodities, WTI crude added 0.9% to $52.90/barrel, but notched a more than 5% weekly drop. COMEX gold dipped 0.1% to $1,506.30/ounce despite the U.S. dollar weakening for a fourth consecutive day.
|
 Kenneth J. Gruneisen started out as a licensed stockbroker in August 1987, a couple of months prior to the historic stock market crash that took the Dow Jones Industrial Average down -22.6% in a single day. He has published daily fact-based fundamental and technical analysis on high-ranked stocks online for two decades. Through FACTBASEDINVESTING.COM, Kenneth provides educational articles, news, market commentary, and other information regarding proven investment systems that work in good times and bad.
Comments contained in the body of this report are technical opinions only and are not necessarily those of Gruneisen Growth Corp. The material herein has been obtained from sources believed to be reliable and accurate, however, its accuracy and completeness cannot be guaranteed. Our firm, employees, and customers may effect transactions, including transactions contrary to any recommendation herein, or have positions in the securities mentioned herein or options with respect thereto. Any recommendation contained in this report may not be suitable for all investors and it is not to be deemed an offer or solicitation on our part with respect to the purchase or sale of any securities. |
|
 |
Tech, Financial, Retail, and Gold & Silver Indexes Rose
Kenneth J. Gruneisen - Passed the CAN SLIM® Master's Exam
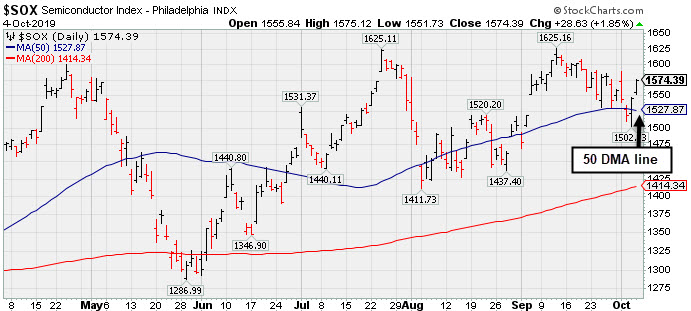
The Broker/Dealer Index ($XBD +1.54%) and the Bank Index ($BKX +1.71%) both ended the session with solid gains while outpacing the Retail Index ($RLX +0.97%) higher. The tech sector had a positive bias as the Semiconductor Index ($SOX +1.85%), and the Networking Index ($NWX +1.16%) both outpaced the Biotech Index ($BTK +0.58%) Energy-linked groups were mixed as the Oil Services Index ($OSX -0.51%) fell slightly and the Integrated Oil Index ($XOI +0.46%) rose modesty. Meanwhile, the Gold & Silver Index ($XAU +2.00%) was a standout gainer.
PICTURED: The Semiconductor Index ($SOX +1.85%) found prompt support near its 50-day moving average (DMA) line.
| Oil Services |
$OSX |
62.81 |
-0.33 |
-0.52% |
-22.07% |
| Integrated Oil |
$XOI |
1,174.83 |
+5.35 |
+0.46% |
+1.36% |
| Semiconductor |
$SOX |
1,574.39 |
+28.63 |
+1.85% |
+36.29% |
| Networking |
$NWX |
547.28 |
+6.29 |
+1.16% |
+11.99% |
| Broker/Dealer |
$XBD |
247.39 |
+3.75 |
+1.54% |
+4.24% |
| Retail |
$RLX |
2,335.78 |
+22.55 |
+0.97% |
+19.70% |
| Gold & Silver |
$XAU |
91.11 |
+1.79 |
+2.00% |
+28.94% |
| Bank |
$BKX |
97.22 |
+1.63 |
+1.71% |
+13.32% |
| Biotech |
$BTK |
4,218.04 |
+24.20 |
+0.58% |
-0.07% |
|
|
|
 |
Found Prompt Support Near 50-Day Moving Average
Kenneth J. Gruneisen - Passed the CAN SLIM® Master's Exam
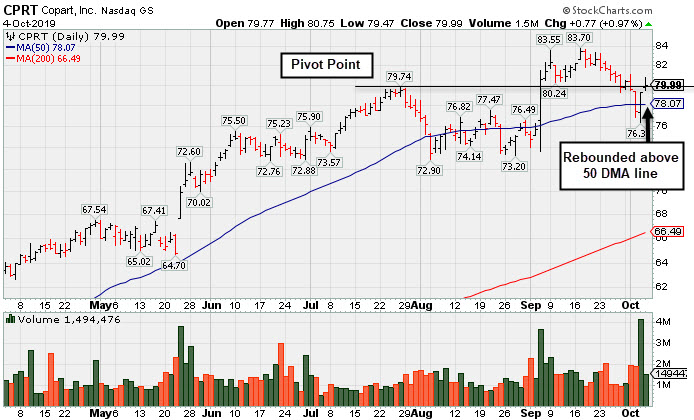
Copart Inc (CPRT +$0.77 or +0.97% to $79.99) found prompt support after a brief slump below its prior high ($79.74 on 7/26/19) and below its 50-day moving average (DMA) line ($78.06). The prompt rebound helped its outlook improve.
A volume-driven gain above the pivot point on 9/05/19 clinched a technical buy signal when CPRT was highlighted in yellow with pivot point cited based on its 7/26/19 high plus 10 cents (read here). It was last shown in this FSU session on 9/19/19 with an annotated graph under the headline, "Hovering Near All-Time High Following Recent Breakout".
Bullish action came after it reported earnings +43% on +21% sales revenues for the Jul '19 quarter. Three of the past 4 quarterly earnings increases were above the +25% minimum guideline (C criteria) and its sales revenues growth rate has accelerated. Annual earnings (A criteria) history has been strong and steady since a downturn in FY '13.
The number of top-rated funds owning its shares rose from 1,120 in Sep '18 to 1,190 in Jun '19, a reassuring sign concerning the I criteria. It has a Timeliness Rating of B and Sponsorship Rating of B.
|
|
|
Color Codes Explained :
Y - Better candidates highlighted by our
staff of experts.
G - Previously featured
in past reports as yellow but may no longer be buyable under the
guidelines.
***Last / Change / Volume data in this table is the closing quote data***
Symbol/Exchange
Company Name
Industry Group |
PRICE |
CHANGE
(%Change) |
Day High |
Volume
(% DAV)
(% 50 day avg vol) |
52 Wk Hi
% From Hi |
Featured
Date |
Price
Featured |
Pivot Featured |
|
Max Buy |
 MLR
-
NYSE
MLR
-
NYSE
Miller Industries Inc
AUTOMOTIVE - Auto Parts
|
$31.53
|
-0.65
-2.02% |
$32.51
|
34,978
102.88% of 50 DAV
50 DAV is 34,000
|
$35.26
-10.58%
|
9/24/2019
|
$34.00
|
PP = $35.36
|
|
MB = $37.13
|
 Most Recent Note - 10/4/2019 5:39:13 PM
G - Color code is changed to green after suffering a 7th consecutive loss and slumping below its 50 DMA line ($32.24). A rebound and subsequent gains above the pivot point backed by at least +40% above average volume may trigger a technical buy signal. Reported June '19 quarterly earnings +40% on +26% sales revenues versus the year ago period, and 3 of the past 4 comparisons were above the +25% minimum earnings guideline (C criteria).
>>> FEATURED STOCK ARTICLE : Encountered Distributional Pressure After Challenging Prior High - 9/24/2019 |
View all notes |
Set NEW NOTE alert |
Company Profile |
SEC
News |
Chart |
Request a new note
C
A
S
I |
CCBG
-
NASDAQ
Capital City Bk Gp
BANKING - Regional - Mid-Atlantic Banks
|
$26.93
|
+0.43
1.62% |
$26.93
|
17,647
63.03% of 50 DAV
50 DAV is 28,000
|
$28.00
-3.82%
|
9/13/2019
|
$27.03
|
PP = $27.05
|
|
MB = $28.40
|
Most Recent Note - 10/4/2019 5:31:09 PM
Y - Hovering near its 52-week high. Prior highs define initial support to watch above its 50 DMA line ($25.48).
>>> FEATURED STOCK ARTICLE : Stalled After Recent Rally for New High - 9/27/2019 |
View all notes |
Set NEW NOTE alert |
Company Profile |
SEC
News |
Chart |
Request a new note
C
A
S
I |
EPAM
-
NYSE
Epam Systems Inc
COMPUTER SOFTWARE and SERVICES - Information Technology Service
|
$188.91
|
+4.61
2.50% |
$189.01
|
334,072
95.45% of 50 DAV
50 DAV is 350,000
|
$201.00
-6.01%
|
5/9/2019
|
$169.25
|
PP = $180.55
|
|
MB = $189.58
|
Most Recent Note - 10/4/2019 5:36:37 PM
G - Rebounded above its 50 DMA line ($187.33) helping its outlook to improve. Faces resistance due to overhead supply up to the $201 level. Prior lows in the $174-175 area define the next important support level. Reported earnings +27% on +24% sales revenues for the Jun '19 quarter.
>>> FEATURED STOCK ARTICLE : Slumped and Sputtered Below 50-Day Moving Average - 9/30/2019 |
View all notes |
Set NEW NOTE alert |
Company Profile |
SEC
News |
Chart |
Request a new note
C
A
S
I |
AUDC
-
NASDAQ
Audiocodes Ltd
ELECTRONICS - Scientific and Technical Instrum
|
$19.06
|
+0.59
3.19% |
$19.39
|
321,507
151.65% of 50 DAV
50 DAV is 212,000
|
$22.50
-15.29%
|
9/13/2019
|
$19.68
|
PP = $19.84
|
|
MB = $20.83
|
Most Recent Note - 10/4/2019 5:41:28 PM
Y - Rebounded above its 50 DMA line ($18.55) promptly helping its outlook improve and the color code is changed to yellow. See the latest FSU analysis for more details and an annotated graph.
>>> FEATURED STOCK ARTICLE : Sank Below 50-Day Average as 7 Straight Losses Follow Reversal - 10/2/2019 |
View all notes |
Set NEW NOTE alert |
Company Profile |
SEC
News |
Chart |
Request a new note
C
A
S
I |
CHDN
-
NASDAQ
Churchill Downs Inc
LEISURE - Gaming Activities
|
$128.34
|
+4.23
3.41% |
$128.56
|
220,142
96.13% of 50 DAV
50 DAV is 229,000
|
$132.73
-3.31%
|
7/22/2019
|
$118.45
|
PP = $118.89
|
|
MB = $124.83
|
Most Recent Note - 10/4/2019 5:33:06 PM
G - Posted a big gain on near average volume rallying for a best-ever close above its "max buy" level and its color code is changed to green. Found support when consolidating near its 50 DMA line ($122). That important short-term average has acted as support in recent weeks during its consolidation. Prior lows define the next important support to watch. Jun '19 earnings +10% on +26% sales revenues versus the year ago period were below the +25% minimum earnings guideline (C criteria), noted recently raising fundamental concerns.
>>> FEATURED STOCK ARTICLE : Consolidating Above 50-Day Moving Average Line - 9/20/2019 |
View all notes |
Set NEW NOTE alert |
Company Profile |
SEC
News |
Chart |
Request a new note
C
A
S
I |
Symbol/Exchange
Company Name
Industry Group |
PRICE |
CHANGE
(%Change) |
Day High |
Volume
(% DAV)
(% 50 day avg vol) |
52 Wk Hi
% From Hi |
Featured
Date |
Price
Featured |
Pivot Featured |
|
Max Buy |
LULU
-
NASDAQ
Lululemon Athletica
MANUFACTURING - Textile Manufacturing
|
$193.12
|
+2.97
1.56% |
$193.43
|
1,196,853
67.20% of 50 DAV
50 DAV is 1,781,000
|
$204.44
-5.54%
|
9/6/2019
|
$201.25
|
PP = $194.35
|
|
MB = $204.07
|
Most Recent Note - 10/3/2019 5:31:05 PM
Y - Found support after undercutting its 50 DMA line ($187.12) today. Recently sputtering below the prior high ($194.25) raising concerns. More damaging losses would raise serious concerns and trigger a technical sell signal. See the latest FSU analysis for more details and a new annotated graph.
>>> FEATURED STOCK ARTICLE : Found Support After Undercutting 50-Day Moving Average - 10/3/2019 |
View all notes |
Set NEW NOTE alert |
Company Profile |
SEC
News |
Chart |
Request a new note
C
A
S
I |
CPRT
-
NASDAQ
Copart Inc
SPECIALTY RETAIL - Auto Dealerships
|
$79.99
|
+0.77
0.97% |
$80.75
|
1,494,476
102.01% of 50 DAV
50 DAV is 1,465,000
|
$83.70
-4.43%
|
9/5/2019
|
$79.13
|
PP = $79.84
|
|
MB = $83.83
|
Most Recent Note - 10/4/2019 5:28:26 PM
G - Found prompt support and rebounded above its 50 DMA line ($78.06) and back above its pivot point helping its outlook improve. See the latest FSU analysis for more details and a new annotated graph.
>>> FEATURED STOCK ARTICLE : Found Prompt Support Near 50-Day Moving Average - 10/4/2019 |
View all notes |
Set NEW NOTE alert |
Company Profile |
SEC
News |
Chart |
Request a new note
C
A
S
I |
PFPT
-
NASDAQ
Proofpoint Inc
Computer Sftwr-Security
|
$128.79
|
-0.04
-0.03% |
$130.30
|
782,902
113.79% of 50 DAV
50 DAV is 688,000
|
$133.00
-3.17%
|
10/1/2019
|
$129.59
|
PP = $132.95
|
|
MB = $139.60
|
Most Recent Note - 10/1/2019 5:45:14 PM
Y - Finished the session lower after highlighted in yellow with pivot point cited based on its 7/26/19 high. Reversed into the red after touching a new all-time high today. Met stubborn resistance in the $132 area in recent months. Subsequent gains above the pivot point backed by at least +40% above average volume may trigger a technical buy signal. Prior mid-day reports noted - "Three of the past 4 quarterly comparisons through Jun '19 were above the +25% minimum earnings guideline (C criteria). Annual earnings (A criteria) history has been strong since turning profitable in FY '16 ". See the latest FSU analysis for more details and a new annotated graph.
>>> FEATURED STOCK ARTICLE : Challenging Previously Stubborn Resistance - 10/1/2019 |
View all notes |
Set NEW NOTE alert |
Company Profile |
SEC
News |
Chart |
Request a new note
C
A
S
I |
BLD
-
NYSE
Topbuild Corp
Bldg-Constr Prds/Misc
|
$96.60
|
+3.44
3.69% |
$97.37
|
242,334
81.32% of 50 DAV
50 DAV is 298,000
|
$97.99
-1.42%
|
5/17/2019
|
$82.19
|
PP = $87.31
|
|
MB = $91.68
|
Most Recent Note - 10/4/2019 5:34:58 PM
G - Posted a quiet gain, staying above its 50 DMA line and challenging its all-time high. It is extended from the prior base after wedging higher with gains lacking great volume conviction. Earnings rose +39% on +9% sales revenues for the Jun '19 quarter versus the year ago period. Its 50 DMA line ($91.26) defines important support to watch along with its prior low ($86.53 on 8/28/19).
>>> FEATURED STOCK ARTICLE : Perched Near Record High, Extended From Prior Base - 9/23/2019 |
View all notes |
Set NEW NOTE alert |
Company Profile |
SEC
News |
Chart |
Request a new note
C
A
S
I |
PAGS
-
NYSE
Pagseguro Digital Cl A
Finance-CrdtCard/PmtPr
|
$46.16
|
+1.11
2.46% |
$46.29
|
808,171
43.29% of 50 DAV
50 DAV is 1,867,000
|
$53.43
-13.61%
|
6/25/2019
|
$37.69
|
PP = $40.07
|
|
MB = $42.07
|
Most Recent Note - 10/2/2019 7:43:13 PM
G - Slumped further below its 50 DMA line ($47.44) with a big loss today backed by above average volume. Testing prior lows in the $42-43 area noted as important near-term chart support to watch where violations may trigger a worrisome technical sell signal. Fundamentals are strong.
>>> FEATURED STOCK ARTICLE : Recent Lows Define Important Near-Term Support While Consolidating - 9/25/2019 |
View all notes |
Set NEW NOTE alert |
Company Profile |
SEC
News |
Chart |
Request a new note
C
A
S
I |
Symbol/Exchange
Company Name
Industry Group |
PRICE |
CHANGE
(%Change) |
Day High |
Volume
(% DAV)
(% 50 day avg vol) |
52 Wk Hi
% From Hi |
Featured
Date |
Price
Featured |
Pivot Featured |
|
Max Buy |
|
|
|
THESE ARE NOT BUY RECOMMENDATIONS!
Comments contained in the body of this report are technical
opinions only. The material herein has been obtained
from sources believed to be reliable and accurate, however,
its accuracy and completeness cannot be guaranteed.
This site is not an investment advisor, hence it does
not endorse or recommend any securities or other investments.
Any recommendation contained in this report may not
be suitable for all investors and it is not to be deemed
an offer or solicitation on our part with respect to
the purchase or sale of any securities. All trademarks,
service marks and trade names appearing in this report
are the property of their respective owners, and are
likewise used for identification purposes only.
This report is a service available
only to active Paid Premium Members.
You may opt-out of receiving report notifications
at any time. Questions or comments may be submitted
by writing to Premium Membership Services 665 S.E. 10 Street, Suite 201 Deerfield Beach, FL 33441-5634 or by calling 1-800-965-8307
or 954-785-1121.
|
|
|