You are not logged in.
This means you
CAN ONLY VIEW reports that were published prior to Tuesday, February 20, 2024.
You
MUST UPGRADE YOUR MEMBERSHIP if you want to see any current reports.
AFTER MARKET UPDATE - FRIDAY, OCTOBER 2ND, 2020
Previous After Market Report Next After Market Report >>>
|
|
|
|
DOW |
-134.09 |
27,682.81 |
-0.48% |
|
Volume |
901,099,681 |
+5% |
|
Volume |
3,698,130,600 |
-6% |
|
NASDAQ |
-251.49 |
11,075.01 |
-2.22% |
|
Advancers |
1,866 |
62% |
|
Advancers |
1,608 |
49% |
|
S&P 500 |
-32.38 |
3,348.42 |
-0.96% |
|
Decliners |
1,135 |
38% |
|
Decliners |
1,676 |
51% |
|
Russell 2000 |
+8.09 |
1,539.30 |
+0.53% |
|
52 Wk Highs |
67 |
|
|
52 Wk Highs |
69 |
|
|
S&P 600 |
+9.11 |
876.58 |
+1.05% |
|
52 Wk Lows |
37 |
|
|
52 Wk Lows |
44 |
|
|
 |
Major Indices Fell of Friday Yet Tallied Weekly Gains
Kenneth J. Gruneisen - Passed the CAN SLIM® Master's Exam
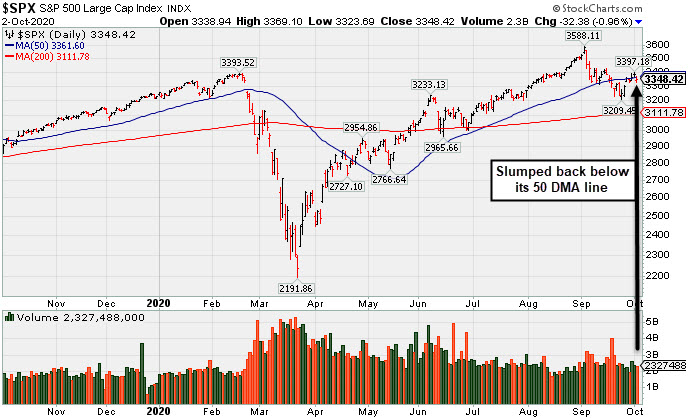
Stocks finished lower on Friday, though the Dow and S&P 500 still snapped a four-week losing streak, rising 1.9% and 1.5%, respectively. The Dow lost 134 points on the day, while the S&P 500 fell 1%. The Nasdaq Composite declined 2.2%, paring its weekly advance to 1.5%. The reported volume totals were mixed, higher than the prior session on the NYSE and lighter on the Nasdaq exchange. Breadth was positive as advancers led decliners by a 3-2 margin on the NYSE while the mix was near even on the Nasdaq exchange. There were 38 high-ranked companies from the Leaders List that hit new 52-week highs and were listed on the BreakOuts Page, versus the total of 43 on the prior session. New 52-week highs outnumbered new 52-week lows totals on the NYSE and on the Nasdaq exchange. The major indices appear to have avoided a more serious market correction and have shifted back to a confirmed uptrend (M criteria). New buying efforts may be justified in leading stocks on a case-by-case basis.
PICTURED: The S&P 500 Index slumped below its 50-day moving average (DMA) line on Friday. Recent technical improvement was coupled with an expansion in leadership (stocks hitting new 52-week highs). Wednesday's session was considered a sufficient follow-through day by the Dow Jones Industrial Average to shift the market direction (M criteria) back to a confirmed uptrend.
Risk sentiment was pressured on news that President Trump and first lady Melania Trump tested positive for COVID-19, adding to mounting uncertainty surrounding the upcoming presidential election. Fiscal stimulus updates remained in focus, with House Democrats passing a $2.2 trillion coronavirus relief package after a bipartisan agreement failed to be reached. The proposal still stands in contrast to the latest $1.6 trillion offer from the Trump Administration. Airline operators outperformed on a relative basis after House Speaker Nancy Pelosi indicated that an industry relief package was on the way, whether in standalone legislation or perhaps as part of a broader stimulus deal. Six of 11 S&P 500 sectors closed in positive territory, with Tech shares posing the biggest drag.
On the data front, the Labor Department’s “first Friday” jobs report showed non-farm payrolls increased by 661,000 in September, disappointing estimates and slowing from the prior month’s upwardly revised 1.48 million gain. However, the unemployment rate improved more than anticipated to 7.9% from August’s 8.4% figure. Separately, the final September reading of consumer sentiment from the University of Michigan improved more than expected. Treasuries weakened slightly, with the yield on the 10-year note up one basis point to 0.69%. In commodities, WTI crude shed more than 4%, bringing its weekly decline to roughly 8%. |
 Kenneth J. Gruneisen started out as a licensed stockbroker in August 1987, a couple of months prior to the historic stock market crash that took the Dow Jones Industrial Average down -22.6% in a single day. He has published daily fact-based fundamental and technical analysis on high-ranked stocks online for two decades. Through FACTBASEDINVESTING.COM, Kenneth provides educational articles, news, market commentary, and other information regarding proven investment systems that work in good times and bad.
Comments contained in the body of this report are technical opinions only and are not necessarily those of Gruneisen Growth Corp. The material herein has been obtained from sources believed to be reliable and accurate, however, its accuracy and completeness cannot be guaranteed. Our firm, employees, and customers may effect transactions, including transactions contrary to any recommendation herein, or have positions in the securities mentioned herein or options with respect thereto. Any recommendation contained in this report may not be suitable for all investors and it is not to be deemed an offer or solicitation on our part with respect to the purchase or sale of any securities. |
|
 |
Financial and Energy-Linked Indexes Posted Gains
Kenneth J. Gruneisen - Passed the CAN SLIM® Master's Exam
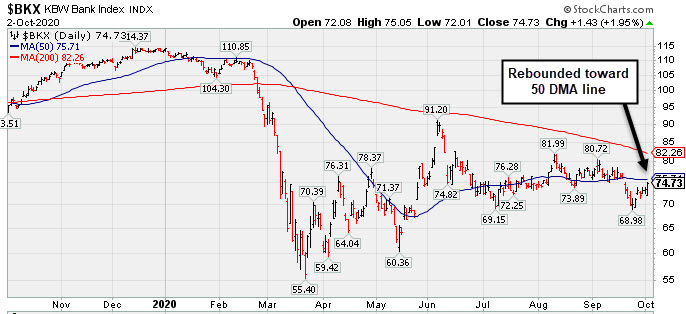
The Broker/Dealer Index ($XBD +1.16%) and Bank Index ($BKX +1.95%) both had a positive bias but the major indices were dragged lower by other areas. The Retail Index ($RLX -1.71%) had a negative influence. The Semiconductor Index ($SOX -3.08%) and Biotech Index ($BTK -2.31%) led the tech sector's retreat while the Networking Index ($NWX -0.60%) suffered a smaller loss. Commodity-linked groups were mixed as the Oil Services Index ($OSX +3.00%) outpaced the Integrated Oil Index ($XOI +0.71%) but the Gold & Silver Index ($XAU -1.18%) lost ground. PICTURED: The Bank Index ($BKX +1.95%) rebounded toward its 50-day moving average (DMA) line.
| Oil Services |
$OSX |
27.89 |
+0.81 |
+3.00% |
-64.38% |
| Integrated Oil |
$XOI |
592.89 |
+4.17 |
+0.71% |
-53.34% |
| Semiconductor |
$SOX |
2,221.12 |
-70.65 |
-3.08% |
+20.09% |
| Networking |
$NWX |
532.95 |
-3.24 |
-0.60% |
-8.65% |
| Broker/Dealer |
$XBD |
284.85 |
+3.25 |
+1.16% |
-1.90% |
| Retail |
$RLX |
3,403.48 |
-59.23 |
-1.71% |
+38.96% |
| Gold & Silver |
$XAU |
142.84 |
-1.70 |
-1.18% |
+33.60% |
| Bank |
$BKX |
74.73 |
+1.43 |
+1.95% |
-34.08% |
| Biotech |
$BTK |
5,282.13 |
-124.90 |
-2.31% |
+4.24% |
|
|
|
 |
Featured Stocks
Kenneth J. Gruneisen - Passed the CAN SLIM® Master's Exam
|
|
|
Color Codes Explained :
Y - Better candidates highlighted by our
staff of experts.
G - Previously featured
in past reports as yellow but may no longer be buyable under the
guidelines.
***Last / Change / Volume data in this table is the closing quote data***
Symbol/Exchange
Company Name
Industry Group |
PRICE |
CHANGE
(%Change) |
Day High |
Volume
(% DAV)
(% 50 day avg vol) |
52 Wk Hi
% From Hi |
Featured
Date |
Price
Featured |
Pivot Featured |
|
Max Buy |
 ADBE
-
NASDAQ
ADBE
-
NASDAQ
Adobe Inc
COMPUTER SOFTWARE and SERVICES - Application Software
|
$478.99
|
-20.52
-4.11% |
$496.78
|
2,772,739
90.11% of 50 DAV
50 DAV is 3,077,000
|
$536.88
-10.78%
|
9/10/2020
|
$488.46
|
PP = $536.88
|
|
MB = $563.72
|
 Most Recent Note - 10/2/2020 5:10:00 PM
G - Pulled back abruptly on Friday with below average volume, breaking a streak of 5 consecutive gains with light volume since finding prompt support near its 50 DMA line ($472). More damaging losses below the 50 DMA would raise greater concerns. Faces near-term resistance due to overhead supply up to the $536 level. Fundamentals remain strong.
>>> FEATURED STOCK ARTICLE : Light Volume Loss Falling Near 50-Day Moving Average Line Again - 9/23/2020 |
View all notes |
Set NEW NOTE alert |
Company Profile |
SEC
News |
Chart |
Request a new note
C
A
S
I |
CRL
-
NYSE
Charles River Labs Intl
DRUGS - Biotechnology
|
$228.87
|
-1.59
-0.69% |
$231.97
|
230,003
71.65% of 50 DAV
50 DAV is 321,000
|
$230.64
-0.77%
|
7/15/2020
|
$192.66
|
PP = $189.95
|
|
MB = $199.45
|
Most Recent Note - 10/1/2020 5:56:40 PM
G - Posted a solid gain with +30% above average volume today for a new all-time high. Found prompt support at its 50 DMA line ($214) where any subsequent violation would raise concerns and trigger a technical sell signal. Raised fundamental concerns when it recently reported Jun '20 quarterly earnings -3% on +4% sales revenues, below the +25% minimum guideline (C criteria).
>>> FEATURED STOCK ARTICLE : Showed Resilience When Testing 50-Day Moving Average Line Again - 9/24/2020 |
View all notes |
Set NEW NOTE alert |
Company Profile |
SEC
News |
Chart |
Request a new note
C
A
S
I |
AMD
-
NASDAQ
Advanced Micro Devices
ELECTRONICS - Semiconductor - Broad Line
|
$81.80
|
-3.06
-3.61% |
$84.65
|
52,680,031
81.28% of 50 DAV
50 DAV is 64,811,000
|
$94.28
-13.24%
|
8/31/2020
|
$90.42
|
PP = $87.39
|
|
MB = $91.76
|
Most Recent Note - 10/2/2020 5:11:04 PM
G - Retreated with lighter than average volume today breaking a 6 session winning streak. Any losses below the 50 DMA line and below the recent low ($73.85 on 9/18/20) would raise greater concerns and trigger more worrisome technical sell signals. Faces near-term resistance due to overhead supply up to the $94 level. Fundamentals remain strong.
>>> FEATURED STOCK ARTICLE : Rebound Above 50-Day Average With Light Volume Helped Stance - 9/28/2020 |
View all notes |
Set NEW NOTE alert |
Company Profile |
SEC
News |
Chart |
Request a new note
C
A
S
I |
TREX
-
NYSE
Trex Company Inc
MATERIALS and CONSTRUCTION - General Building Materials
|
$73.73
|
+0.28
0.38% |
$74.66
|
556,937
56.89% of 50 DAV
50 DAV is 979,000
|
$78.32
-5.86%
|
6/26/2020
|
$54.53
|
PP = $66.47
|
|
MB = $69.79
|
Most Recent Note - 10/1/2020 6:01:02 PM
G - Recently rebounding well above its 50 DMA line ($70.61) helping its outlook to improve, but again lighter than average volume was behind today's gain. Any losses below the 50 DMA line or recent low ($63.32 on 9/21/20) would raise concerns and trigger technical sell signals. Do not be confused by the 2:1 share split effective 9/15/20 (Featured Price, Pivot Point, and Max Buy prices have been adjusted accordingly). Fundamentals remain strong. See the latest FSU analysis for more details and an annotated graph.
>>> FEATURED STOCK ARTICLE : TREX Rebounded Above 50-Day Moving Average - 9/30/2020 |
View all notes |
Set NEW NOTE alert |
Company Profile |
SEC
News |
Chart |
Request a new note
C
A
S
I |
NFLX
-
NASDAQ
Netflix Inc
SPECIALTY RETAIL - Music and Video Stores
|
$503.06
|
-24.45
-4.63% |
$526.37
|
6,050,240
103.71% of 50 DAV
50 DAV is 5,834,000
|
$575.37
-12.57%
|
9/1/2020
|
$547.45
|
PP = $575.47
|
|
MB = $604.24
|
Most Recent Note - 10/2/2020 5:12:38 PM
G - Abruptly retreated near its 50 DMA line ($496) today with a big loss breaking a 6 session winning streak. Faces near-term resistance at prior highs. The 50 DMA and recent low ($458.60 on 9/18/20) define important near term support where any further deterioration would raise more serious concerns.
>>> FEATURED STOCK ARTICLE : Quiet Rebound Meeting Resistance at 50-Day Moving Average - 9/29/2020 |
View all notes |
Set NEW NOTE alert |
Company Profile |
SEC
News |
Chart |
Request a new note
C
A
S
I |
Symbol/Exchange
Company Name
Industry Group |
PRICE |
CHANGE
(%Change) |
Day High |
Volume
(% DAV)
(% 50 day avg vol) |
52 Wk Hi
% From Hi |
Featured
Date |
Price
Featured |
Pivot Featured |
|
Max Buy |
LGIH
-
NASDAQ
L G I Homes Inc
Bldg-Resident/Comml
|
$126.20
|
+3.03
2.46% |
$127.59
|
298,287
102.15% of 50 DAV
50 DAV is 292,000
|
$123.94
1.82%
|
10/1/2020
|
$123.17
|
PP = $124.04
|
|
MB = $130.24
|
Most Recent Note - 10/1/2020 5:47:48 PM
Y - Color code is changed to yellow with new pivot point cited based on its 8/04/20 high plus 10 cents. Subsequent gains above the pivot point backed by at least +40% above average volume are needed to trigger a new (or add-on) technical buy signal. Recent rebound above its 50 DMA line ($113.29) helped its outlook to improve. Any losses below the 50 DMA line and latest low ($101.30 on 9/21/20) would raise greater concerns and trigger worrisome technical sell signals. Reported Jun '20 quarterly earnings +21% on +4% sales revenues, breaking a streak of 4 comparisons above the +25% minimum guideline (C criteria). See the latest FSU analysis for more details and a new annotated graph.
>>> FEATURED STOCK ARTICLE : New Base Formed by Strong Homebuilder - 10/1/2020 |
View all notes |
Set NEW NOTE alert |
Company Profile |
SEC
News |
Chart |
Request a new note
C
A
S
I |
NOW
-
NYSE
Servicenow Inc
Computer Sftwr-Enterprse
|
$493.15
|
+0.63
0.13% |
$502.63
|
1,588,392
100.21% of 50 DAV
50 DAV is 1,585,000
|
$501.82
-1.73%
|
8/20/2020
|
$453.34
|
PP = $454.79
|
|
MB = $477.53
|
Most Recent Note - 10/1/2020 5:59:06 PM
G - Perched within striking distance of its all-time high, it found support at its 50 DMA line ($454.72) but has not quite formed a new base of sufficient length. Fundamentals remain strong. Any losses below the 50 DMA line and prior low ($432.85 on 9/08/20) would raise concerns and trigger technical sell signals.
>>> FEATURED STOCK ARTICLE : Gain Back Above "Max Buy" Level for ServiceNow - 9/25/2020 |
View all notes |
Set NEW NOTE alert |
Company Profile |
SEC
News |
Chart |
Request a new note
C
A
S
I |
|
|
|
THESE ARE NOT BUY RECOMMENDATIONS!
Comments contained in the body of this report are technical
opinions only. The material herein has been obtained
from sources believed to be reliable and accurate, however,
its accuracy and completeness cannot be guaranteed.
This site is not an investment advisor, hence it does
not endorse or recommend any securities or other investments.
Any recommendation contained in this report may not
be suitable for all investors and it is not to be deemed
an offer or solicitation on our part with respect to
the purchase or sale of any securities. All trademarks,
service marks and trade names appearing in this report
are the property of their respective owners, and are
likewise used for identification purposes only.
This report is a service available
only to active Paid Premium Members.
You may opt-out of receiving report notifications
at any time. Questions or comments may be submitted
by writing to Premium Membership Services 665 S.E. 10 Street, Suite 201 Deerfield Beach, FL 33441-5634 or by calling 1-800-965-8307
or 954-785-1121.
|
|
|