You are not logged in.
This means you
CAN ONLY VIEW reports that were published prior to Friday, February 23, 2024.
You
MUST UPGRADE YOUR MEMBERSHIP if you want to see any current reports.
AFTER MARKET UPDATE - WEDNESDAY, OCTOBER 2ND, 2019
Previous After Market Report Next After Market Report >>>
|
|
|
|
DOW |
-494.42 |
26,078.62 |
-1.86% |
|
Volume |
939,975,180 |
+19% |
|
Volume |
2,445,723,600 |
+9% |
|
NASDAQ |
-123.43 |
7,785.25 |
-1.56% |
|
Advancers |
609 |
22% |
|
Advancers |
824 |
27% |
|
S&P 500 |
-52.64 |
2,887.61 |
-1.79% |
|
Decliners |
2,157 |
78% |
|
Decliners |
2,282 |
73% |
|
Russell 2000 |
-13.80 |
1,479.63 |
-0.92% |
|
52 Wk Highs |
16 |
|
|
52 Wk Highs |
16 |
|
|
S&P 600 |
-10.16 |
919.11 |
-1.09% |
|
52 Wk Lows |
96 |
|
|
52 Wk Lows |
183 |
|
|
 |
Leadership Vanished as Major Indices Faced More Distribution
Kenneth J. Gruneisen - Passed the CAN SLIM® Master's Exam
The S&P 500 lost 1.8% to close below its 100-day moving average and notch the index’s first ever back-to-back 1% decline to start the fourth quarter. The Dow dropped 494 points, while the Nasdaq Composite tumbled 1.6%. Volume totals reported were higher than the prior session on the NYSE and on the Nasdaq exchange, indicative of more worrisome distributional pressure or selling from large institutional investors. Breadth was negative as decliners led advancers by a 11-4 margin on the Nasdaq exchange and by 11-3 on the NYSE. Leadership vanished as only 1 high-ranked company from the Leaders List hit a new 52-week high and was listed on the BreakOuts Page, versus the total of 29 on the prior session. New 52-week lows totals outnumbered new 52-week highs on both the NYSE and Nasdaq. The uptrend for the major indices (M criteria) came under greater pressure, having the look of a more serious correction. Disciplined investors know to reduce exposure to stocks during market corrections. The Featured Stocks Page provides the most timely analysis on high-ranked leaders. Charts used courtesy of www.stockcharts.com

PICTURED: The Nasdaq Composite Index sank near its prior lows and its 200-day moving average (DMA) line. More damaging losses may bode poorly for the market outllook, meanwhile, it remains perched only -6.6% off its record high.
Stocks ended the session sharply lower Wednesday as data releases renewed fears of a slowing global economy. Tuesday’s manufacturing PMI report from ISM continued to weigh on investor sentiment. The release indicated U.S. manufacturing activity fell to the weakest level since June 2009. That followed soft manufacturing figures across the eurozone. Also providing a headwind was a report this morning from ADP that revealed 135,000 jobs were added in the private sector in September, below expectations and August’s downwardly revised figure.
Overseas, the broad Euro STOXX 600 retreated the most in 10 months, while the FTSE 100 in London experienced its largest drop since 2016 after U.K. Prime Minister Boris Johnson warned of a hard Brexit. Perceived safe haven assets rallied, with COMEX gold adding 1.1% to $1,497.70/ounce. Treasuries strengthened, with the yield on the 10-year note lower for a fifth straight day, declining four basis points to 1.60%.
Ten of 11 S&P 500 sectors fell more than 1%, with all groups firmly in negative territory. Energy stocks paced the decline as WTI crude lost 1.1% to $52.57/barrel. Automakers slumped after Ford’s (F -3.26%) quarterly sales figures fueled worries over diminishing profit margins in the auto industry. Homebuilder Lennar (LEN +3.77%) bucked the downward trend, climbing after topping analyst profit and sales estimates. Johnson and Johnson (JNJ +1.55%) was the lone advancer in the Dow, rising after announcing it had settled two opioid related lawsuits.
|
 Kenneth J. Gruneisen started out as a licensed stockbroker in August 1987, a couple of months prior to the historic stock market crash that took the Dow Jones Industrial Average down -22.6% in a single day. He has published daily fact-based fundamental and technical analysis on high-ranked stocks online for two decades. Through FACTBASEDINVESTING.COM, Kenneth provides educational articles, news, market commentary, and other information regarding proven investment systems that work in good times and bad.
Comments contained in the body of this report are technical opinions only and are not necessarily those of Gruneisen Growth Corp. The material herein has been obtained from sources believed to be reliable and accurate, however, its accuracy and completeness cannot be guaranteed. Our firm, employees, and customers may effect transactions, including transactions contrary to any recommendation herein, or have positions in the securities mentioned herein or options with respect thereto. Any recommendation contained in this report may not be suitable for all investors and it is not to be deemed an offer or solicitation on our part with respect to the purchase or sale of any securities. |
|
 |
Financial, Retail, Tech and Energy-Linked Groups Fell
Kenneth J. Gruneisen - Passed the CAN SLIM® Master's Exam
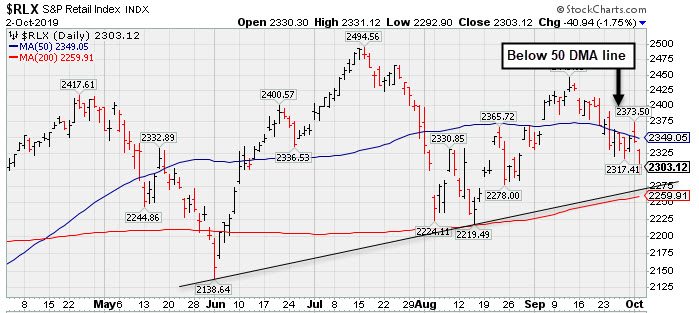
The Broker/Dealer Index ($XBD -2.35%) and the Bank Index ($BKX -2.04%) both ended the session solidly lower and the Retail Index ($RLX -1.75%) also sank. The tech sector had a negative bias as the Semiconductor Index ($SOX -1.58%), Biotech Index ($BTK -0.71%), and the Networking Index ($NWX -0.79%) finished unanimously lower. Energy-linked groups also had a negative bias as the Oil Services Index ($OSX -2.21%) and the Integrated Oil Index ($XOI -2.59%) slumped. Meanwhile, the Gold & Silver Index ($XAU +1.22%) was a standout gainer.
PICTURED: The Retail Index ($RLX -1.75%) recently fell below its 50-day moving average (DMA) line slumping toward its August low.
| Oil Services |
$OSX |
61.87 |
-1.40 |
-2.21% |
-23.24% |
| Integrated Oil |
$XOI |
1,155.51 |
-30.68 |
-2.59% |
-0.31% |
| Semiconductor |
$SOX |
1,519.77 |
-24.43 |
-1.58% |
+31.56% |
| Networking |
$NWX |
536.05 |
-4.27 |
-0.79% |
+9.70% |
| Broker/Dealer |
$XBD |
244.50 |
-5.89 |
-2.35% |
+3.02% |
| Retail |
$RLX |
2,303.12 |
-40.94 |
-1.75% |
+18.02% |
| Gold & Silver |
$XAU |
89.62 |
+1.08 |
+1.22% |
+26.83% |
| Bank |
$BKX |
95.46 |
-1.98 |
-2.03% |
+11.27% |
| Biotech |
$BTK |
4,117.35 |
-29.56 |
-0.71% |
-2.45% |
|
|
|
 |
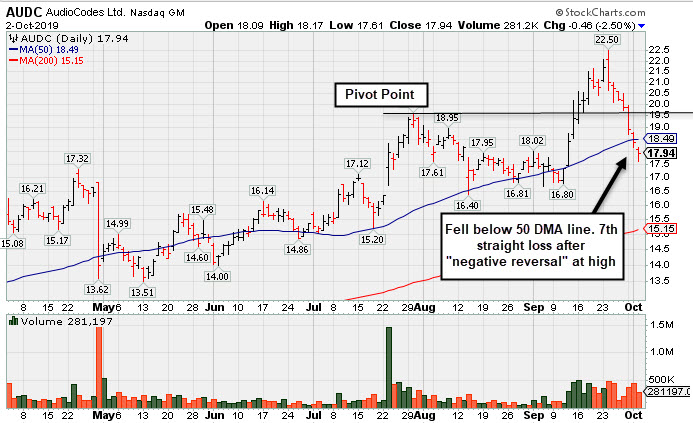
Sank Below 50-Day Average as 7 Straight Losses Follow Reversal
Kenneth J. Gruneisen - Passed the CAN SLIM® Master's Exam
Audiocodes Ltd (AUDC -$0.46 or -2.50% to $17.94) has slumped below its 50-day moving average (DMA) line ($18.53) and tallied 7 consecutive losses after a "negative reversal at its all-time high. The recent low ($16.51 on 8/14/19) defines the next important support where more damaging losses would raise concerns and trigger a technical sell signal.
Bullish action came after it reported earnings +57% on +14% sales revenues for the Jun '19 quarter, continuing its strong earnings track record for a 10th consecutive quarterly comparison above the +25% minimum guideline (C criteria). Annual earnings growth has been strong and it has a 99 Earnings Per Share Rating.
AUDC was highlighted in yellow with new pivot point cited based on its 4/24/19 high plus 10 cents in the 7/15/19 mid-day report (read here). This Israel-based designer of advanced voice-over-IP products shown in this FSU section on 9/17/19 with an annotated graph under the headline, "Recent Spurt of Gains for New Highs Marked By Volume".
The number of top-rated funds owning its shares rose from 33 in Mar '18 to 73 in Jun '19, a reassuring sign concerning the I criteria. Its current Up/Down Volume Ratio of 1.1 is an unbiased indication its shares have been under very slight accumulation over the past 50 days. It has a Timeliness Rating of A and Sponsorship Rating of B. The small supply of 22.8 million shares (S criteria) in the public float can contribute to greater price volatility in the event of institutional buying or selling.
Charts courtesy of www.stockcharts.com
 |
|
|
Color Codes Explained :
Y - Better candidates highlighted by our
staff of experts.
G - Previously featured
in past reports as yellow but may no longer be buyable under the
guidelines.
***Last / Change / Volume data in this table is the closing quote data***
Symbol/Exchange
Company Name
Industry Group |
PRICE |
CHANGE
(%Change) |
Day High |
Volume
(% DAV)
(% 50 day avg vol) |
52 Wk Hi
% From Hi |
Featured
Date |
Price
Featured |
Pivot Featured |
|
Max Buy |
 MLR
-
NYSE
MLR
-
NYSE
Miller Industries Inc
AUTOMOTIVE - Auto Parts
|
$32.48
|
-0.25
-0.76% |
$32.78
|
33,248
94.99% of 50 DAV
50 DAV is 35,000
|
$35.26
-7.88%
|
9/24/2019
|
$34.00
|
PP = $35.36
|
|
MB = $37.13
|
Most Recent Note - 9/30/2019 5:13:27 PM
Y - Suffered another loss with above average volume today and finished near the session low. Subsequent gains above the pivot point backed by at least +40% above average volume may trigger a technical buy signal. Very little resistance remains due to overhead supply. Reported June '19 quarterly earnings +40% on +26% sales revenues versus the year ago period, and 3 of the past 4 comparisons were above the +25% minimum earnings guideline (C criteria).
>>> FEATURED STOCK ARTICLE : Encountered Distributional Pressure After Challenging Prior High - 9/24/2019 |
View all notes |
Set NEW NOTE alert |
Company Profile |
SEC
News |
Chart |
Request a new note
C
A
S
I |
CCBG
-
NASDAQ
Capital City Bk Gp
BANKING - Regional - Mid-Atlantic Banks
|
$26.55
|
-0.16
-0.60% |
$26.76
|
36,492
135.16% of 50 DAV
50 DAV is 27,000
|
$28.00
-5.18%
|
9/13/2019
|
$27.03
|
PP = $27.05
|
|
MB = $28.40
|
Most Recent Note - 9/27/2019 6:35:54 PM
Y - Stalled after hitting a new 52-week high on 9/20/19 with a solid gain above the pivot point backed by +339% above average volume triggering a technical buy signal. Prior highs define initial support to watch above its 50 DMA line ($25.33). See the latest FSU analysis for more details and a new annotated graph.
>>> FEATURED STOCK ARTICLE : Stalled After Recent Rally for New High - 9/27/2019 |
View all notes |
Set NEW NOTE alert |
Company Profile |
SEC
News |
Chart |
Request a new note
C
A
S
I |
EPAM
-
NYSE
Epam Systems Inc
COMPUTER SOFTWARE and SERVICES - Information Technology Service
|
$180.02
|
-1.42
-0.78% |
$180.29
|
387,860
113.41% of 50 DAV
50 DAV is 342,000
|
$201.00
-10.44%
|
5/9/2019
|
$169.25
|
PP = $180.55
|
|
MB = $189.58
|
Most Recent Note - 9/30/2019 5:09:31 PM
G - A rebound above its 50 DMA line ($188.31) is still needed for its outlook to improve. Prior lows in the $174-175 area define the next important support level. Reported earnings +27% on +24% sales revenues for the Jun '19 quarter. See the latest FSU analysis for more details and a new annotated graph.
>>> FEATURED STOCK ARTICLE : Slumped and Sputtered Below 50-Day Moving Average - 9/30/2019 |
View all notes |
Set NEW NOTE alert |
Company Profile |
SEC
News |
Chart |
Request a new note
C
A
S
I |
AUDC
-
NASDAQ
Audiocodes Ltd
ELECTRONICS - Scientific and Technical Instrum
|
$17.94
|
-0.46
-2.50% |
$18.17
|
281,197
117.66% of 50 DAV
50 DAV is 239,000
|
$22.50
-20.27%
|
9/13/2019
|
$19.68
|
PP = $19.84
|
|
MB = $20.83
|
 Most Recent Note - 10/2/2019 7:41:34 PM
G - Today's 7th consecutive loss violated its 50 DMA line ($18.53) raising greater concerns. Only a prompt rebound would help its outlook improve. See the latest FSU analysis for more details and a new annotated graph.
>>> FEATURED STOCK ARTICLE : Sank Below 50-Day Average as 7 Straight Losses Follow Reversal - 10/2/2019 |
View all notes |
Set NEW NOTE alert |
Company Profile |
SEC
News |
Chart |
Request a new note
C
A
S
I |
CHDN
-
NASDAQ
Churchill Downs Inc
LEISURE - Gaming Activities
|
$122.90
|
-0.07
-0.06% |
$123.35
|
170,489
72.86% of 50 DAV
50 DAV is 234,000
|
$132.73
-7.41%
|
7/22/2019
|
$118.45
|
PP = $118.89
|
|
MB = $124.83
|
Most Recent Note - 9/30/2019 5:14:25 PM
Y - Consolidating near its 50 DMA line ($121.68). That important short-term average has acted as support in recent weeks during its consolidation. Prior lows define the next important support to watch. Jun '19 earnings +10% on +26% sales revenues versus the year ago period were below the +25% minimum earnings guideline (C criteria), noted recently raising fundamental concerns.
>>> FEATURED STOCK ARTICLE : Consolidating Above 50-Day Moving Average Line - 9/20/2019 |
View all notes |
Set NEW NOTE alert |
Company Profile |
SEC
News |
Chart |
Request a new note
C
A
S
I |
Symbol/Exchange
Company Name
Industry Group |
PRICE |
CHANGE
(%Change) |
Day High |
Volume
(% DAV)
(% 50 day avg vol) |
52 Wk Hi
% From Hi |
Featured
Date |
Price
Featured |
Pivot Featured |
|
Max Buy |
LULU
-
NASDAQ
Lululemon Athletica
MANUFACTURING - Textile Manufacturing
|
$189.13
|
-3.56
-1.85% |
$191.75
|
1,351,911
76.47% of 50 DAV
50 DAV is 1,768,000
|
$204.44
-7.49%
|
9/6/2019
|
$201.25
|
PP = $194.35
|
|
MB = $204.07
|
Most Recent Note - 9/30/2019 5:11:25 PM
Y - Recently sputtering below the prior high ($194.25) raising concerns. Its 50 DMA line ($187.12) defines important near-term support to watch.
>>> FEATURED STOCK ARTICLE : Consolidating Near Prior High Following Latest Breakout - 9/18/2019 |
View all notes |
Set NEW NOTE alert |
Company Profile |
SEC
News |
Chart |
Request a new note
C
A
S
I |
CPRT
-
NASDAQ
Copart Inc
SPECIALTY RETAIL - Auto Dealerships
|
$77.43
|
-2.10
-2.64% |
$79.34
|
1,888,184
136.73% of 50 DAV
50 DAV is 1,381,000
|
$83.70
-7.49%
|
9/5/2019
|
$79.13
|
PP = $79.84
|
|
MB = $83.83
|
Most Recent Note - 9/30/2019 5:08:26 PM
Y - Consolidating above its prior high ($79.74 on 7/26/19) and 50 DMA line ($78.06). More damaging losses would raise concerns and trigger technical sell signals. Remains perched near its all-time high. Fundamentals are strong.
>>> FEATURED STOCK ARTICLE : Hovering Near All-Time High Following Recent Breakout - 9/19/2019 |
View all notes |
Set NEW NOTE alert |
Company Profile |
SEC
News |
Chart |
Request a new note
C
A
S
I |
PFPT
-
NASDAQ
Proofpoint Inc
Computer Sftwr-Security
|
$126.60
|
-1.99
-1.55% |
$127.54
|
801,538
119.45% of 50 DAV
50 DAV is 671,000
|
$133.00
-4.81%
|
10/1/2019
|
$129.59
|
PP = $132.95
|
|
MB = $139.60
|
Most Recent Note - 10/1/2019 5:45:14 PM
Y - Finished the session lower after highlighted in yellow with pivot point cited based on its 7/26/19 high. Reversed into the red after touching a new all-time high today. Met stubborn resistance in the $132 area in recent months. Subsequent gains above the pivot point backed by at least +40% above average volume may trigger a technical buy signal. Prior mid-day reports noted - "Three of the past 4 quarterly comparisons through Jun '19 were above the +25% minimum earnings guideline (C criteria). Annual earnings (A criteria) history has been strong since turning profitable in FY '16 ". See the latest FSU analysis for more details and a new annotated graph.
>>> FEATURED STOCK ARTICLE : Challenging Previously Stubborn Resistance - 10/1/2019 |
View all notes |
Set NEW NOTE alert |
Company Profile |
SEC
News |
Chart |
Request a new note
C
A
S
I |
BLD
-
NYSE
Topbuild Corp
Bldg-Constr Prds/Misc
|
$93.62
|
-1.18
-1.24% |
$94.63
|
255,208
86.51% of 50 DAV
50 DAV is 295,000
|
$97.99
-4.46%
|
5/17/2019
|
$82.19
|
PP = $87.31
|
|
MB = $91.68
|
Most Recent Note - 9/30/2019 12:21:23 PM
G - Perched near its all-time high, extended from the prior base after wedging higher with gains lacking great volume conviction. Earnings rose +39% on +9% sales revenues for the Jun '19 quarter versus the year ago period. Its 50 DMA line ($90.12) defines important support to watch along with its prior low ($86.53 on 8/28/19).
>>> FEATURED STOCK ARTICLE : Perched Near Record High, Extended From Prior Base - 9/23/2019 |
View all notes |
Set NEW NOTE alert |
Company Profile |
SEC
News |
Chart |
Request a new note
C
A
S
I |
PAGS
-
NYSE
Pagseguro Digital Cl A
Finance-CrdtCard/PmtPr
|
$43.64
|
-2.54
-5.50% |
$45.67
|
2,759,687
145.86% of 50 DAV
50 DAV is 1,892,000
|
$53.43
-18.32%
|
6/25/2019
|
$37.69
|
PP = $40.07
|
|
MB = $42.07
|
Most Recent Note - 10/2/2019 7:43:13 PM
G - Slumped further below its 50 DMA line ($47.44) with a big loss today backed by above average volume. Testing prior lows in the $42-43 area noted as important near-term chart support to watch where violations may trigger a worrisome technical sell signal. Fundamentals are strong.
>>> FEATURED STOCK ARTICLE : Recent Lows Define Important Near-Term Support While Consolidating - 9/25/2019 |
View all notes |
Set NEW NOTE alert |
Company Profile |
SEC
News |
Chart |
Request a new note
C
A
S
I |
Symbol/Exchange
Company Name
Industry Group |
PRICE |
CHANGE
(%Change) |
Day High |
Volume
(% DAV)
(% 50 day avg vol) |
52 Wk Hi
% From Hi |
Featured
Date |
Price
Featured |
Pivot Featured |
|
Max Buy |
|
|
|
THESE ARE NOT BUY RECOMMENDATIONS!
Comments contained in the body of this report are technical
opinions only. The material herein has been obtained
from sources believed to be reliable and accurate, however,
its accuracy and completeness cannot be guaranteed.
This site is not an investment advisor, hence it does
not endorse or recommend any securities or other investments.
Any recommendation contained in this report may not
be suitable for all investors and it is not to be deemed
an offer or solicitation on our part with respect to
the purchase or sale of any securities. All trademarks,
service marks and trade names appearing in this report
are the property of their respective owners, and are
likewise used for identification purposes only.
This report is a service available
only to active Paid Premium Members.
You may opt-out of receiving report notifications
at any time. Questions or comments may be submitted
by writing to Premium Membership Services 665 S.E. 10 Street, Suite 201 Deerfield Beach, FL 33441-5634 or by calling 1-800-965-8307
or 954-785-1121.
|
|
|