You are not logged in.
This means you
CAN ONLY VIEW reports that were published prior to Sunday, February 18, 2024.
You
MUST UPGRADE YOUR MEMBERSHIP if you want to see any current reports.
AFTER MARKET UPDATE - WEDNESDAY, SEPTEMBER 30TH, 2020
Previous After Market Report Next After Market Report >>>
|
|
|
|
DOW |
+329.04 |
27,781.70 |
+1.20% |
|
Volume |
1,267,839,243 |
+81% |
|
Volume |
4,213,559,600 |
+27% |
|
NASDAQ |
+85.98 |
11,171.23 |
+0.78% |
|
Advancers |
1,546 |
52% |
|
Advancers |
1,574 |
48% |
|
S&P 500 |
+27.53 |
3,363.00 |
+0.83% |
|
Decliners |
1,422 |
48% |
|
Decliners |
1,722 |
52% |
|
Russell 2000 |
+2.97 |
1,507.69 |
+0.20% |
|
52 Wk Highs |
70 |
|
|
52 Wk Highs |
84 |
|
|
S&P 600 |
+1.92 |
855.27 |
+0.22% |
|
52 Wk Lows |
14 |
|
|
52 Wk Lows |
31 |
|
|
The major indices have shown improvement and appear to have resumed a market uptrend as leadership has improved. Disciplined investors carefully may buy leading stocks on a case-by-case basis. Always remain ready to reduce market exposure in the event of any more substantial market downdrafts.
|
 |
Major Indices Show More Leadership and Technical Improvement
Kenneth J. Gruneisen - Passed the CAN SLIM® Master's Exam
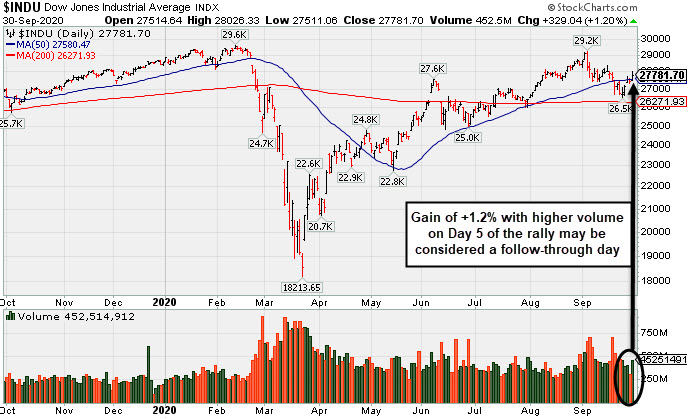
The Dow added 329 points, while the Nasdaq Composite rose 0.7%. The S&P 500 advanced 0.8%, paring a mid-day gain of more than 1.5%. The reported volume totals were higher than the prior session on the NYSE and on the Nasdaq exchange. Breadth was mixed as advancers led decliners by narrow margin on the NYSE but decliners led advancers by a narrow margin on the Nasdaq exchange. Leadership improved as 35 high-ranked companies from the Leaders List that hit new 52-week highs and were listed on the BreakOuts Page, versus the total of 21 on the prior session. New 52-week highs outnumbered new 52-week lows totals on the NYSE and on the Nasdaq exchange. The major indices appear to have avoided a more serious market correction and have shifted back to a confirmed uptrend (M criteria). New buying efforts may be justified in leading stocks on a case-by-case basis.
PICTURED: The Dow Jones Industrial Average posted a +1.2% gain with higher volume on Day 5 of the rally effort as it rebounded above its 50-day moving average (DMA) line. The gain was not large percentage wise, but the technical improvement was coupled with the expansion in leadership (stocks hitting new 52-week highs). This session may be considered a sufficient follow-through day to shift the market direction (M criteria) back to a confirmed uptrend.
Stocks finished higher Wednesday as investors digested upbeat economic data and fiscal stimulus developments from Washington. Hopes of another round of aid provided support to risk assets, as U.S. Treasury Secretary Steven Mnuchin and House Speaker Nancy Pelosi expressed optimism about talks on a fifth coronavirus relief bill. However, lawmakers failed to come to an agreement today with negotiations planned to continue.
The major averages snapped a five-month winning streak in September, with the Dow, S&P 500, and Nasdaq Composite declining 2.3%, 3.9%, and 5.2%, respectively. However, third quarter gains remained robust with the Dow, S&P 500, and Nasdaq Composite jumping 7.6%, 8.5%, and 11.0%, respectively.
On the data front, a release from ADP revealed 749,000 private jobs were added to the U.S. economy in September, topping estimates, while the prior month’s figure was upwardly revised. Separately, the final second-quarter U.S. GDP reading showed the U.S. economy contracted at a 31.4% annualized pace during the April-June period. Elsewhere, pending home sales jumped 8.8% in August to its highest level on record. Treasuries weakened, with the yield on the 10-year note adding three basis points to 0.68%.
Nine of 11 S&P 500 sectors ended the day in positive territory with Health Care shares pacing gains. In earnings, Micron Technology (MU -7.39%) fell after sharing disappointing current-quarter revenue guidance. In M&A activity, shares of Duke Energy (DUK +7.46%) rose amid a report that NextEra Energy (NEE +1.96%) is pursuing takeover options. |
 Kenneth J. Gruneisen started out as a licensed stockbroker in August 1987, a couple of months prior to the historic stock market crash that took the Dow Jones Industrial Average down -22.6% in a single day. He has published daily fact-based fundamental and technical analysis on high-ranked stocks online for two decades. Through FACTBASEDINVESTING.COM, Kenneth provides educational articles, news, market commentary, and other information regarding proven investment systems that work in good times and bad.
Comments contained in the body of this report are technical opinions only and are not necessarily those of Gruneisen Growth Corp. The material herein has been obtained from sources believed to be reliable and accurate, however, its accuracy and completeness cannot be guaranteed. Our firm, employees, and customers may effect transactions, including transactions contrary to any recommendation herein, or have positions in the securities mentioned herein or options with respect thereto. Any recommendation contained in this report may not be suitable for all investors and it is not to be deemed an offer or solicitation on our part with respect to the purchase or sale of any securities. |
|
 |
Financial, Retail, and Biotech Indexes Rose
Kenneth J. Gruneisen - Passed the CAN SLIM® Master's Exam
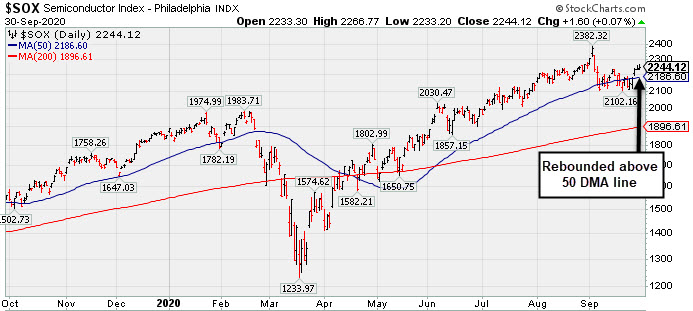
Financials had a positive bias as the Bank Index ($BKX +1.38%), Broker/Dealer Index ($XBD +0.78%), and Retail Index ($RLX +0.72%) each helped boost the major indices higher. The Biotech Index ($BTK +0.32%) eked out a modest gain while the Semiconductor Index ($SOX +0.07%) finished flat and the Networking Index ($NWX -0.53%) lost ground. The Oil Services Index ($OSX -0.74%) also fell while the Integrated Oil Index ($XOI -0.10%) and Gold & Silver Index ($XAU -0.10%) both were little changed. PICTURED: The Semiconductor Index ($SOX +0.07%) has recently rebounded above its 50 DMA line.
| Oil Services |
$OSX |
27.85 |
-0.21 |
-0.74% |
-64.43% |
| Integrated Oil |
$XOI |
608.23 |
-0.59 |
-0.10% |
-52.13% |
| Semiconductor |
$SOX |
2,244.12 |
+1.60 |
+0.07% |
+21.33% |
| Networking |
$NWX |
534.05 |
-2.85 |
-0.53% |
-8.46% |
| Broker/Dealer |
$XBD |
279.45 |
+2.15 |
+0.78% |
-3.77% |
| Retail |
$RLX |
3,404.52 |
+24.23 |
+0.72% |
+39.00% |
| Gold & Silver |
$XAU |
143.08 |
-0.14 |
-0.10% |
+33.82% |
| Bank |
$BKX |
73.09 |
+1.00 |
+1.38% |
-35.52% |
| Biotech |
$BTK |
5,361.52 |
+17.36 |
+0.32% |
+5.80% |
|
|
|
 |
TREX Rebounded Above 50-Day Moving Average
Kenneth J. Gruneisen - Passed the CAN SLIM® Master's Exam
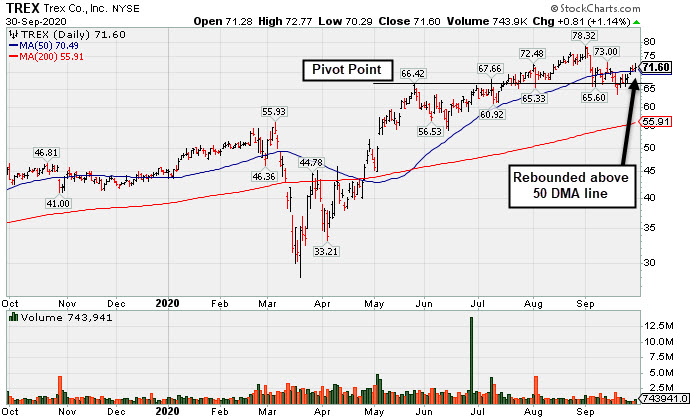
Trex Company Inc (TREX +$0.81 or +1.14% to $71.60) has quietly rebounded above its 50-day moving average (DMA) line ($70.49) helping its outlook to improve, but lighter than average volume was behind today's gain. More damaging losses below the recent low ($63.32 on 9/21/20) would raise serious concerns. Do not be confused by the 2:1 share split effective 9/15/20 (Featured Price, Pivot Point, and Max Buy prices have been adjusted accordingly).
Fundamentals remain strong. Recently it reported Jun '20 quarterly earnings +27% on +7% sales revenues versus the year ago period, its 4th consecutive quarterly comparison above the +25% minimum earnings guideline (C criteria). It has shown resilience since last appearing in this FSU section on 9/17/20 with an annotated graph under the headline, "Slumped Below 50-Day Average With Loss on Light Volume". It has earned the highest possible 99 Earnings Per Share Rating. Annual earnings (A criteria) growth has been strong. The company hails from the General Building Materials industry group which currently has a Group Relative Strength Rating of A+
The company has a new CEO as of 4/29/20. After a 2:1 share split effective 9/15/20 it now has a supply (S criteria) of 115.8 million shares outstanding. The number of top-rated funds owning its shares rose from 540 in Jun '19 to 735 in Jun '20, a reassuring sign concerning the I criteria. Its current Up/Down Volume Ratio of 0.8 is an unbiased indication its shares have been under some distributional pressure over the past 50 days. It has a Timeliness rating of A and a Sponsorship Rating of C.
|
|
|
Color Codes Explained :
Y - Better candidates highlighted by our
staff of experts.
G - Previously featured
in past reports as yellow but may no longer be buyable under the
guidelines.
***Last / Change / Volume data in this table is the closing quote data***
Symbol/Exchange
Company Name
Industry Group |
PRICE |
CHANGE
(%Change) |
Day High |
Volume
(% DAV)
(% 50 day avg vol) |
52 Wk Hi
% From Hi |
Featured
Date |
Price
Featured |
Pivot Featured |
|
Max Buy |
 ADBE
-
NASDAQ
ADBE
-
NASDAQ
Adobe Inc
COMPUTER SOFTWARE and SERVICES - Application Software
|
$490.43
|
+1.10
0.22% |
$497.24
|
3,496,201
115.39% of 50 DAV
50 DAV is 3,030,000
|
$536.88
-8.65%
|
9/10/2020
|
$488.46
|
PP = $536.88
|
|
MB = $563.72
|
Most Recent Note - 9/28/2020 5:27:33 PM
G - Found prompt support near its 50 DMA line ($469). faces near-term resistance due to overhead supply up to the $536 level. Disciplined investors always limit losses by selling any stock that falls more than 7-8% from their purchase price. Reported Aug '20 quarterly earnings +25% on +14% sales revenues versus the year ago period.
>>> FEATURED STOCK ARTICLE : Light Volume Loss Falling Near 50-Day Moving Average Line Again - 9/23/2020 |
View all notes |
Set NEW NOTE alert |
Company Profile |
SEC
News |
Chart |
Request a new note
C
A
S
I |
CRL
-
NYSE
Charles River Labs Intl
DRUGS - Biotechnology
|
$226.45
|
+3.52
1.58% |
$227.44
|
231,579
72.60% of 50 DAV
50 DAV is 319,000
|
$228.86
-1.05%
|
7/15/2020
|
$192.66
|
PP = $189.95
|
|
MB = $199.45
|
Most Recent Note - 9/28/2020 5:31:11 PM
G - Posted a gain with light volume today for its 2nd best ever close. Showed resilience and found prompt support at its 50 DMA line ($212). More damaging losses would raise greater concerns and trigger a technical sell signal. Raised fundamental concerns when it recently reported Jun '20 quarterly earnings -3% on +4% sales revenues, below the +25% minimum guideline (C criteria).
>>> FEATURED STOCK ARTICLE : Showed Resilience When Testing 50-Day Moving Average Line Again - 9/24/2020 |
View all notes |
Set NEW NOTE alert |
Company Profile |
SEC
News |
Chart |
Request a new note
C
A
S
I |
AMD
-
NASDAQ
Advanced Micro Devices
ELECTRONICS - Semiconductor - Broad Line
|
$81.99
|
+0.22
0.27% |
$82.94
|
51,378,816
77.45% of 50 DAV
50 DAV is 66,336,000
|
$94.28
-13.04%
|
8/31/2020
|
$90.42
|
PP = $87.39
|
|
MB = $91.76
|
Most Recent Note - 9/29/2020 5:15:58 PM
G - Rebounded further above its 50 DMA line ($79.22) with today's 4th consecutive gain on near average or lighter than average volume. More damaging losses below the 50 DMA line and below the recent low ($73.85 on 9/18/20) would raise greater concerns and trigger more worrisome technical sell signals. Faces near-term resistance due to overhead supply up to the $94 level. Fundamentals remain strong. See the latest FSU analysis for more details and an annotated graph.
>>> FEATURED STOCK ARTICLE : Rebound Above 50-Day Average With Light Volume Helped Stance - 9/28/2020 |
View all notes |
Set NEW NOTE alert |
Company Profile |
SEC
News |
Chart |
Request a new note
C
A
S
I |
TREX
-
NYSE
Trex Company Inc
MATERIALS and CONSTRUCTION - General Building Materials
|
$71.60
|
+0.81
1.14% |
$72.77
|
743,939
74.99% of 50 DAV
50 DAV is 992,000
|
$78.32
-8.58%
|
6/26/2020
|
$54.53
|
PP = $66.47
|
|
MB = $69.79
|
 Most Recent Note - 9/30/2020 6:23:32 PM
G - Rebounded further above its 50 DMA line ($70.49) helping its outlook to improve, but lighter than average volume was behind today's gain. More damaging losses below the recent low ($63.32 on 9/21/20) would raise serious concerns. Do not be confused by the 2:1 share split effective 9/15/20 (Featured Price, Pivot Point, and Max Buy prices have been adjusted accordingly). Fundamentals remain strong. See the latest FSU analysis for more details and a new annotated graph.
>>> FEATURED STOCK ARTICLE : TREX Rebounded Above 50-Day Moving Average - 9/30/2020 |
View all notes |
Set NEW NOTE alert |
Company Profile |
SEC
News |
Chart |
Request a new note
C
A
S
I |
NFLX
-
NASDAQ
Netflix Inc
SPECIALTY RETAIL - Music and Video Stores
|
$500.03
|
+6.55
1.33% |
$504.63
|
4,621,177
78.34% of 50 DAV
50 DAV is 5,899,000
|
$575.37
-13.09%
|
9/1/2020
|
$547.45
|
PP = $575.47
|
|
MB = $604.24
|
Most Recent Note - 9/29/2020 5:14:35 PM
G - Posted a 4th consecutive gain today with light volume, rebounding toward its 50 DMA line ($495) which is now downward sloping. That short-term average has acted as resistance. Subsequent gains back above the 50 DMA line are needed for its outlook to improve. The recent low ($458.60 on 9/18/20) defines important near term support where any further deterioration would raise more serious concerns. See the latest FSU analysis for more details and a new annotated graph.
>>> FEATURED STOCK ARTICLE : Quiet Rebound Meeting Resistance at 50-Day Moving Average - 9/29/2020 |
View all notes |
Set NEW NOTE alert |
Company Profile |
SEC
News |
Chart |
Request a new note
C
A
S
I |
Symbol/Exchange
Company Name
Industry Group |
PRICE |
CHANGE
(%Change) |
Day High |
Volume
(% DAV)
(% 50 day avg vol) |
52 Wk Hi
% From Hi |
Featured
Date |
Price
Featured |
Pivot Featured |
|
Max Buy |
LGIH
-
NASDAQ
L G I Homes Inc
Bldg-Resident/Comml
|
$116.17
|
+2.38
2.09% |
$118.75
|
220,726
74.82% of 50 DAV
50 DAV is 295,000
|
$123.94
-6.27%
|
7/7/2020
|
$99.19
|
PP = $95.82
|
|
MB = $100.61
|
Most Recent Note - 9/28/2020 5:25:10 PM
G - Rebounded above its 50 DMA line ($112.96) with today's considerable gain backed by higher (near average) volume helping its outlook to improve. Faces near-term resistance due to overhead supply up to the $123 level. More damaging losses below the latest low ($101.30 on 9/21/20) would raise greater concerns and trigger a worrisome technical sell signal. Reported Jun '20 quarterly earnings +21% on +4% sales revenues, breaking a streak of 4 comparisons above the +25% minimum guideline (C criteria).
>>> FEATURED STOCK ARTICLE : Violation of 50-Day Average on Volume Triggered Technical Sell Signal - 9/18/2020 |
View all notes |
Set NEW NOTE alert |
Company Profile |
SEC
News |
Chart |
Request a new note
C
A
S
I |
NOW
-
NYSE
Servicenow Inc
Computer Sftwr-Enterprse
|
$485.00
|
-2.98
-0.61% |
$493.31
|
1,200,205
75.39% of 50 DAV
50 DAV is 1,592,000
|
$501.82
-3.35%
|
8/20/2020
|
$453.34
|
PP = $454.79
|
|
MB = $477.53
|
Most Recent Note - 9/28/2020 5:35:27 PM
G - Consolidating above its "max buy" level near its all-time high, it found support at its 50 DMA line ($452). Fundamentals remain strong. More damaging losses below the 50 DMA line and prior low ($432.85 on 9/08/20) may raise concerns and trigger a technical sell signal. See the latest FSU analysis for more details and an annotated graph.
>>> FEATURED STOCK ARTICLE : Gain Back Above "Max Buy" Level for ServiceNow - 9/25/2020 |
View all notes |
Set NEW NOTE alert |
Company Profile |
SEC
News |
Chart |
Request a new note
C
A
S
I |
|
|
|
THESE ARE NOT BUY RECOMMENDATIONS!
Comments contained in the body of this report are technical
opinions only. The material herein has been obtained
from sources believed to be reliable and accurate, however,
its accuracy and completeness cannot be guaranteed.
This site is not an investment advisor, hence it does
not endorse or recommend any securities or other investments.
Any recommendation contained in this report may not
be suitable for all investors and it is not to be deemed
an offer or solicitation on our part with respect to
the purchase or sale of any securities. All trademarks,
service marks and trade names appearing in this report
are the property of their respective owners, and are
likewise used for identification purposes only.
This report is a service available
only to active Paid Premium Members.
You may opt-out of receiving report notifications
at any time. Questions or comments may be submitted
by writing to Premium Membership Services 665 S.E. 10 Street, Suite 201 Deerfield Beach, FL 33441-5634 or by calling 1-800-965-8307
or 954-785-1121.
|
|
|