You are not logged in.
This means you
CAN ONLY VIEW reports that were published prior to Tuesday, February 20, 2024.
You
MUST UPGRADE YOUR MEMBERSHIP if you want to see any current reports.
AFTER MARKET UPDATE - MONDAY, SEPTEMBER 30TH, 2019
Previous After Market Report Next After Market Report >>>
|
|
|
|
DOW |
+96.58 |
26,916.83 |
+0.36% |
|
Volume |
900,385,830 |
+15% |
|
Volume |
1,761,521,300 |
-13% |
|
NASDAQ |
+59.71 |
7,999.34 |
+0.75% |
|
Advancers |
1,632 |
57% |
|
Advancers |
1,738 |
56% |
|
S&P 500 |
+14.95 |
2,976.74 |
+0.50% |
|
Decliners |
1,218 |
43% |
|
Decliners |
1,385 |
44% |
|
Russell 2000 |
+2.90 |
1,523.37 |
+0.19% |
|
52 Wk Highs |
110 |
|
|
52 Wk Highs |
54 |
|
|
S&P 600 |
+1.41 |
947.72 |
+0.15% |
|
52 Wk Lows |
27 |
|
|
52 Wk Lows |
117 |
|
|
 |
Major Indices Rose With Slightly Better Leadership
Kenneth J. Gruneisen - Passed the CAN SLIM® Master's Exam
The Dow climbed 96 points, while the S&P 500 added 0.5%. The Nasdaq Composite was up 0.8%. Volume totals reported were higher than the prior session on the NYSE and lighter on the Nasdaq exchange. Breadth was positive as advancers led decliners by a 4-3 margin on the Nasdaq exchange, and by a 9-7 margin on the NYSE. There were 27 high-ranked companies from the Leaders List hit new 52-week highs and were listed on the BreakOuts Page, versus the total of 21 on the prior session. New 52-week highs totals outnumbered new 52-week lows totals on the NYSE, but new 52-week lows outnumbered new highs on the Nasdaq exchange for the fifth consecutive session. The uptrend for the major indices (M criteria) has come under pressure while leadership has recently been waning. Disciplined investors know to make new buying efforts only in stocks fitting all of the key criteria of the fact-based investment system. The Featured Stocks Page provides the most timely analysis on high-ranked leaders. Charts used courtesy of www.stockcharts.com
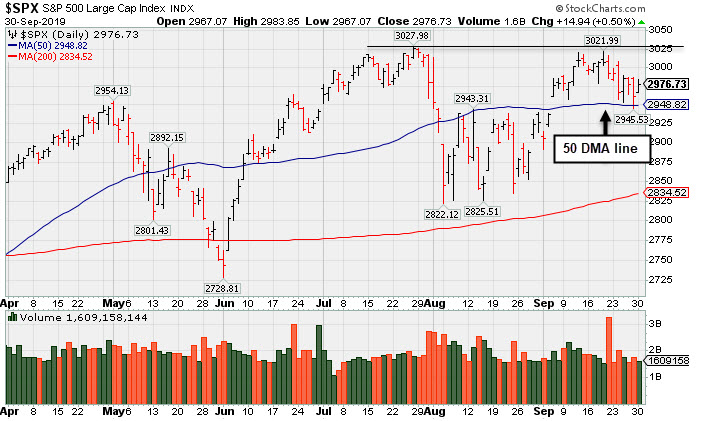
PICTURED: The S&P 500 Index is consolidating above its 50-day moving average (DMA) line. More damaging losses would bode poorly for the market outllook, meanwhile, it remains perched only -1.7% off its record high.
Stocks finished higher Monday, with the S&P 500 capping its best January to September performance in 12 years, rising 18.7% year-to-date. For the month, the Dow rallied 2%, the S&P 500 rose 1.7%, and the Nasdaq Composite edged 0.5% higher. For the third quarter, the Dow and S&P 500 both gained 1.2%, while the Nasdaq Composite slipped 0.1%.
Investors continued to monitor U.S.-China trade developments after rumors circulated Friday that the U.S. was contemplating delisting Chinese companies from U.S. stock exchanges. The rumors were later refuted, however, with market participants now awaiting in-person negotiations between the two sides on October 10th.
Nine of 11 S&P 500 sectors closed in positive territory. Technology shares paced gains, advancing more than 1%. Apple (AAPL +2.4%) rose on the heels of an analyst price target increase. The Energy group lagged as WTI crude dropped 3.3% to $54.07/barrel, capping a 7.5% quarterly decline amid weak economic data from China. Financial stocks also underperformed.
On the data front, the MNI Chicago PMI release revealed business activity in the region slipped into contractionary territory in September. Separately, the Dallas Fed Manufacturing Activity index came in above consensus estimates this month, but still below August’s reading. Treasuries were little changed, with the yield on the 10-year note down one basis point to 1.67%. In the metals complex, COMEX gold slid 1.7% to $1,473.30/ounce amid a stronger dollar.
|
 Kenneth J. Gruneisen started out as a licensed stockbroker in August 1987, a couple of months prior to the historic stock market crash that took the Dow Jones Industrial Average down -22.6% in a single day. He has published daily fact-based fundamental and technical analysis on high-ranked stocks online for two decades. Through FACTBASEDINVESTING.COM, Kenneth provides educational articles, news, market commentary, and other information regarding proven investment systems that work in good times and bad.
Comments contained in the body of this report are technical opinions only and are not necessarily those of Gruneisen Growth Corp. The material herein has been obtained from sources believed to be reliable and accurate, however, its accuracy and completeness cannot be guaranteed. Our firm, employees, and customers may effect transactions, including transactions contrary to any recommendation herein, or have positions in the securities mentioned herein or options with respect thereto. Any recommendation contained in this report may not be suitable for all investors and it is not to be deemed an offer or solicitation on our part with respect to the purchase or sale of any securities. |
|
 |
Retail and Semiconductor Index Posted Best Gains
Kenneth J. Gruneisen - Passed the CAN SLIM® Master's Exam
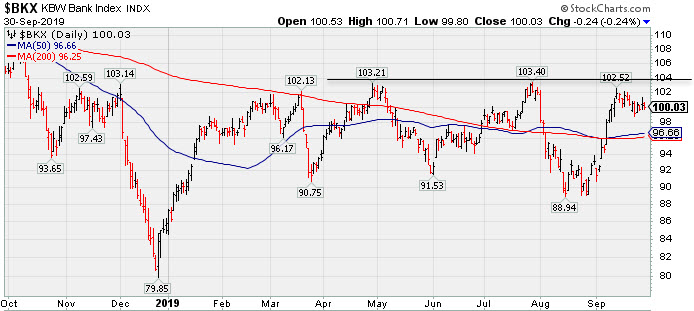
The Retail Index ($RLX +0.75%) posted a solid gain while the Bank Index ($BKX -0.24%) and the Broker/Dealer Index ($XBD -0.25%) both ended the session slightly lower. The tech sector was led higher by the Semiconductor Index ($SOX +1.03%) while the Biotech Index ($BTK +0.30%) also edged higher and the Networking Index ($NWX +0.09%) finished flat. Commodity-linked groups had a negative bias as the Gold & Silver Index ($XAU -2.94%) outpaced the Oil Services Index ($OSX -0.42%) and the Integrated Oil Index ($XOI -0.50%) to the downside.
PICTURED: The Bank Index ($BKX -0.24%) met resistance recently when approaching prior highs.
| Oil Services |
$OSX |
65.50 |
-0.28 |
-0.43% |
-18.73% |
| Integrated Oil |
$XOI |
1,208.76 |
-6.11 |
-0.50% |
+4.28% |
| Semiconductor |
$SOX |
1,558.75 |
+15.88 |
+1.03% |
+34.94% |
| Networking |
$NWX |
556.25 |
+0.52 |
+0.09% |
+13.83% |
| Broker/Dealer |
$XBD |
265.95 |
-0.67 |
-0.25% |
+12.05% |
| Retail |
$RLX |
2,347.84 |
+17.54 |
+0.75% |
+20.32% |
| Gold & Silver |
$XAU |
88.40 |
-2.67 |
-2.93% |
+25.11% |
| Bank |
$BKX |
100.03 |
-0.24 |
-0.24% |
+16.60% |
| Biotech |
$BTK |
4,215.65 |
+12.75 |
+0.30% |
-0.12% |
|
|
|
 |
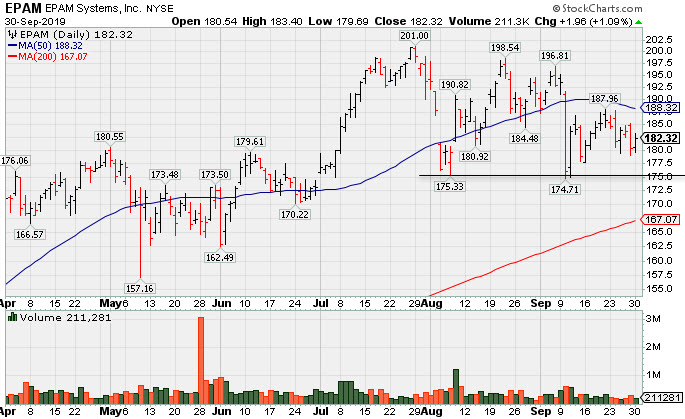
Slumped and Sputtered Below 50-Day Moving Average
Kenneth J. Gruneisen - Passed the CAN SLIM® Master's Exam
Epam Systems Inc (EPAM +$1.96 or +1.09% to $182.32) rebound above its 50-day moving average (DMA) line ($188.31) is still needed for its outlook to improve. It also faces some resistance due to overhead supply up to the $201 level.Prior lows in the $174-175 area define the next important support level where any violations may trigger more worrisome technical sell signals.
It recently reported earnings +27% on +24% sales revenues for the Jun '19 quarter, continuing its strong earnings track record. Fundamentals remain strong with a 97 Earnings Per Share Rating, well above the 80+ minimum guideline for buy candidates. The Computer - Tech Services firm's annual earnings history (A criteria) has been strong. It was last shown in this FSU section on 9/16/19 with an annotated graph under the headline, "Recent Slump Below 50-Day Average Hurt Outlook".
The number of top-rated funds owning its shares rose from 462 in Jun '17 to 854 in Jun '19, a reassuring sign concerning the I criteria. Its current Up/Down Volume Ratio of 1.1 is an unbiased indication its shares have been under slight accumulation over the past 50 days. Its small supply of only 51.6 million shares (S criteria) in the pubic float can contribute to greater volatility in the event of institutional buying or selling. Its Relative Strength rating of 91 is above the 80+ minimum guideline for buy candidates. Charts courtesy of www.stockcharts.com
 |
|
|
Color Codes Explained :
Y - Better candidates highlighted by our
staff of experts.
G - Previously featured
in past reports as yellow but may no longer be buyable under the
guidelines.
***Last / Change / Volume data in this table is the closing quote data***
Symbol/Exchange
Company Name
Industry Group |
PRICE |
CHANGE
(%Change) |
Day High |
Volume
(% DAV)
(% 50 day avg vol) |
52 Wk Hi
% From Hi |
Featured
Date |
Price
Featured |
Pivot Featured |
|
Max Buy |
 MLR
-
NYSE
MLR
-
NYSE
Miller Industries Inc
AUTOMOTIVE - Auto Parts
|
$33.30
|
-0.25
-0.75% |
$34.15
|
45,122
128.92% of 50 DAV
50 DAV is 35,000
|
$35.26
-5.56%
|
9/24/2019
|
$34.00
|
PP = $35.36
|
|
MB = $37.13
|
 Most Recent Note - 9/30/2019 5:13:27 PM
Y - Suffered another loss with above average volume today and finished near the session low. Subsequent gains above the pivot point backed by at least +40% above average volume may trigger a technical buy signal. Very little resistance remains due to overhead supply. Reported June '19 quarterly earnings +40% on +26% sales revenues versus the year ago period, and 3 of the past 4 comparisons were above the +25% minimum earnings guideline (C criteria).
>>> FEATURED STOCK ARTICLE : Encountered Distributional Pressure After Challenging Prior High - 9/24/2019 |
View all notes |
Set NEW NOTE alert |
Company Profile |
SEC
News |
Chart |
Request a new note
C
A
S
I |
CCBG
-
NASDAQ
Capital City Bk Gp
BANKING - Regional - Mid-Atlantic Banks
|
$27.45
|
+0.33
1.22% |
$27.65
|
33,905
125.57% of 50 DAV
50 DAV is 27,000
|
$28.00
-1.96%
|
9/13/2019
|
$27.03
|
PP = $27.05
|
|
MB = $28.40
|
Most Recent Note - 9/27/2019 6:35:54 PM
Y - Stalled after hitting a new 52-week high on 9/20/19 with a solid gain above the pivot point backed by +339% above average volume triggering a technical buy signal. Prior highs define initial support to watch above its 50 DMA line ($25.33). See the latest FSU analysis for more details and a new annotated graph.
>>> FEATURED STOCK ARTICLE : Stalled After Recent Rally for New High - 9/27/2019 |
View all notes |
Set NEW NOTE alert |
Company Profile |
SEC
News |
Chart |
Request a new note
C
A
S
I |
EPAM
-
NYSE
Epam Systems Inc
COMPUTER SOFTWARE and SERVICES - Information Technology Service
|
$182.32
|
+1.96
1.09% |
$183.40
|
197,011
57.27% of 50 DAV
50 DAV is 344,000
|
$201.00
-9.29%
|
5/9/2019
|
$169.25
|
PP = $180.55
|
|
MB = $189.58
|
Most Recent Note - 9/30/2019 5:09:31 PM
G - A rebound above its 50 DMA line ($188.31) is still needed for its outlook to improve. Prior lows in the $174-175 area define the next important support level. Reported earnings +27% on +24% sales revenues for the Jun '19 quarter. See the latest FSU analysis for more details and a new annotated graph.
>>> FEATURED STOCK ARTICLE : Recent Slump Below 50-Day Average Hurt Outlook - 9/16/2019 |
View all notes |
Set NEW NOTE alert |
Company Profile |
SEC
News |
Chart |
Request a new note
C
A
S
I |
AUDC
-
NASDAQ
Audiocodes Ltd
ELECTRONICS - Scientific and Technical Instrum
|
$18.91
|
-0.97
-4.88% |
$19.97
|
363,149
159.28% of 50 DAV
50 DAV is 228,000
|
$22.50
-15.96%
|
9/13/2019
|
$19.68
|
PP = $19.84
|
|
MB = $20.83
|
Most Recent Note - 9/30/2019 5:16:49 PM
Y - Today's 5th consecutive loss was backed by higher volume and undercut its prior high ($19.74 on 7/30/19) raising concerns. Its 50 DMA line ($18.49) defines important near-term support.
>>> FEATURED STOCK ARTICLE : Recent Spurt of Gains for New Highs Marked By Volume - 9/17/2019 |
View all notes |
Set NEW NOTE alert |
Company Profile |
SEC
News |
Chart |
Request a new note
C
A
S
I |
LHCG
-
NASDAQ
L H C Group Inc
HEALTH SERVICES - Home Health Care
|
$113.56
|
+0.60
0.53% |
$114.56
|
257,199
118.52% of 50 DAV
50 DAV is 217,000
|
$129.37
-12.22%
|
7/1/2019
|
$110.94
|
PP = $122.20
|
|
MB = $128.31
|
Most Recent Note - 9/26/2019 5:23:21 PM
G - Undercut the recent low ($115.06 9/10/19) raising concerns while testing support at its 200 DMA line ($112.14) with today's volume-driven loss. A rebound above its 50 DMA line ($120.38) is needed to help its outlook, however it has recently acted as resistance. See the latest FSU analysis for more details and a new annotated graph.
>>> FEATURED STOCK ARTICLE : Testing 200-Day Average as Relatve Strength Fades - 9/26/2019 |
View all notes |
Set NEW NOTE alert |
Company Profile |
SEC
News |
Chart |
Request a new note
C
A
S
I |
Symbol/Exchange
Company Name
Industry Group |
PRICE |
CHANGE
(%Change) |
Day High |
Volume
(% DAV)
(% 50 day avg vol) |
52 Wk Hi
% From Hi |
Featured
Date |
Price
Featured |
Pivot Featured |
|
Max Buy |
CHDN
-
NASDAQ
Churchill Downs Inc
LEISURE - Gaming Activities
|
$123.46
|
+1.45
1.18% |
$123.91
|
211,773
90.50% of 50 DAV
50 DAV is 234,000
|
$132.73
-6.99%
|
7/22/2019
|
$118.45
|
PP = $118.89
|
|
MB = $124.83
|
Most Recent Note - 9/30/2019 5:14:25 PM
Y - Consolidating near its 50 DMA line ($121.68). That important short-term average has acted as support in recent weeks during its consolidation. Prior lows define the next important support to watch. Jun '19 earnings +10% on +26% sales revenues versus the year ago period were below the +25% minimum earnings guideline (C criteria), noted recently raising fundamental concerns.
>>> FEATURED STOCK ARTICLE : Consolidating Above 50-Day Moving Average Line - 9/20/2019 |
View all notes |
Set NEW NOTE alert |
Company Profile |
SEC
News |
Chart |
Request a new note
C
A
S
I |
LULU
-
NASDAQ
Lululemon Athletica
MANUFACTURING - Textile Manufacturing
|
$192.53
|
+2.81
1.48% |
$193.41
|
1,183,613
67.40% of 50 DAV
50 DAV is 1,756,000
|
$204.44
-5.83%
|
9/6/2019
|
$201.25
|
PP = $194.35
|
|
MB = $204.07
|
Most Recent Note - 9/30/2019 5:11:25 PM
Y - Recently sputtering below the prior high ($194.25) raising concerns. Its 50 DMA line ($187.12) defines important near-term support to watch.
>>> FEATURED STOCK ARTICLE : Consolidating Near Prior High Following Latest Breakout - 9/18/2019 |
View all notes |
Set NEW NOTE alert |
Company Profile |
SEC
News |
Chart |
Request a new note
C
A
S
I |
CPRT
-
NASDAQ
Copart Inc
SPECIALTY RETAIL - Auto Dealerships
|
$80.33
|
+0.62
0.78% |
$80.47
|
1,017,494
74.87% of 50 DAV
50 DAV is 1,359,000
|
$83.70
-4.03%
|
9/5/2019
|
$79.13
|
PP = $79.84
|
|
MB = $83.83
|
Most Recent Note - 9/30/2019 5:08:26 PM
Y - Consolidating above its prior high ($79.74 on 7/26/19) and 50 DMA line ($78.06). More damaging losses would raise concerns and trigger technical sell signals. Remains perched near its all-time high. Fundamentals are strong.
>>> FEATURED STOCK ARTICLE : Hovering Near All-Time High Following Recent Breakout - 9/19/2019 |
View all notes |
Set NEW NOTE alert |
Company Profile |
SEC
News |
Chart |
Request a new note
C
A
S
I |
BLD
-
NYSE
Topbuild Corp
Bldg-Constr Prds/Misc
|
$96.43
|
+2.40
2.55% |
$97.20
|
379,715
130.04% of 50 DAV
50 DAV is 292,000
|
$97.99
-1.59%
|
5/17/2019
|
$82.19
|
PP = $87.31
|
|
MB = $91.68
|
Most Recent Note - 9/30/2019 12:21:23 PM
G - Perched near its all-time high, extended from the prior base after wedging higher with gains lacking great volume conviction. Earnings rose +39% on +9% sales revenues for the Jun '19 quarter versus the year ago period. Its 50 DMA line ($90.12) defines important support to watch along with its prior low ($86.53 on 8/28/19).
>>> FEATURED STOCK ARTICLE : Perched Near Record High, Extended From Prior Base - 9/23/2019 |
View all notes |
Set NEW NOTE alert |
Company Profile |
SEC
News |
Chart |
Request a new note
C
A
S
I |
PAGS
-
NYSE
Pagseguro Digital Cl A
Finance-CrdtCard/PmtPr
|
$46.31
|
+0.57
1.25% |
$46.93
|
1,501,698
78.05% of 50 DAV
50 DAV is 1,924,000
|
$53.43
-13.33%
|
6/25/2019
|
$37.69
|
PP = $40.07
|
|
MB = $42.07
|
Most Recent Note - 9/27/2019 6:39:06 PM
G - Slumped below its 50 DMA line ($47.51) with a big loss today on higher volume yet the total was below average. Prior lows in the $42-43 area define important near-term chart support to watch where violations may trigger a worrisome technical sell signal. Fundamentals are strong.
>>> FEATURED STOCK ARTICLE : Recent Lows Define Important Near-Term Support While Consolidating - 9/25/2019 |
View all notes |
Set NEW NOTE alert |
Company Profile |
SEC
News |
Chart |
Request a new note
C
A
S
I |
Symbol/Exchange
Company Name
Industry Group |
PRICE |
CHANGE
(%Change) |
Day High |
Volume
(% DAV)
(% 50 day avg vol) |
52 Wk Hi
% From Hi |
Featured
Date |
Price
Featured |
Pivot Featured |
|
Max Buy |
|
|
|
THESE ARE NOT BUY RECOMMENDATIONS!
Comments contained in the body of this report are technical
opinions only. The material herein has been obtained
from sources believed to be reliable and accurate, however,
its accuracy and completeness cannot be guaranteed.
This site is not an investment advisor, hence it does
not endorse or recommend any securities or other investments.
Any recommendation contained in this report may not
be suitable for all investors and it is not to be deemed
an offer or solicitation on our part with respect to
the purchase or sale of any securities. All trademarks,
service marks and trade names appearing in this report
are the property of their respective owners, and are
likewise used for identification purposes only.
This report is a service available
only to active Paid Premium Members.
You may opt-out of receiving report notifications
at any time. Questions or comments may be submitted
by writing to Premium Membership Services 665 S.E. 10 Street, Suite 201 Deerfield Beach, FL 33441-5634 or by calling 1-800-965-8307
or 954-785-1121.
|
|
|