***Last / Change / Volume data in this table is the closing quote data***
Symbol/Exchange
Company Name
Industry Group |
PRICE |
CHANGE
(%Change) |
Day High |
Volume
(% DAV)
(% 50 day avg vol) |
52 Wk Hi
% From Hi |
Featured
Date |
Price
Featured |
Pivot Featured |
|
Max Buy |
OSBC
-
NASDAQ
Old Second Bancorp Inc
BANKING - Regional - Midwest Banks
|
$15.45
|
+0.05
0.32% |
$15.60
|
539,109
593.73% of 50 DAV
50 DAV is 90,800
|
$16.30
-5.21%
|
9/24/2018
|
$15.38
|
PP = $16.40
|
|
MB = $17.22
|
 Most Recent Note - 9/28/2018 12:17:47 PM
Y - Churning above average volume recently without making meaningful price progress, action indicative of distributional pressure. Building a new base, consolidating above its 50 DMA line ($15.35). Prior lows and its 200 DMA line define additional near-term support. Its Relative Strength Rating is 76, below the 80+ minimum guideline for buy candidates. Met stubborn resistance after hitting a new high on 7/26/18 with a big volume-driven gain. Fundamentals remain strong.
>>> FEATURED STOCK ARTICLE : Bank Perched Less Than -5% Off Record High - 8/23/2018 |
View all notes |
Set NEW NOTE alert |
Company Profile |
SEC
News |
Chart |
Request a new note
C
A
S
I |
SIVB
-
NASDAQ
S V B Financial Group
BANKING - Regional - Pacific Banks
|
$310.83
|
-2.30
-0.73% |
$313.14
|
456,881
113.94% of 50 DAV
50 DAV is 401,000
|
$333.74
-6.86%
|
8/6/2018
|
$314.77
|
PP = $329.75
|
|
MB = $346.24
|
Most Recent Note - 9/25/2018 3:25:46 PM
Y - Consolidating above its 50 DMA line ($319.29) and perched within close striking distance of its all-time high. Subsequent gains above the pivot point backed by at least +40% above average volume may trigger a convincing new technical buy signal. The recent low ($314.03 on 9/13/18) defines the next important near-term support to watch on pullbacks.
>>> FEATURED STOCK ARTICLE : Bank Posted Quiet Gain for a Best-Ever Close - 8/27/2018 |
View all notes |
Set NEW NOTE alert |
Company Profile |
SEC
News |
Chart |
Request a new note
C
A
S
I |
GMED
-
NYSE
Globus Medical Inc Cl A
CHEMICALS - Specialty Chemicals
|
$56.76
|
+0.52
0.92% |
$56.97
|
709,352
126.67% of 50 DAV
50 DAV is 560,000
|
$57.55
-1.37%
|
9/26/2018
|
$56.11
|
PP = $57.65
|
|
MB = $60.53
|
Most Recent Note - 9/27/2018 11:25:01 AM
Y - Finished near the middle of its intra-day range after highlighted in yellow with pivot point cited based on its 6/06/18 high plus 10 cents in the prior mid-day report. Perched within close striking distance of its all-time high following volume-driven gains. Subsequent gains above the pivot point backed by more than +40% above average volume are needed to trigger a proper technical buy signal. Reported earnings +38% on +14% sales revenues for the Jun '18 quarter. The Medical - Products firm has technology to treat patients with spine disorders. Reported earnings +38% on +14% sales revenues for the Jun '18 quarter, its 2nd strong quarterly comparison above the +25% minimum guideline (C criteria). Annual earnings (A criteria) growth has been steady. See the latest FSU analysis for more details and an annotated graph.
>>> FEATURED STOCK ARTICLE : Rallying Near Pivot Point With Volume-Driven Gains - 9/26/2018 |
View all notes |
Set NEW NOTE alert |
Company Profile |
SEC
News |
Chart |
Request a new note
C
A
S
I |
ZBRA
-
NASDAQ
Zebra Tech Corp Cl A
COMPUTER HARDWARE - Computer Peripherals
|
$176.83
|
-1.41
-0.79% |
$178.88
|
268,277
73.70% of 50 DAV
50 DAV is 364,000
|
$179.47
-1.47%
|
8/7/2018
|
$164.26
|
PP = $161.82
|
|
MB = $169.91
|
Most Recent Note - 9/24/2018 5:11:07 PM
G - Hovering near its all-time high. Prior high in the $161 area defines support coinciding with its 50 DMA line. Fundamentals remain strong. See the latest FSU analysis for more details and an annotated graph.
>>> FEATURED STOCK ARTICLE : Hovering Near All-Time High With Strong Fundamentals - 9/24/2018 |
View all notes |
Set NEW NOTE alert |
Company Profile |
SEC
News |
Chart |
Request a new note
C
A
S
I |
EPAM
-
NYSE
Epam Systems Inc
COMPUTER SOFTWARE and SERVICES - Information Technology Service
|
$137.70
|
+0.28
0.20% |
$138.66
|
198,279
45.69% of 50 DAV
50 DAV is 434,000
|
$144.19
-4.50%
|
7/5/2018
|
$123.70
|
PP = $131.85
|
|
MB = $138.44
|
Most Recent Note - 9/25/2018 3:14:37 PM
Y - Color code is changed to yellow while quietly sputtering just below its "max buy" level. Volume totals have been cooling in recent weeks after a bout of distributional pressure. Prior highs in the $137 area define near term support along with its 50 DMA line ($135.68). Fundamentals remain strong.
>>> FEATURED STOCK ARTICLE : Tech Services Firm Remains Fundamentally and Technically Strong - 8/20/2018 |
View all notes |
Set NEW NOTE alert |
Company Profile |
SEC
News |
Chart |
Request a new note
C
A
S
I |
Symbol/Exchange
Company Name
Industry Group |
PRICE |
CHANGE
(%Change) |
Day High |
Volume
(% DAV)
(% 50 day avg vol) |
52 Wk Hi
% From Hi |
Featured
Date |
Price
Featured |
Pivot Featured |
|
Max Buy |
IRBT
-
NASDAQ
Irobot Corp
CONSUMER DURABLES - Electronic Equipment
|
$109.92
|
+1.20
1.10% |
$110.48
|
413,642
41.66% of 50 DAV
50 DAV is 993,000
|
$118.75
-7.44%
|
8/29/2018
|
$112.07
|
PP = $109.88
|
|
MB = $115.37
|
Most Recent Note - 9/25/2018 2:58:20 PM
Y - Posting a 2nd consecutive quiet gain today after slumping below its pivot point raising concerns. Prior low ($99.73 on 9/07/18) defines important near-term support to watch. Very little resistance remains due to overhead supply.
>>> FEATURED STOCK ARTICLE : Household Appliance Maker Rallied From Choppy Base - 8/29/2018 |
View all notes |
Set NEW NOTE alert |
Company Profile |
SEC
News |
Chart |
Request a new note
C
A
S
I |
TSC
-
NASDAQ
TriState Capital Hld Inc
CONSUMER NON-DURABLES - Personal Products
|
$27.60
|
+0.35
1.28% |
$27.60
|
323,757
175.95% of 50 DAV
50 DAV is 184,000
|
$30.10
-8.31%
|
9/11/2018
|
$29.75
|
PP = $30.20
|
|
MB = $31.71
|
Most Recent Note - 9/24/2018 4:23:05 PM
G - Failing to rebound after recently violating its 50 DMA line. A rebound above the 50 DMA line ($29.03) is needed for its outlook to improve.
>>> FEATURED STOCK ARTICLE : TriState Bank Perched Near All-Time High - 9/11/2018 |
View all notes |
Set NEW NOTE alert |
Company Profile |
SEC
News |
Chart |
Request a new note
C
A
S
I |
FLT
-
NYSE
Fleetcor Technologies
DIVERSIFIED SERVICES - Business/Management Services
|
$227.84
|
+0.42
0.18% |
$230.13
|
884,218
166.52% of 50 DAV
50 DAV is 531,000
|
$228.04
-0.09%
|
9/12/2018
|
$221.01
|
PP = $226.02
|
|
MB = $237.32
|
Most Recent Note - 9/25/2018 3:19:11 PM
Y - Challenging its record high with today's gain on light volume. Its 50 DMA line ($218.08) defines near-term support to watch on pullbacks. New pivot point cited was based on its 7/25/18 high plus 10 cents. Subsequent volume-driven gains above the pivot point may trigger a new (or add-on) technical buy signal.
>>> FEATURED STOCK ARTICLE : Perched Within Close Striking Distance of New Pivot Point - 9/20/2018 |
View all notes |
Set NEW NOTE alert |
Company Profile |
SEC
News |
Chart |
Request a new note
C
A
S
I |
MA
-
NYSE
Mastercard Inc Cl A
Finance-CrdtCard/PmtPr
|
$222.61
|
+0.30
0.13% |
$223.69
|
2,954,912
93.45% of 50 DAV
50 DAV is 3,162,000
|
$224.36
-0.78%
|
7/11/2018
|
$203.84
|
PP = $204.10
|
|
MB = $214.31
|
Most Recent Note - 9/27/2018 6:20:10 PM
G - Stubbornly holding its ground at its all-time high, extended from any sound base. Its 50 DMA line ($209.77) defines important near-term support. Fundamentals remain strong. See the latest FSU analysis for more details and a new annotated graph.
>>> FEATURED STOCK ARTICLE : Hovering Near High, Extended From Any Sound Base - 9/27/2018 |
View all notes |
Set NEW NOTE alert |
Company Profile |
SEC
News |
Chart |
Request a new note
C
A
S
I |
V
-
NYSE
Visa Inc Cl A
Finance-CrdtCard/PmtPr
|
$150.09
|
+0.07
0.05% |
$150.37
|
6,006,919
82.97% of 50 DAV
50 DAV is 7,240,000
|
$150.64
-0.37%
|
4/26/2018
|
$126.68
|
PP = $126.98
|
|
MB = $133.33
|
Most Recent Note - 9/24/2018 4:24:15 PM
G - Perched near its all-time high, very extended from any sound base. Its 50 DMA line ($142.77) and recent low ($135.31 on 7/30/18) define important near-term support to watch on pullbacks. Fundamentals remain strong.
>>> FEATURED STOCK ARTICLE : Visa Near Record but Endured Distributional Pressure - 9/13/2018 |
View all notes |
Set NEW NOTE alert |
Company Profile |
SEC
News |
Chart |
Request a new note
C
A
S
I |
Symbol/Exchange
Company Name
Industry Group |
PRICE |
CHANGE
(%Change) |
Day High |
Volume
(% DAV)
(% 50 day avg vol) |
52 Wk Hi
% From Hi |
Featured
Date |
Price
Featured |
Pivot Featured |
|
Max Buy |
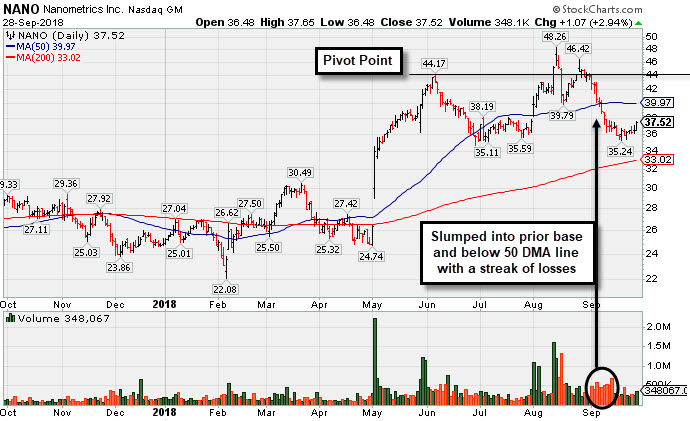
NANO
-
NASDAQ
Nanometrics Inc
ELECTRONICS - Scientific and Technical Instrum
|
$37.52
|
+1.07
2.94% |
$37.65
|
348,674
81.28% of 50 DAV
50 DAV is 429,000
|
$48.26
-22.25%
|
8/13/2018
|
$44.17
|
PP = $44.27
|
|
MB = $46.48
|
Most Recent Note - 9/24/2018 4:29:26 PM
G - Slumped well below its 50 DMA line ($40) with recent volume-driven losses raising concerns. Prior low ($34.72 on 6/28/18) defines important near-term support above its 200 DMA line. A rebound above the 50 DMA line is needed for its outlook to improve. Fundamentals remain strong.
>>> FEATURED STOCK ARTICLE : Rebound Above 50-Day Average Needed For Outlook to Improve - 9/28/2018 |
View all notes |
Set NEW NOTE alert |
Company Profile |
SEC
News |
Chart |
Request a new note
C
A
S
I |
ENV
-
NYSE
Envestnet Inc
FINANCIAL SERVICES - Diversified Investments
|
$60.95
|
+0.15
0.25% |
$62.30
|
192,351
70.02% of 50 DAV
50 DAV is 274,700
|
$64.80
-5.94%
|
6/15/2018
|
$57.85
|
PP = $60.37
|
|
MB = $63.39
|
Most Recent Note - 9/21/2018 7:22:22 PM
Y - It found support recently near its 50 DMA line ($60.85). Still perched near its all-time high, stubbornly holding its ground. in recent weeks. Fundamentals remain strong. See the latest FSU analysis for more details and a new annotated graph.
>>> FEATURED STOCK ARTICLE : Found Recent Support at 50-Day Moving Average - 9/21/2018 |
View all notes |
Set NEW NOTE alert |
Company Profile |
SEC
News |
Chart |
Request a new note
C
A
S
I |
TPL
-
NYSE
Texas Pacific Land Trust
Real Estate Dvlpmt/Ops
|
$862.56
|
-2.50
-0.29% |
$871.10
|
20,120
167.67% of 50 DAV
50 DAV is 12,000
|
$874.00
-1.31%
|
9/14/2018
|
$820.45
|
PP = $874.10
|
|
MB = $917.81
|
Most Recent Note - 9/28/2018 12:38:49 PM
Y - Perched near its all-time high. Held its ground in a tight range in recent weeks. New pivot point cited was based on its 8/27/18 high plus 10 cents. Subsequent gains above the pivot point back by at least +40% above average volume may trigger a new (or add-on) technical buy signal. The recent low ($818 on 9/17/18) and 50 DMA line ($813) define important near-term support to watch on pullbacks.
>>> FEATURED STOCK ARTICLE : Best Ever Close After a Solid Gain on Higher Volume - 9/4/2018 |
View all notes |
Set NEW NOTE alert |
Company Profile |
SEC
News |
Chart |
Request a new note
C
A
S
I |
FIZZ
-
NASDAQ
National Beverage Corp
FOOD and BEVERAGE - Beverages - Soft Drinks
|
$116.62
|
+2.36
2.07% |
$117.19
|
255,156
133.87% of 50 DAV
50 DAV is 190,600
|
$127.32
-8.40%
|
9/6/2018
|
$125.92
|
PP = $129.92
|
|
MB = $136.42
|
Most Recent Note - 9/27/2018 6:22:07 PM
Y - Color code is changed to yellow after today's prompt rebound above the 50 DMA line ($113.30) helped its outlook improve. Subsequent gains above the pivot point for a new high (N criteria) backed by at least +40% above average volume are still needed to trigger a proper technical buy signal. Fundamentals through Jun '18 have been strong.
>>> FEATURED STOCK ARTICLE : Strong Beverage Firm Challenges Prior High - 9/6/2018 |
View all notes |
Set NEW NOTE alert |
Company Profile |
SEC
News |
Chart |
Request a new note
C
A
S
I |
ABMD
-
NASDAQ
Abiomed Inc
HEALTH SERVICES - Medical Instruments and Supplies
|
$449.75
|
+6.86
1.55% |
$455.40
|
696,236
110.87% of 50 DAV
50 DAV is 628,000
|
$454.00
-0.94%
|
9/25/2018
|
$441.96
|
PP = $451.03
|
|
MB = $473.58
|
Most Recent Note - 9/25/2018 6:29:02 PM
Y - Finished strong today with above average volume behind a 3rd consecutive gain in a 6 session winning streak. Color code was changed to yellow with new pivot point cited based on its 6/20/18 high plus 10 cents in the earlier mid-day report. Subsequent gains for a new high (N criteria) above the pivot point backed by at least +40% above average volume may trigger a technical buy signal. Reported Jun '18 quarterly earnings +73% on +36% sales revenues. The past 7 quarterly comparisons had earnings above the +25% minimum guideline (C criteria). Downturn in FY '14 annual earnings (A criteria) history was noted as a concern, yet its growth rate afterward has been great. See the latest FSU analysis for more details and a new annotated graph.
>>> FEATURED STOCK ARTICLE : Quick Rebound Near Prior High - 9/25/2018 |
View all notes |
Set NEW NOTE alert |
Company Profile |
SEC
News |
Chart |
Request a new note
C
A
S
I |
Symbol/Exchange
Company Name
Industry Group |
PRICE |
CHANGE
(%Change) |
Day High |
Volume
(% DAV)
(% 50 day avg vol) |
52 Wk Hi
% From Hi |
Featured
Date |
Price
Featured |
Pivot Featured |
|
Max Buy |
ODFL
-
NASDAQ
Old Dominion Fght Line
TRANSPORTATION - Trucking
|
$161.26
|
+0.59
0.37% |
$161.67
|
327,141
54.71% of 50 DAV
50 DAV is 598,000
|
$170.22
-5.26%
|
9/6/2018
|
$163.11
|
PP = $164.20
|
|
MB = $172.41
|
Most Recent Note - 9/21/2018 1:05:14 PM
Y - Enduring distributional pressure this week, undercutting prior highs in the $164 area. Raised concerns while completely negating the recent technical breakout and slumping back into the prior base.
>>> FEATURED STOCK ARTICLE : Trucking Firm Perched at All-Time High - 9/7/2018 |
View all notes |
Set NEW NOTE alert |
Company Profile |
SEC
News |
Chart |
Request a new note
C
A
S
I |
DPZ
-
NYSE
Dominos Pizza Inc
Retail-Restaurants
|
$294.80
|
+1.35
0.46% |
$297.56
|
408,932
71.00% of 50 DAV
50 DAV is 576,000
|
$305.34
-3.45%
|
8/13/2018
|
$288.60
|
PP = $293.91
|
|
MB = $308.61
|
Most Recent Note - 9/27/2018 6:25:01 PM
Y - Found prompt support in recent weeks, consolidating above its 50 DMA line ($283.89) and near the previously cited pivot point.
>>> FEATURED STOCK ARTICLE : Pulling Back After Wedging Gains for Highs Lacked Great Volume - 9/5/2018 |
View all notes |
Set NEW NOTE alert |
Company Profile |
SEC
News |
Chart |
Request a new note
C
A
S
I |
FIVE
-
NASDAQ
Five Below Inc
Retail-DiscountandVariety
|
$130.06
|
+1.40
1.09% |
$130.88
|
600,359
63.20% of 50 DAV
50 DAV is 950,000
|
$136.13
-4.46%
|
7/6/2018
|
$98.90
|
PP = $104.09
|
|
MB = $109.29
|
Most Recent Note - 9/25/2018 3:16:17 PM
G - Remains very extended from any sound base, well above its 50 DMA line ($112) and prior high ($109.09 on 7/19/18) defining near-term support to watch. Earnings rose +40% on +23% sales revenues for the Jul '18 quarter, continuing its strong earnings track record.
>>> FEATURED STOCK ARTICLE : Volume Totals Cooling While Perched Near Record High - 8/16/2018 |
View all notes |
Set NEW NOTE alert |
Company Profile |
SEC
News |
Chart |
Request a new note
C
A
S
I |
NOW
-
NYSE
Servicenow Inc
Computer Sftwr-Enterprse
|
$195.63
|
+0.55
0.28% |
$197.80
|
1,201,657
63.58% of 50 DAV
50 DAV is 1,890,000
|
$206.30
-5.17%
|
8/24/2018
|
$193.83
|
PP = $194.91
|
|
MB = $204.66
|
Most Recent Note - 9/25/2018 2:52:35 PM
Y - Found prompt support and rebounded above the 50 DMA line ($189.59) helping its outlook improve, and its color code is changed to yellow. Recent low ($174.35 on 7/31/18) defines important near-term support above its 200 DMA line. Fundamentals remain strong.
>>> FEATURED STOCK ARTICLE : Slump Below 50-Day Average Line Raises Concerns - 8/17/2018 |
View all notes |
Set NEW NOTE alert |
Company Profile |
SEC
News |
Chart |
Request a new note
C
A
S
I |
NVEE
-
NASDAQ
N V 5 Global Inc
Comml Svcs-Consulting
|
$86.70
|
+1.50
1.76% |
$86.75
|
70,958
84.47% of 50 DAV
50 DAV is 84,000
|
$92.75
-6.52%
|
6/15/2018
|
$7,070.00
|
PP = $72.00
|
|
MB = $75.60
|
Most Recent Note - 9/26/2018 6:43:32 PM
G - Slumped below its 50 DMA line ($84.53) with a big volume-driven loss today triggering a technical sell signal. Only a prompt rebound would help its outlook improve.
>>> FEATURED STOCK ARTICLE : Remains Perched Near All-Time High Following Offering - 8/21/2018 |
View all notes |
Set NEW NOTE alert |
Company Profile |
SEC
News |
Chart |
Request a new note
C
A
S
I |
Symbol/Exchange
Company Name
Industry Group |
PRICE |
CHANGE
(%Change) |
Day High |
Volume
(% DAV)
(% 50 day avg vol) |
52 Wk Hi
% From Hi |
Featured
Date |
Price
Featured |
Pivot Featured |
|
Max Buy |
PANW
-
NYSE
Palo Alto Networks
Computer Sftwr-Security
|
$225.26
|
-0.51
-0.23% |
$228.11
|
1,108,139
91.13% of 50 DAV
50 DAV is 1,216,000
|
$239.50
-5.95%
|
6/12/2018
|
$206.55
|
PP = $214.69
|
|
MB = $225.42
|
Most Recent Note - 9/25/2018 3:22:11 PM
G - Volume totals in recent weeks have been cooling while holding its ground stubbornly near its all-time high. It is extended from any sound base. Its 50 DMA line ($219.31) coincides with the prior high ($219.38 on 7/13/18) defining important near term support to watch. Fundamentals remain strong.
>>> FEATURED STOCK ARTICLE : Perched Near All-Time High With Volume Totals Cooling - 9/17/2018 |
View all notes |
Set NEW NOTE alert |
Company Profile |
SEC
News |
Chart |
Request a new note
C
A
S
I |
QLYS
-
NASDAQ
Qualys Inc
Computer Sftwr-Security
|
$89.10
|
+0.55
0.62% |
$89.75
|
169,093
49.30% of 50 DAV
50 DAV is 343,000
|
$98.30
-9.36%
|
8/31/2018
|
$91.05
|
PP = $98.40
|
|
MB = $103.32
|
Most Recent Note - 9/25/2018 2:54:16 PM
Y - Rebounding above its 50 DMA line ($90) helping its outlook improve and its color code is changed to yellow. The recent low ($82.91 on 8/15/18) defines the next important near term support to watch. Subsequent volume-driven gains above the pivot point are needed to trigger a technical buy signal.
>>> FEATURED STOCK ARTICLE : Cloud Security Firm Faces Some Near Term Resistance - 9/3/2018 |
View all notes |
Set NEW NOTE alert |
Company Profile |
SEC
News |
Chart |
Request a new note
C
A
S
I |
ANET
-
NYSE
"Arista Networks, Inc"
TELECOMMUNICATIONS - Communication Equipment
|
$265.86
|
+0.53
0.20% |
$269.00
|
475,876
40.88% of 50 DAV
50 DAV is 1,164,100
|
$313.37
-15.16%
|
8/24/2018
|
$308.26
|
PP = $311.77
|
|
MB = $327.36
|
Most Recent Note - 9/26/2018 6:41:33 PM
G - Slumped to a close below its 200 DMA line ($265) today raising more serious concerns. Only a prompt rebound above its 50 DMA line ($273) would help its outlook improve. Relative Strength Rating has slumped to 79. Faces near-term resistance due to overhead supply up to the $313 level.
>>> FEATURED STOCK ARTICLE : Considerable Gap Up Gain With Heavy Volume - 8/24/2018 |
View all notes |
Set NEW NOTE alert |
Company Profile |
SEC
News |
Chart |
Request a new note
C
A
S
I |
PAYC
-
NYSE
Paycom Software Inc
COMPUTER SOFTWARE and SERVICES - Application Software
|
$155.41
|
+0.43
0.28% |
$157.19
|
382,431
48.72% of 50 DAV
50 DAV is 785,000
|
$164.08
-5.28%
|
8/1/2018
|
$122.87
|
PP = $118.55
|
|
MB = $124.48
|
Most Recent Note - 9/25/2018 2:44:09 PM
G - Hovering near its all-time high, very extended from any sound base. Its 50 DMA line ($139.19) defines near-term support to watch on pullbacks. Fundamentals remain strong.
>>> FEATURED STOCK ARTICLE : Very Extended From Base After Impressive Rally - 9/18/2018 |
View all notes |
Set NEW NOTE alert |
Company Profile |
SEC
News |
Chart |
Request a new note
C
A
S
I |
GRUB
-
NYSE
Grubhub Inc
INTERNET - Content
|
$138.62
|
-1.17
-0.84% |
$140.37
|
906,041
62.75% of 50 DAV
50 DAV is 1,444,000
|
$149.35
-7.18%
|
8/24/2018
|
$138.44
|
PP = $141.16
|
|
MB = $148.22
|
Most Recent Note - 9/25/2018 2:56:45 PM
Y - Finding support above its 50 DMA line ($132.46) with a quiet gain today after losses with heavier volume indicative of distributional pressure. Recent gains lacked great volume conviction. Gains above the pivot point backed by at least +40% above average volume are needed to trigger a proper new (or add-on) technical buy signal.
>>> FEATURED STOCK ARTICLE : Wedged Higher Then Fell Below Pivot Point With Heavier Volume - 9/19/2018 |
View all notes |
Set NEW NOTE alert |
Company Profile |
SEC
News |
Chart |
Request a new note
C
A
S
I |
Symbol/Exchange
Company Name
Industry Group |
PRICE |
CHANGE
(%Change) |
Day High |
Volume
(% DAV)
(% 50 day avg vol) |
52 Wk Hi
% From Hi |
Featured
Date |
Price
Featured |
Pivot Featured |
|
Max Buy |
HQY
-
NASDAQ
Healthequity Inc
COMPUTER SOFTWARE and SERVICES - Healthcare Information Service
|
$94.41
|
+1.01
1.08% |
$95.58
|
478,683
66.58% of 50 DAV
50 DAV is 719,000
|
$99.99
-5.58%
|
8/13/2018
|
$82.39
|
PP = $83.44
|
|
MB = $87.61
|
Most Recent Note - 9/24/2018 4:07:06 PM
G - Extended from any sound base, consolidating above its 50 DMA line ($86.86) and prior highs in the $82-83 area defining additional near-term support to watch.
>>> FEATURED STOCK ARTICLE : Very Extended From Any Sound Base After Streak of Gains - 9/10/2018 |
View all notes |
Set NEW NOTE alert |
Company Profile |
SEC
News |
Chart |
Request a new note
C
A
S
I |
PYPL
-
NASDAQ
Paypal Holdings Inc
Finance-CrdtCard/PmtPr
|
$87.84
|
-1.15
-1.29% |
$89.05
|
7,876,341
100.43% of 50 DAV
50 DAV is 7,843,000
|
$93.70
-6.25%
|
7/23/2018
|
$89.24
|
PP = $87.55
|
|
MB = $91.93
|
Most Recent Note - 9/24/2018 4:03:49 PM
Y - Consolidating near its 50 DMA line ($88.35), while the next important support is at prior lows in the $80-81 area.
>>> FEATURED STOCK ARTICLE : Consolidating Above 50-Day Moving Average Near High - 9/12/2018 |
View all notes |
Set NEW NOTE alert |
Company Profile |
SEC
News |
Chart |
Request a new note
C
A
S
I |
OLLI
-
NASDAQ
Ollie's Bargain Outlet
Retail-DiscountandVariety
|
$96.10
|
+1.75
1.85% |
$96.35
|
510,628
84.54% of 50 DAV
50 DAV is 604,000
|
$95.80
0.31%
|
7/12/2018
|
$74.43
|
PP = $77.60
|
|
MB = $81.48
|
Most Recent Note - 9/21/2018 1:05:49 PM
G - Perched at its all-time high, extended from any sound base. Prior highs in the $77 area define support along with its 50 DMA line ($79.38). Reported earnings +48% on +13% sales revenues for the Jul '18 quarter, continuing its strong earnings track record.
>>> FEATURED STOCK ARTICLE : Hitting New Highs With More Volume-Driven Gains - 8/22/2018 |
View all notes |
Set NEW NOTE alert |
Company Profile |
SEC
News |
Chart |
Request a new note
C
A
S
I |
NOVT
-
NASDAQ
Novanta Inc
Elec-Scientific/Msrng
|
$68.40
|
-0.15
-0.22% |
$68.95
|
222,652
102.13% of 50 DAV
50 DAV is 218,000
|
$78.85
-13.25%
|
7/12/2018
|
$65.90
|
PP = $68.10
|
|
MB = $71.51
|
Most Recent Note - 9/26/2018 6:38:32 PM
G - Slumped further below its 50 DMA line ($71.24) today. Raised concerns while also undercutting prior highs in the $68-69 area triggering technical sell signals.
>>> FEATURED STOCK ARTICLE : Electronic Systems Leader is Extended From Prior Base - 8/30/2018 |
View all notes |
Set NEW NOTE alert |
Company Profile |
SEC
News |
Chart |
Request a new note
C
A
S
I |
TEAM
-
NASDAQ
Atlassian Corp Plc Cl A
Comp Sftwr-Spec Enterprs
|
$96.14
|
+0.25
0.26% |
$97.06
|
1,866,097
130.13% of 50 DAV
50 DAV is 1,434,000
|
$96.45
-0.32%
|
7/27/2018
|
$73.73
|
PP = $68.85
|
|
MB = $72.29
|
Most Recent Note - 9/24/2018 3:59:51 PM
G - Posting a gain and rallying near its all-time high today with average volume. Extended from any sound base. The 50 DMA line ($80.48) defines near-term support to watch on pullbacks. Fundamentals through Jun '18 have been strong.
>>> FEATURED STOCK ARTICLE : Extended From Base and Hitting Another New High - 9/14/2018 |
View all notes |
Set NEW NOTE alert |
Company Profile |
SEC
News |
Chart |
Request a new note
C
A
S
I |
Symbol/Exchange
Company Name
Industry Group |
PRICE |
CHANGE
(%Change) |
Day High |
Volume
(% DAV)
(% 50 day avg vol) |
52 Wk Hi
% From Hi |
Featured
Date |
Price
Featured |
Pivot Featured |
|
Max Buy |
SEND
-
NYSE
Sendgrid Inc
INTERNET - Content
|
$36.79
|
+0.11
0.30% |
$36.98
|
399,154
43.91% of 50 DAV
50 DAV is 909,000
|
$38.66
-4.84%
|
8/13/2018
|
$32.20
|
PP = $32.13
|
|
MB = $33.74
|
Most Recent Note - 9/25/2018 3:27:53 PM
G - Rebounding near its all-time high with today's big gain, but it is extended from any sound base. Prior highs in the $32 area define initial support to watch coinciding with its 50 DMA line ($32.36).
>>> FEATURED STOCK ARTICLE : Strength Returned After Finding Support Near Prior Lows - 8/14/2018 |
View all notes |
Set NEW NOTE alert |
Company Profile |
SEC
News |
Chart |
Request a new note
C
A
S
I |