You are not logged in.
This means you
CAN ONLY VIEW reports that were published prior to Sunday, February 18, 2024.
You
MUST UPGRADE YOUR MEMBERSHIP if you want to see any current reports.
AFTER MARKET UPDATE - FRIDAY, SEPTEMBER 27TH, 2019
Previous After Market Report Next After Market Report >>>
|
|
|
|
DOW |
-70.87 |
26,820.25 |
-0.26% |
|
Volume |
779,883,160 |
+3% |
|
Volume |
2,019,826,767 |
+9% |
|
NASDAQ |
-91.03 |
7,939.63 |
-1.13% |
|
Advancers |
1,311 |
46% |
|
Advancers |
1,074 |
35% |
|
S&P 500 |
-15.83 |
2,961.79 |
-0.53% |
|
Decliners |
1,514 |
54% |
|
Decliners |
2,023 |
65% |
|
Russell 2000 |
-12.85 |
1,520.48 |
-0.84% |
|
52 Wk Highs |
96 |
|
|
52 Wk Highs |
46 |
|
|
S&P 600 |
-6.17 |
946.31 |
-0.65% |
|
52 Wk Lows |
30 |
|
|
52 Wk Lows |
120 |
|
|
 |
Major Indices Endure More Distributional Pressure
Kenneth J. Gruneisen - Passed the CAN SLIM® Master's Exam
The Dow reversed early session gains and fell 71 points, losing 0.4% for the week. The S&P 500 was off 0.5% to cap a 1.0% weekly decline. The Nasdaq Composite shed 1.1%, retreating 2.2% for the week. Behind the declines, volume totals reported were higher than the prior session on the NYSE and on the Nasdaq exchange, indicative of institutional selling pressure termed "distribution".. Breadth was negative as decliners led advancers by a 2-1 margin on the Nasdaq exchange, and by a narrower 8-7 margin on the NYSE. There were 21 high-ranked companies from the Leaders List hit new 52-week highs and were listed on the BreakOuts Page, versus the total of 31 on the prior session. New 52-week highs totals outnumbered new 52-week lows totals on the NYSE, but new 52-week lows outnumbered new highs on the Nasdaq exchange for the fourth consecutive session. The uptrend for the major indices (M criteria) has come under pressure while leadership has recently been waning. Disciplined investors know to make new buying efforts only in stocks fitting all of the key criteria of the fact-based investment system. The Featured Stocks Page provides the most timely analysis on high-ranked leaders. Charts used courtesy of www.stockcharts.com
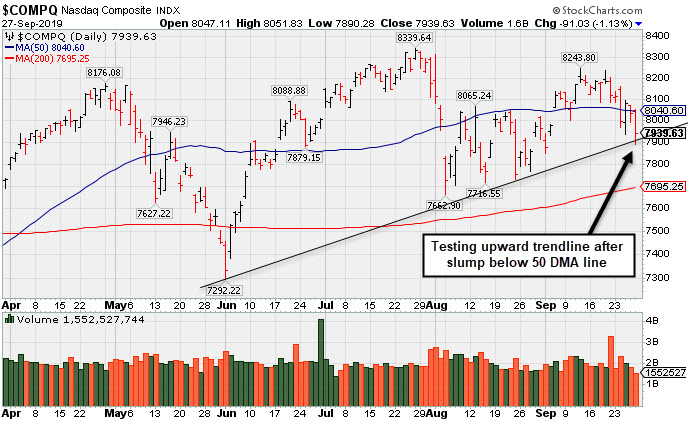
PICTURED: The Nasdaq Composite Index is testing a multi-month upward trendline after slumping below its 50-day moving average (DMA) line again raised concerns. More damaging losses would bode poorly for the market outllook, meanwhile, it remains perched only 4.8% off its record high.
Stocks finished lower Friday to cap a second consecutive week of declines amid reports that the U.S. is considering limiting investment flows into China. This follows morning reports that indicated U.S. and Chinese trade officials will resume in-person negotiations on October 10th in Washington D.C.
On the data front, the Fed’s preferred gauge of inflation, core PCE Deflator, climbed at a 1.8% annualized rate in August, above the prior month’s upwardly revised 1.7% figure. Separately, personal income ticked up 0.4% in August while personal spending climbed by 0.1% in the same time period. A final reading on consumer sentiment levels in September from the University of Michigan came in strong at 93.2, above the prior reading of 92.0. Treasuries strengthened with the yield on the 10-year note dropping two basis points to 1.68%.
Six of 11 S&P 500 sectors closed in negative territory with Communication Services and Technology stocks pacing the decline. Shares of Chinese Tech stocks took a hit Friday with Alibaba (BABA -5.15%). Micron Technology (MU -11.09%) declined the most in nearly four years after the chipmaker offered cautious current quarter guidance due to uneasy economic conditions around the globe. In other corporate news, Las Vegas Sands (LVS +2.20%) rose on news the company will be added to the S&P 500 index next week.
|
 Kenneth J. Gruneisen started out as a licensed stockbroker in August 1987, a couple of months prior to the historic stock market crash that took the Dow Jones Industrial Average down -22.6% in a single day. He has published daily fact-based fundamental and technical analysis on high-ranked stocks online for two decades. Through FACTBASEDINVESTING.COM, Kenneth provides educational articles, news, market commentary, and other information regarding proven investment systems that work in good times and bad.
Comments contained in the body of this report are technical opinions only and are not necessarily those of Gruneisen Growth Corp. The material herein has been obtained from sources believed to be reliable and accurate, however, its accuracy and completeness cannot be guaranteed. Our firm, employees, and customers may effect transactions, including transactions contrary to any recommendation herein, or have positions in the securities mentioned herein or options with respect thereto. Any recommendation contained in this report may not be suitable for all investors and it is not to be deemed an offer or solicitation on our part with respect to the purchase or sale of any securities. |
|
 |
Bank Index Rose as Retail, Tech, and Commodity-Linked Groups Fell
Kenneth J. Gruneisen - Passed the CAN SLIM® Master's Exam
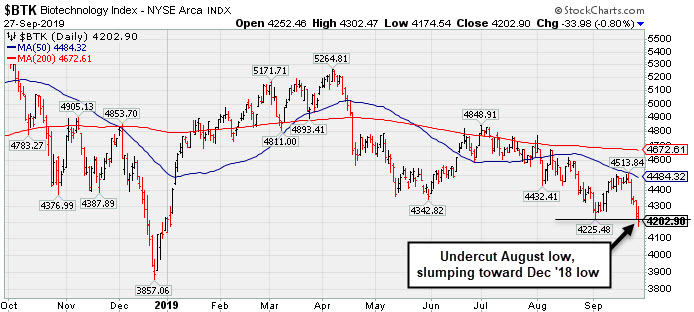
The Bank Index ($BKX +0.52%) rose while the Broker/Dealer Index ($XBD +0.08%) finished flat and the Retail Index ($RLX -0.43%) ended lower. The tech sector was led lower by the Semiconductor Index ($SOX -2.36%) while the Biotech Index ($BTK -0.80%) and the Networking Index ($NWX -0.39%) both suffered smaller losses. Commodity-linked groups had a negative bias as the Gold & Silver Index ($XAU -2.25%) and Oil Services Index ($OSX -1.26%) fell, however, the Integrated Oil Index ($XOI -0.04%) finished unchanged.
PICTURED: The Biotech Index ($BTK -0.80%) met resistance recently at its 50-day moving average (DMA) line. With Friday's loss it slumped below its August lows toward the multi-year low last seen in Dec '18.
| Oil Services |
$OSX |
65.78 |
-0.84 |
-1.26% |
-18.39% |
| Integrated Oil |
$XOI |
1,214.87 |
-0.43 |
-0.03% |
+4.81% |
| Semiconductor |
$SOX |
1,542.87 |
-37.23 |
-2.36% |
+33.56% |
| Networking |
$NWX |
555.73 |
-2.19 |
-0.39% |
+13.72% |
| Broker/Dealer |
$XBD |
266.62 |
+0.21 |
+0.08% |
+12.34% |
| Retail |
$RLX |
2,330.30 |
-10.13 |
-0.43% |
+19.42% |
| Gold & Silver |
$XAU |
91.07 |
-2.10 |
-2.25% |
+28.88% |
| Bank |
$BKX |
100.27 |
+0.52 |
+0.52% |
+16.88% |
| Biotech |
$BTK |
4,202.90 |
-33.98 |
-0.80% |
-0.43% |
|
|
|
 |
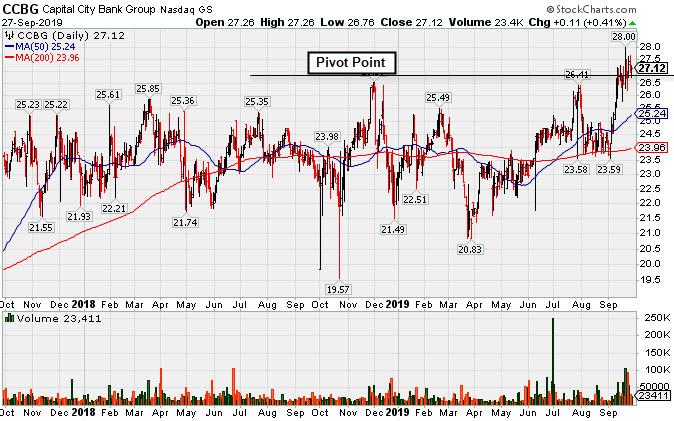
Stalled After Recent Rally for New High
Kenneth J. Gruneisen - Passed the CAN SLIM® Master's Exam
Capital City Bk Gp (CCBG +$0.11 or +0.41% to $27.12) was highlighted in yellow with pivot point cited based on its 12/03/18 high plus 10 cents in the 9/13/19 mid-day report (read here). it stalled after hitting a new 52-week high on 9/20/19 with a solid gain above the pivot point backed by +339% above average volume triggering a technical buy signal. Prior highs in the $26 area define initial support to watch above its 50-day moving average (DMA) line ($25.33). It was last shown in this FSU section on 9/13/19 with an annotated graph under the headline, "Thinly Traded Bank Rallied To Multi-Year Highs".
Earnings increases in the 3 latest quarterly comparisons through Jun '19 were above the +25% minimum guideline (C criteria) as its sales revenues growth rate was in the 12-13% range in the Dec '18, Mar and Jun '19 quarters versus the year ago periods. It has a Timeliness Rating of A, but a Sponsorship Rating of D.
Its small supply of only 16.7 million shares outstanding (S criteria) can contribute to greater price volatility in the event of institutional buying or selling. The number of top-rated funds owning its shares rose from 159 on Sep '18 to 186 in Jun '19, a reassuring sign concerning the I criteria. Its current Up/Down Volume Ratio of 1.6 is an unbiased indication its shares have been under accumulation over the past 50 days.
|
|
|
Color Codes Explained :
Y - Better candidates highlighted by our
staff of experts.
G - Previously featured
in past reports as yellow but may no longer be buyable under the
guidelines.
***Last / Change / Volume data in this table is the closing quote data***
Symbol/Exchange
Company Name
Industry Group |
PRICE |
CHANGE
(%Change) |
Day High |
Volume
(% DAV)
(% 50 day avg vol) |
52 Wk Hi
% From Hi |
Featured
Date |
Price
Featured |
Pivot Featured |
|
Max Buy |
 MLR
-
NYSE
MLR
-
NYSE
Miller Industries Inc
AUTOMOTIVE - Auto Parts
|
$33.55
|
-0.02
-0.06% |
$34.26
|
31,448
89.85% of 50 DAV
50 DAV is 35,000
|
$35.26
-4.85%
|
9/24/2019
|
$34.00
|
PP = $35.36
|
|
MB = $37.13
|
Most Recent Note - 9/24/2019 7:50:52 PM
Y - Suffered a loss with above average volume and finished near the session low. Highlighted in yellow with new pivot point cited based on its 3/05/19 high plus 10 cents in the earlier mid-day report while noted - "Subsequent gains above the pivot point backed by at least +40% above average volume may trigger a technical buy signal. Very little resistance remains due to overhead supply. Reported June '19 quarterly earnings +40% on +26% sales revenues versus the year ago period, and 3 of the past 4 comparisons were above the +25% minimum earnings guideline (C criteria)." See the latest FSU analysis for more details and a new annotated graph.
>>> FEATURED STOCK ARTICLE : Encountered Distributional Pressure After Challenging Prior High - 9/24/2019 |
View all notes |
Set NEW NOTE alert |
Company Profile |
SEC
News |
Chart |
Request a new note
C
A
S
I |
CCBG
-
NASDAQ
Capital City Bk Gp
BANKING - Regional - Mid-Atlantic Banks
|
$27.12
|
+0.11
0.41% |
$27.26
|
23,408
90.03% of 50 DAV
50 DAV is 26,000
|
$28.00
-3.14%
|
9/13/2019
|
$27.03
|
PP = $27.05
|
|
MB = $28.40
|
 Most Recent Note - 9/27/2019 6:35:54 PM
Y - Stalled after hitting a new 52-week high on 9/20/19 with a solid gain above the pivot point backed by +339% above average volume triggering a technical buy signal. Prior highs define initial support to watch above its 50 DMA line ($25.33). See the latest FSU analysis for more details and a new annotated graph.
>>> FEATURED STOCK ARTICLE : Stalled After Recent Rally for New High - 9/27/2019 |
View all notes |
Set NEW NOTE alert |
Company Profile |
SEC
News |
Chart |
Request a new note
C
A
S
I |
EPAM
-
NYSE
Epam Systems Inc
COMPUTER SOFTWARE and SERVICES - Information Technology Service
|
$180.36
|
-3.28
-1.79% |
$185.28
|
264,470
75.78% of 50 DAV
50 DAV is 349,000
|
$201.00
-10.27%
|
5/9/2019
|
$169.25
|
PP = $180.55
|
|
MB = $189.58
|
Most Recent Note - 9/23/2019 5:42:06 PM
G - A rebound above its 50 DMA line ($189.64) is still needed for its outlook to improve. Prior lows in the $174-175 area define the next important support level. Reported earnings +27% on +24% sales revenues for the Jun '19 quarter.
>>> FEATURED STOCK ARTICLE : Recent Slump Below 50-Day Average Hurt Outlook - 9/16/2019 |
View all notes |
Set NEW NOTE alert |
Company Profile |
SEC
News |
Chart |
Request a new note
C
A
S
I |
AUDC
-
NASDAQ
Audiocodes Ltd
ELECTRONICS - Scientific and Technical Instrum
|
$19.88
|
-0.32
-1.58% |
$20.49
|
216,743
95.06% of 50 DAV
50 DAV is 228,000
|
$22.50
-11.64%
|
9/13/2019
|
$19.68
|
PP = $19.84
|
|
MB = $20.83
|
Most Recent Note - 9/26/2019 5:25:16 PM
Y - Color code was changed to yellow while pulling back below its "max buy" level following a "negative reversal" at its all-time high. Its prior high ($19.74 on 7/30/19) defines initial support to watch above its 50 DMA line ($18.35).
>>> FEATURED STOCK ARTICLE : Recent Spurt of Gains for New Highs Marked By Volume - 9/17/2019 |
View all notes |
Set NEW NOTE alert |
Company Profile |
SEC
News |
Chart |
Request a new note
C
A
S
I |
LHCG
-
NASDAQ
L H C Group Inc
HEALTH SERVICES - Home Health Care
|
$112.96
|
-0.82
-0.72% |
$115.37
|
175,847
81.37% of 50 DAV
50 DAV is 216,100
|
$129.37
-12.68%
|
7/1/2019
|
$110.94
|
PP = $122.20
|
|
MB = $128.31
|
Most Recent Note - 9/26/2019 5:23:21 PM
G - Undercut the recent low ($115.06 9/10/19) raising concerns while testing support at its 200 DMA line ($112.14) with today's volume-driven loss. A rebound above its 50 DMA line ($120.38) is needed to help its outlook, however it has recently acted as resistance. See the latest FSU analysis for more details and a new annotated graph.
>>> FEATURED STOCK ARTICLE : Testing 200-Day Average as Relatve Strength Fades - 9/26/2019 |
View all notes |
Set NEW NOTE alert |
Company Profile |
SEC
News |
Chart |
Request a new note
C
A
S
I |
Symbol/Exchange
Company Name
Industry Group |
PRICE |
CHANGE
(%Change) |
Day High |
Volume
(% DAV)
(% 50 day avg vol) |
52 Wk Hi
% From Hi |
Featured
Date |
Price
Featured |
Pivot Featured |
|
Max Buy |
CHDN
-
NASDAQ
Churchill Downs Inc
LEISURE - Gaming Activities
|
$122.01
|
-0.61
-0.50% |
$123.48
|
225,272
96.68% of 50 DAV
50 DAV is 233,000
|
$132.73
-8.08%
|
7/22/2019
|
$118.45
|
PP = $118.89
|
|
MB = $124.83
|
Most Recent Note - 9/25/2019 6:01:44 PM
Y - Posted a gain today with above average volume while sputtering near its 50 DMA line ($121). That important short-term average has acted as support in recent weeks during its consolidation. Prior lows define the next important support to watch. Jun '19 earnings +10% on +26% sales revenues versus the year ago period were below the +25% minimum earnings guideline (C criteria), noted recently raising fundamental concerns.
>>> FEATURED STOCK ARTICLE : Consolidating Above 50-Day Moving Average Line - 9/20/2019 |
View all notes |
Set NEW NOTE alert |
Company Profile |
SEC
News |
Chart |
Request a new note
C
A
S
I |
LULU
-
NASDAQ
Lululemon Athletica
MANUFACTURING - Textile Manufacturing
|
$189.72
|
-1.82
-0.95% |
$192.96
|
1,116,014
63.59% of 50 DAV
50 DAV is 1,755,000
|
$204.44
-7.20%
|
9/6/2019
|
$201.25
|
PP = $194.35
|
|
MB = $204.07
|
Most Recent Note - 9/23/2019 12:27:27 PM
Y - Rebounding today after a loss with above average volume on the prior session undercut the prior high ($194.25). Its 50 DMA line ($186.83) defines important near-term support to watch.
>>> FEATURED STOCK ARTICLE : Consolidating Near Prior High Following Latest Breakout - 9/18/2019 |
View all notes |
Set NEW NOTE alert |
Company Profile |
SEC
News |
Chart |
Request a new note
C
A
S
I |
CPRT
-
NASDAQ
Copart Inc
SPECIALTY RETAIL - Auto Dealerships
|
$79.71
|
-1.20
-1.48% |
$81.07
|
931,512
68.54% of 50 DAV
50 DAV is 1,359,000
|
$83.70
-4.77%
|
9/5/2019
|
$79.13
|
PP = $79.84
|
|
MB = $83.83
|
Most Recent Note - 9/23/2019 5:40:08 PM
Y - Remains perched near its all-time high. Held its ground stubbornly after the big volume-driven gain above the pivot point on 9/05/19 clinched a technical buy signal. Fundamentals are strong. See the latest FSU analysis for more details and an annotated graph.
>>> FEATURED STOCK ARTICLE : Hovering Near All-Time High Following Recent Breakout - 9/19/2019 |
View all notes |
Set NEW NOTE alert |
Company Profile |
SEC
News |
Chart |
Request a new note
C
A
S
I |
BLD
-
NYSE
Topbuild Corp
Bldg-Constr Prds/Misc
|
$94.03
|
-1.89
-1.97% |
$96.48
|
247,053
84.61% of 50 DAV
50 DAV is 292,000
|
$97.99
-4.04%
|
5/17/2019
|
$82.19
|
PP = $87.31
|
|
MB = $91.68
|
Most Recent Note - 9/23/2019 5:34:17 PM
G - Perched near its all-time high, extended from the prior base. Earnings rose +39% on +9% sales revenues for the Jun '19 quarter versus the year ago period. Its 50 DMA line ($88.71) defines important support to watch along with its prior low ($86.53 on 8/28/19). See the latest FSU analysis for more details and a new annotated graph.
>>> FEATURED STOCK ARTICLE : Perched Near Record High, Extended From Prior Base - 9/23/2019 |
View all notes |
Set NEW NOTE alert |
Company Profile |
SEC
News |
Chart |
Request a new note
C
A
S
I |
PAGS
-
NYSE
Pagseguro Digital Cl A
Finance-CrdtCard/PmtPr
|
$45.74
|
-2.17
-4.53% |
$48.22
|
1,709,361
86.46% of 50 DAV
50 DAV is 1,977,000
|
$53.43
-14.39%
|
6/25/2019
|
$37.69
|
PP = $40.07
|
|
MB = $42.07
|
Most Recent Note - 9/27/2019 6:39:06 PM
G - Slumped below its 50 DMA line ($47.51) with a big loss today on higher volume yet the total was below average. Prior lows in the $42-43 area define important near-term chart support to watch where violations may trigger a worrisome technical sell signal. Fundamentals are strong.
>>> FEATURED STOCK ARTICLE : Recent Lows Define Important Near-Term Support While Consolidating - 9/25/2019 |
View all notes |
Set NEW NOTE alert |
Company Profile |
SEC
News |
Chart |
Request a new note
C
A
S
I |
Symbol/Exchange
Company Name
Industry Group |
PRICE |
CHANGE
(%Change) |
Day High |
Volume
(% DAV)
(% 50 day avg vol) |
52 Wk Hi
% From Hi |
Featured
Date |
Price
Featured |
Pivot Featured |
|
Max Buy |
|
|
|
THESE ARE NOT BUY RECOMMENDATIONS!
Comments contained in the body of this report are technical
opinions only. The material herein has been obtained
from sources believed to be reliable and accurate, however,
its accuracy and completeness cannot be guaranteed.
This site is not an investment advisor, hence it does
not endorse or recommend any securities or other investments.
Any recommendation contained in this report may not
be suitable for all investors and it is not to be deemed
an offer or solicitation on our part with respect to
the purchase or sale of any securities. All trademarks,
service marks and trade names appearing in this report
are the property of their respective owners, and are
likewise used for identification purposes only.
This report is a service available
only to active Paid Premium Members.
You may opt-out of receiving report notifications
at any time. Questions or comments may be submitted
by writing to Premium Membership Services 665 S.E. 10 Street, Suite 201 Deerfield Beach, FL 33441-5634 or by calling 1-800-965-8307
or 954-785-1121.
|
|
|