You are not logged in.
This means you
CAN ONLY VIEW reports that were published prior to Sunday, February 25, 2024.
You
MUST UPGRADE YOUR MEMBERSHIP if you want to see any current reports.
AFTER MARKET UPDATE - THURSDAY, SEPTEMBER 26TH, 2019
Previous After Market Report Next After Market Report >>>
|
|
|
|
DOW |
-79.59 |
26,891.12 |
-0.30% |
|
Volume |
755,415,710 |
-10% |
|
Volume |
1,860,806,127 |
-7% |
|
NASDAQ |
-46.72 |
8,030.66 |
-0.58% |
|
Advancers |
1,234 |
43% |
|
Advancers |
993 |
32% |
|
S&P 500 |
-7.25 |
2,977.62 |
-0.24% |
|
Decliners |
1,619 |
57% |
|
Decliners |
2,079 |
68% |
|
Russell 2000 |
-17.33 |
1,533.33 |
-1.12% |
|
52 Wk Highs |
136 |
|
|
52 Wk Highs |
46 |
|
|
S&P 600 |
-10.28 |
952.48 |
-1.07% |
|
52 Wk Lows |
36 |
|
|
52 Wk Lows |
105 |
|
|
 |
Breadth Negative as Major Indices Sputter
Kenneth J. Gruneisen - Passed the CAN SLIM® Master's Exam
The Dow slipped 79 points, while the S&P 500 declined 0.2%. The Nasdaq Composite lost 0.6%. The volume totals reported were lighter than the prior session on the NYSE and on the Nasdaq exchange. Breadth was negative as decliners led advancers by a 2-1 margin on the Nasdaq exchange and by a 4-3 margin on the NYSE. There were 31 high-ranked companies from the Leaders List hit new 52-week highs and were listed on the BreakOuts Page, versus the total of 21 on the prior session. New 52-week highs totals outnumbered new 52-week lows totals on the NYSE, but new lows outnumbered new highs on the Nasdaq exchange for the third consecutive session. The uptrend for the major indices (M criteria) has come under pressure while leadership has recently been waning. Disciplined investors know to make new buying efforts only in stocks fitting all of the key criteria of the fact-based investment system. The Featured Stocks Page provides the most timely analysis on high-ranked leaders. Charts used courtesy of www.stockcharts.com
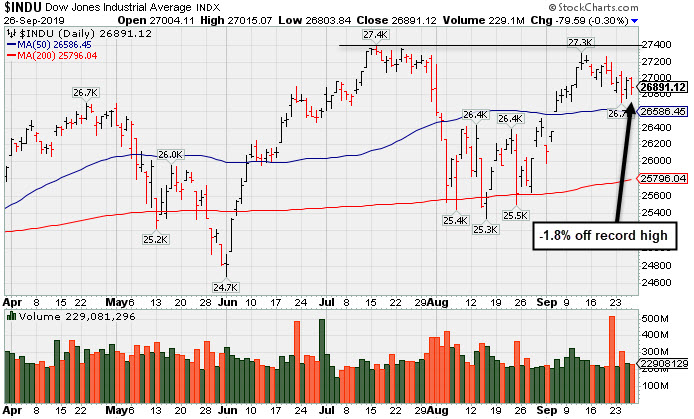
PICTURED: The Dow Jones Industrial Average is consolidating above its 50-day moving average (DMA) line. It remains perched only 1.8% off its record high.
Stocks finished lower Thursday as political uncertainties in Washington D.C. weighed on investor sentiment. Trade news remained in focus after China’s Commerce Ministry suggest its domestic companies could agree to purchase “sizable amounts” of U.S. agricultural goods ahead of in-person talks next month. However, a separate update hinted White House officials are unlikely to extend the temporary waivers that allowed U.S. tech companies to supply components to Huawei.
On the data front, the final update on second quarter GDP came in unrevised at a 2.0% annualized pace. A preliminary August reading on wholesale inventories ticked up 0.4% from the prior month’s downwardly revised figure of 0.1%. Treasuries strengthened, with the yield on the benchmark 10-year note off three basis points to 1.70%.
Six of 11 S&P 500 sectors finished in negative territory with Energy stocks pacing the decline. Communication Services shares also underperformed as Facebook (FB -1.47%) fell amid reports the Justice Department will open an anti-trust investigation into the social media giant. The perceived “defensive” Utilities, Real Estate, and Consumer Staples groups outperformed and helped offset the broader market weakness. In corporate news, Beyond Meat (BYND +11.58%) rose after McDonald’s (MCD -0.01%) revealed plans to test the plant-based burgers at 28 restaurants in Canada.
In commodities, WTI crude was essentially unchanged at $56.51/barrel. COMEX gold declined 0.1% to $1,503.50/ounce. The U.S. dollar index climbed 0.2%, following yesterday’s rally, which saw the greenback post its biggest one-day jump since March.
|
 Kenneth J. Gruneisen started out as a licensed stockbroker in August 1987, a couple of months prior to the historic stock market crash that took the Dow Jones Industrial Average down -22.6% in a single day. He has published daily fact-based fundamental and technical analysis on high-ranked stocks online for two decades. Through FACTBASEDINVESTING.COM, Kenneth provides educational articles, news, market commentary, and other information regarding proven investment systems that work in good times and bad.
Comments contained in the body of this report are technical opinions only and are not necessarily those of Gruneisen Growth Corp. The material herein has been obtained from sources believed to be reliable and accurate, however, its accuracy and completeness cannot be guaranteed. Our firm, employees, and customers may effect transactions, including transactions contrary to any recommendation herein, or have positions in the securities mentioned herein or options with respect thereto. Any recommendation contained in this report may not be suitable for all investors and it is not to be deemed an offer or solicitation on our part with respect to the purchase or sale of any securities. |
|
 |
Financial, Retail, Tech, and Commodity-Linked Groups Fell
Kenneth J. Gruneisen - Passed the CAN SLIM® Master's Exam
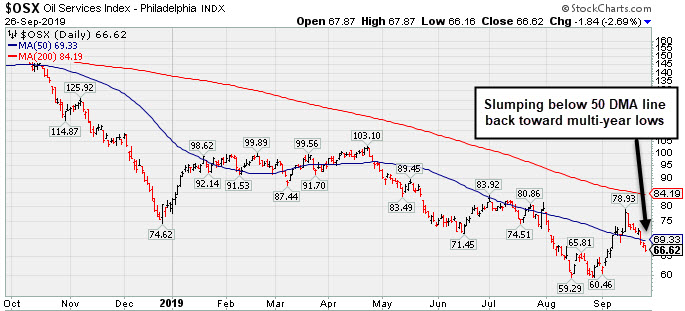
The Bank Index ($BKX -2.22%), Broker/Dealer Index ($XBD -1.24%), and the Retail Index ($RLX -0.78%) ended unanimously lower. The tech sector was led lower by the Biotech Index ($BTK -2.22%) and the Networking Index ($NWX -0.77%) had a negative bias while the Semiconductor Index ($SOX +0.03%) finished flat on the session. Commodity-linked groups had a negative bias as the Gold & Silver Index ($XAU -1.45%), Oil Services Index ($OSX -2.69%), and the Integrated Oil Index ($XOI -1.13%) suffered unanimous losses.
PICTURED: The Oil Services Index ($OSX -2.69%) is slumping back below its 50-day moving average (DMA) line toward multi-year lows.
| Oil Services |
$OSX |
66.62 |
-1.84 |
-2.69% |
-17.34% |
| Integrated Oil |
$XOI |
1,215.30 |
-13.88 |
-1.13% |
+4.85% |
| Semiconductor |
$SOX |
1,580.10 |
+0.54 |
+0.03% |
+36.79% |
| Networking |
$NWX |
557.92 |
-4.34 |
-0.77% |
+14.17% |
| Broker/Dealer |
$XBD |
266.40 |
-3.35 |
-1.24% |
+12.25% |
| Retail |
$RLX |
2,340.43 |
-18.37 |
-0.78% |
+19.94% |
| Gold & Silver |
$XAU |
93.17 |
-1.37 |
-1.45% |
+31.86% |
| Bank |
$BKX |
99.75 |
-0.69 |
-0.69% |
+16.27% |
| Biotech |
$BTK |
4,236.88 |
-96.22 |
-2.22% |
+0.38% |
|
|
|
 |
Testing 200-Day Average as Relatve Strength Fades
Kenneth J. Gruneisen - Passed the CAN SLIM® Master's Exam
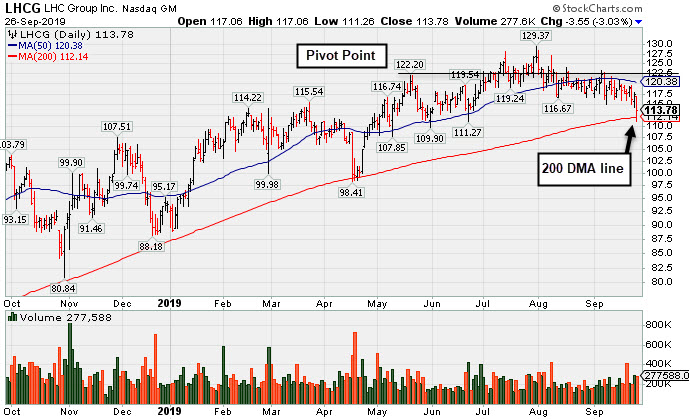
L H C Group Inc (LHCG -$3.55 or -3.03% to $113.78) undercut the recent low ($115.06 9/10/19) with today's volume-driven loss testing its 200-day moving average (DMA) line ($112.14). Its Relative Strength rating has slumped to 79, below the 80+ minimum guideline for buy candidates. Subsequent losses below the 200 DMA line would raise more serious concerns. A rebound above its 50 DMA line ($120.38) is needed to help its outlook. LHCG last shown in this FSU section on 9/12/19 with an annotated graph under the headline, "50-Day Moving Average Recently Acted as Resistance".
Fundamentals remain strong after it reported earnings +27% on +3% sales revenues for the Jun '19 quarter, continuing its strong earnings track record above the +25% minimum guideline (C criteria). Its annual earnings growth (A criteria) has been strong, and it has a current Earnings Per Share Rating of 98.
The number of top-rated funds owning its shares roe from 441 in Sep '18 to 533 in Jun '19 and the current Up/Down Volume Ratio of 1.3 is an unbiased indication its shares have been under accumulation over the past 50 days, a reassuring sign concerning the I criteria. It has earned an A Timeliness Rating and a C Sponsorship Rating. It has a small supply of only 31.5 million shares (S criteria) outstanding, which can contribute to greater volatility in the event of institutional buying or selling. |
|
|
Color Codes Explained :
Y - Better candidates highlighted by our
staff of experts.
G - Previously featured
in past reports as yellow but may no longer be buyable under the
guidelines.
***Last / Change / Volume data in this table is the closing quote data***
Symbol/Exchange
Company Name
Industry Group |
PRICE |
CHANGE
(%Change) |
Day High |
Volume
(% DAV)
(% 50 day avg vol) |
52 Wk Hi
% From Hi |
Featured
Date |
Price
Featured |
Pivot Featured |
|
Max Buy |
 MLR
-
NYSE
MLR
-
NYSE
Miller Industries Inc
AUTOMOTIVE - Auto Parts
|
$33.57
|
-0.20
-0.59% |
$33.96
|
20,994
59.98% of 50 DAV
50 DAV is 35,000
|
$35.26
-4.79%
|
9/24/2019
|
$34.00
|
PP = $35.36
|
|
MB = $37.13
|
Most Recent Note - 9/24/2019 7:50:52 PM
Y - Suffered a loss with above average volume and finished near the session low. Highlighted in yellow with new pivot point cited based on its 3/05/19 high plus 10 cents in the earlier mid-day report while noted - "Subsequent gains above the pivot point backed by at least +40% above average volume may trigger a technical buy signal. Very little resistance remains due to overhead supply. Reported June '19 quarterly earnings +40% on +26% sales revenues versus the year ago period, and 3 of the past 4 comparisons were above the +25% minimum earnings guideline (C criteria)." See the latest FSU analysis for more details and a new annotated graph.
>>> FEATURED STOCK ARTICLE : Encountered Distributional Pressure After Challenging Prior High - 9/24/2019 |
View all notes |
Set NEW NOTE alert |
Company Profile |
SEC
News |
Chart |
Request a new note
C
A
S
I |
CCBG
-
NASDAQ
Capital City Bk Gp
BANKING - Regional - Mid-Atlantic Banks
|
$27.01
|
-0.42
-1.53% |
$27.67
|
30,072
115.66% of 50 DAV
50 DAV is 26,000
|
$28.00
-3.54%
|
9/13/2019
|
$27.03
|
PP = $27.05
|
|
MB = $28.40
|
Most Recent Note - 9/25/2019 12:01:43 PM
Y - Stalled after hitting a new 52-week high on 9/20/19 with a solid gain above the pivot point backed by +339% above average volume triggering a technical buy signal. Prior highs define initial support to watch above its 50 DMA line ($25.23).
>>> FEATURED STOCK ARTICLE : Thinly Traded Bank Rallied To Multi-Year Highs - 9/13/2019 |
View all notes |
Set NEW NOTE alert |
Company Profile |
SEC
News |
Chart |
Request a new note
C
A
S
I |
EPAM
-
NYSE
Epam Systems Inc
COMPUTER SOFTWARE and SERVICES - Information Technology Service
|
$183.64
|
-0.19
-0.10% |
$184.88
|
191,711
54.62% of 50 DAV
50 DAV is 351,000
|
$201.00
-8.64%
|
5/9/2019
|
$169.25
|
PP = $180.55
|
|
MB = $189.58
|
Most Recent Note - 9/23/2019 5:42:06 PM
G - A rebound above its 50 DMA line ($189.64) is still needed for its outlook to improve. Prior lows in the $174-175 area define the next important support level. Reported earnings +27% on +24% sales revenues for the Jun '19 quarter.
>>> FEATURED STOCK ARTICLE : Recent Slump Below 50-Day Average Hurt Outlook - 9/16/2019 |
View all notes |
Set NEW NOTE alert |
Company Profile |
SEC
News |
Chart |
Request a new note
C
A
S
I |
AUDC
-
NASDAQ
Audiocodes Ltd
ELECTRONICS - Scientific and Technical Instrum
|
$20.20
|
-0.49
-2.37% |
$20.59
|
130,102
56.81% of 50 DAV
50 DAV is 229,000
|
$22.50
-10.22%
|
9/13/2019
|
$19.68
|
PP = $19.84
|
|
MB = $20.83
|
 Most Recent Note - 9/26/2019 5:25:16 PM
Y - Color code was changed to yellow while pulling back below its "max buy" level following a "negative reversal" at its all-time high. Its prior high ($19.74 on 7/30/19) defines initial support to watch above its 50 DMA line ($18.35).
>>> FEATURED STOCK ARTICLE : Recent Spurt of Gains for New Highs Marked By Volume - 9/17/2019 |
View all notes |
Set NEW NOTE alert |
Company Profile |
SEC
News |
Chart |
Request a new note
C
A
S
I |
LHCG
-
NASDAQ
L H C Group Inc
HEALTH SERVICES - Home Health Care
|
$113.78
|
-3.55
-3.03% |
$117.06
|
277,588
129.11% of 50 DAV
50 DAV is 215,000
|
$129.37
-12.05%
|
7/1/2019
|
$110.94
|
PP = $122.20
|
|
MB = $128.31
|
Most Recent Note - 9/26/2019 5:23:21 PM
G - Undercut the recent low ($115.06 9/10/19) raising concerns while testing support at its 200 DMA line ($112.14) with today's volume-driven loss. A rebound above its 50 DMA line ($120.38) is needed to help its outlook, however it has recently acted as resistance. See the latest FSU analysis for more details and a new annotated graph.
>>> FEATURED STOCK ARTICLE : Testing 200-Day Average as Relatve Strength Fades - 9/26/2019 |
View all notes |
Set NEW NOTE alert |
Company Profile |
SEC
News |
Chart |
Request a new note
C
A
S
I |
Symbol/Exchange
Company Name
Industry Group |
PRICE |
CHANGE
(%Change) |
Day High |
Volume
(% DAV)
(% 50 day avg vol) |
52 Wk Hi
% From Hi |
Featured
Date |
Price
Featured |
Pivot Featured |
|
Max Buy |
CHDN
-
NASDAQ
Churchill Downs Inc
LEISURE - Gaming Activities
|
$122.62
|
-1.08
-0.87% |
$123.94
|
269,407
116.63% of 50 DAV
50 DAV is 231,000
|
$132.73
-7.62%
|
7/22/2019
|
$118.45
|
PP = $118.89
|
|
MB = $124.83
|
Most Recent Note - 9/25/2019 6:01:44 PM
Y - Posted a gain today with above average volume while sputtering near its 50 DMA line ($121). That important short-term average has acted as support in recent weeks during its consolidation. Prior lows define the next important support to watch. Jun '19 earnings +10% on +26% sales revenues versus the year ago period were below the +25% minimum earnings guideline (C criteria), noted recently raising fundamental concerns.
>>> FEATURED STOCK ARTICLE : Consolidating Above 50-Day Moving Average Line - 9/20/2019 |
View all notes |
Set NEW NOTE alert |
Company Profile |
SEC
News |
Chart |
Request a new note
C
A
S
I |
LULU
-
NASDAQ
Lululemon Athletica
MANUFACTURING - Textile Manufacturing
|
$191.54
|
-1.48
-0.77% |
$193.93
|
962,366
54.87% of 50 DAV
50 DAV is 1,754,000
|
$204.44
-6.31%
|
9/6/2019
|
$201.25
|
PP = $194.35
|
|
MB = $204.07
|
Most Recent Note - 9/23/2019 12:27:27 PM
Y - Rebounding today after a loss with above average volume on the prior session undercut the prior high ($194.25). Its 50 DMA line ($186.83) defines important near-term support to watch.
>>> FEATURED STOCK ARTICLE : Consolidating Near Prior High Following Latest Breakout - 9/18/2019 |
View all notes |
Set NEW NOTE alert |
Company Profile |
SEC
News |
Chart |
Request a new note
C
A
S
I |
CPRT
-
NASDAQ
Copart Inc
SPECIALTY RETAIL - Auto Dealerships
|
$80.91
|
-0.13
-0.16% |
$81.38
|
1,028,013
75.70% of 50 DAV
50 DAV is 1,358,000
|
$83.70
-3.33%
|
9/5/2019
|
$79.13
|
PP = $79.84
|
|
MB = $83.83
|
Most Recent Note - 9/23/2019 5:40:08 PM
Y - Remains perched near its all-time high. Held its ground stubbornly after the big volume-driven gain above the pivot point on 9/05/19 clinched a technical buy signal. Fundamentals are strong. See the latest FSU analysis for more details and an annotated graph.
>>> FEATURED STOCK ARTICLE : Hovering Near All-Time High Following Recent Breakout - 9/19/2019 |
View all notes |
Set NEW NOTE alert |
Company Profile |
SEC
News |
Chart |
Request a new note
C
A
S
I |
BLD
-
NYSE
Topbuild Corp
Bldg-Constr Prds/Misc
|
$95.92
|
-1.51
-1.55% |
$97.99
|
197,885
67.77% of 50 DAV
50 DAV is 292,000
|
$97.66
-1.78%
|
5/17/2019
|
$82.19
|
PP = $87.31
|
|
MB = $91.68
|
Most Recent Note - 9/23/2019 5:34:17 PM
G - Perched near its all-time high, extended from the prior base. Earnings rose +39% on +9% sales revenues for the Jun '19 quarter versus the year ago period. Its 50 DMA line ($88.71) defines important support to watch along with its prior low ($86.53 on 8/28/19). See the latest FSU analysis for more details and a new annotated graph.
>>> FEATURED STOCK ARTICLE : Perched Near Record High, Extended From Prior Base - 9/23/2019 |
View all notes |
Set NEW NOTE alert |
Company Profile |
SEC
News |
Chart |
Request a new note
C
A
S
I |
PAGS
-
NYSE
Pagseguro Digital Cl A
Finance-CrdtCard/PmtPr
|
$47.91
|
+0.87
1.85% |
$48.19
|
1,143,674
56.98% of 50 DAV
50 DAV is 2,007,000
|
$53.43
-10.33%
|
6/25/2019
|
$37.69
|
PP = $40.07
|
|
MB = $42.07
|
Most Recent Note - 9/25/2019 5:58:58 PM
G - Gain today was backed by light volume as it rebounded near its 50 DMA line ($47.47) which may act as resistance. Prior lows in the $42-43 area define the next important chart support level to watch. Fundamentals are strong. See the latest FSU analysis for more details and a new annotated graph.
>>> FEATURED STOCK ARTICLE : Recent Lows Define Important Near-Term Support While Consolidating - 9/25/2019 |
View all notes |
Set NEW NOTE alert |
Company Profile |
SEC
News |
Chart |
Request a new note
C
A
S
I |
Symbol/Exchange
Company Name
Industry Group |
PRICE |
CHANGE
(%Change) |
Day High |
Volume
(% DAV)
(% 50 day avg vol) |
52 Wk Hi
% From Hi |
Featured
Date |
Price
Featured |
Pivot Featured |
|
Max Buy |
|
|
|
THESE ARE NOT BUY RECOMMENDATIONS!
Comments contained in the body of this report are technical
opinions only. The material herein has been obtained
from sources believed to be reliable and accurate, however,
its accuracy and completeness cannot be guaranteed.
This site is not an investment advisor, hence it does
not endorse or recommend any securities or other investments.
Any recommendation contained in this report may not
be suitable for all investors and it is not to be deemed
an offer or solicitation on our part with respect to
the purchase or sale of any securities. All trademarks,
service marks and trade names appearing in this report
are the property of their respective owners, and are
likewise used for identification purposes only.
This report is a service available
only to active Paid Premium Members.
You may opt-out of receiving report notifications
at any time. Questions or comments may be submitted
by writing to Premium Membership Services 665 S.E. 10 Street, Suite 201 Deerfield Beach, FL 33441-5634 or by calling 1-800-965-8307
or 954-785-1121.
|
|
|