You are not logged in.
This means you
CAN ONLY VIEW reports that were published prior to Friday, February 23, 2024.
You
MUST UPGRADE YOUR MEMBERSHIP if you want to see any current reports.
AFTER MARKET UPDATE - WEDNESDAY, SEPTEMBER 25TH, 2019
Previous After Market Report Next After Market Report >>>
|
|
|
|
DOW |
+162.94 |
26,970.71 |
+0.61% |
|
Volume |
839,683,200 |
-12% |
|
Volume |
2,004,131,590 |
-13% |
|
NASDAQ |
+83.75 |
8,077.38 |
+1.05% |
|
Advancers |
1,800 |
65% |
|
Advancers |
1,815 |
59% |
|
S&P 500 |
+18.27 |
2,984.87 |
+0.62% |
|
Decliners |
985 |
35% |
|
Decliners |
1,269 |
41% |
|
Russell 2000 |
+17.07 |
1,550.65 |
+1.11% |
|
52 Wk Highs |
81 |
|
|
52 Wk Highs |
45 |
|
|
S&P 600 |
+12.70 |
962.76 |
+1.34% |
|
52 Wk Lows |
22 |
|
|
52 Wk Lows |
102 |
|
|
 |
Major Indices Posted Gains With Less Volume Conviction
Kenneth J. Gruneisen - Passed the CAN SLIM® Master's Exam
The S&P 500 snapped a three-day losing streak, rebounding 0.6%. The Dow climbed 162 points, while the Nasdaq Composite jumped 1.1%. The volume totals reported were lighter than the prior session on the NYSE and on the Nasdaq exchange, indicative of lackluster institutional buying demand. Advancers led decliners by a 3-2 margin on the Nasdaq exchange and by almost a 2-1 margin on the NYSE. There were 23 high-ranked companies from the Leaders List hit new 52-week highs and were listed on the BreakOuts Page, versus the total of 21 on the prior session. New 52-week highs totals outnumbered new 52-week lows totals on the NYSE, but new lows outnumbered new high on the Nasdaq exchange. The uptrend for the major indices (M criteria) has come under pressure while leadership has recently been waning. Disciplined investors know to make new buying efforts only in stocks fitting all of the key criteria of the fact-based investment system. The Featured Stocks Page provides the most timely analysis on high-ranked leaders. Charts used courtesy of www.stockcharts.com
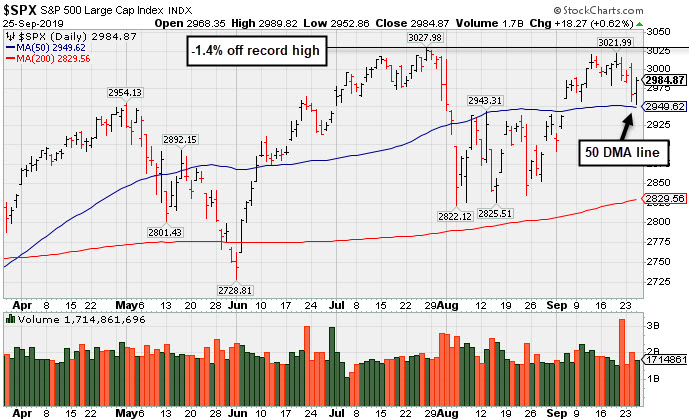
PICTURED: The S&P 500 Index posted a gain with lighter volume while consolidating above its 50-day moving average (DMA) line. It remains perched only 1.4% off its record high.
Stocks ended higher Wednesday on comments from President Trump that a U.S.-China trade deal could be finalized more quickly than expected. This followed his United Nations speech yesterday in which he was critical of China. The trade optimism overshadowed lingering political tensions surrounding the announcement on Tuesday of a formal impeachment inquiry of President Trump.
On the data front, new home sales rebounded 7.1% in August, firmly exceeding estimates and rebounding from the prior month’s 8.6% drop. Separately, mortgage applications fell 10.1% in the most recent week amid a rise in interest rates. Treasuries weakened along the curve, with the yield on the benchmark 10-year note up nine basis points to 1.73%. In commodities, WTI crude slid 1.4% to $56.49/barrel after an industry report showed U.S. crude stockpiles posted a surprise increase during the latest week. COMEX gold lost 1.8% to $1,504.40/ounce amid a stronger dollar.
Nine of 11 S&P 500 sectors finished in positive territory with Technology and Communication Services groups pacing the gains. Consumer Discretionary stocks also outperformed, with Nike (NKE +4.16%) hitting a new record high after delivering a top and bottom line beat, supported by a significant increase in online sales. In other earnings, uniform supplier Cintas (CTAS +5.74%) rose after raising its full-year guidance and topping analyst profit and revenue expectations. Elsewhere, Philip Morris (PM +5.20%) rose while Altria (MO -0.42%) edged lower on news that merger talks between the two tobacco giants have ceased.
|
 Kenneth J. Gruneisen started out as a licensed stockbroker in August 1987, a couple of months prior to the historic stock market crash that took the Dow Jones Industrial Average down -22.6% in a single day. He has published daily fact-based fundamental and technical analysis on high-ranked stocks online for two decades. Through FACTBASEDINVESTING.COM, Kenneth provides educational articles, news, market commentary, and other information regarding proven investment systems that work in good times and bad.
Comments contained in the body of this report are technical opinions only and are not necessarily those of Gruneisen Growth Corp. The material herein has been obtained from sources believed to be reliable and accurate, however, its accuracy and completeness cannot be guaranteed. Our firm, employees, and customers may effect transactions, including transactions contrary to any recommendation herein, or have positions in the securities mentioned herein or options with respect thereto. Any recommendation contained in this report may not be suitable for all investors and it is not to be deemed an offer or solicitation on our part with respect to the purchase or sale of any securities. |
|
 |
Tech, Retail, and Financial Groups Rose
Kenneth J. Gruneisen - Passed the CAN SLIM® Master's Exam
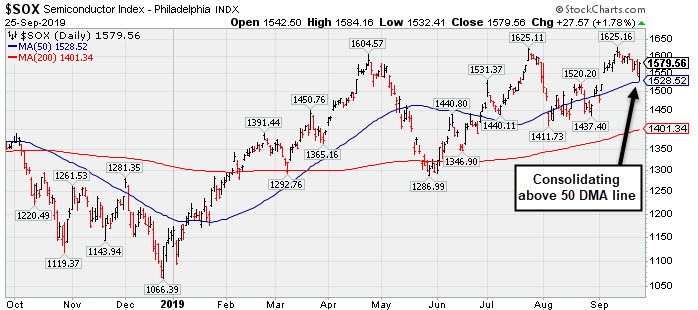
The Bank Index ($BKX +1.17%), Broker/Dealer Index ($XBD +0.643%), and the Retail Index ($RLX +0.94%) ended unanimously higher. The tech sector had a negative bias as the Semiconductor Index ($SOX +1.78%) and Networking Index ($NWX +1.46%) both posted solid gains, but the Biotech Index ($BTK -0.33%) finished the session with a small loss. The Gold & Silver Index ($XAU -3.21%) was a standout decliner while the Oil Services Index ($OSX -0.46%) edged lower and the Integrated Oil Index ($XOI +0.13%) inched higher.
PICTURED: The Semiconductor Index ($SOX +1.78%) is consolidating above its 50-day moving average (DMA) line.
| Oil Services |
$OSX |
68.46 |
-0.31 |
-0.45% |
-15.06% |
| Integrated Oil |
$XOI |
1,229.17 |
+1.54 |
+0.13% |
+6.05% |
| Semiconductor |
$SOX |
1,579.56 |
+27.57 |
+1.78% |
+36.74% |
| Networking |
$NWX |
562.25 |
+8.07 |
+1.46% |
+15.06% |
| Broker/Dealer |
$XBD |
269.75 |
+1.72 |
+0.64% |
+13.65% |
| Retail |
$RLX |
2,358.80 |
+21.93 |
+0.94% |
+20.88% |
| Gold & Silver |
$XAU |
94.54 |
-3.14 |
-3.21% |
+33.80% |
| Bank |
$BKX |
100.44 |
+1.17 |
+1.18% |
+17.08% |
| Biotech |
$BTK |
4,333.10 |
-14.50 |
-0.33% |
+2.66% |
|
|
|
 |
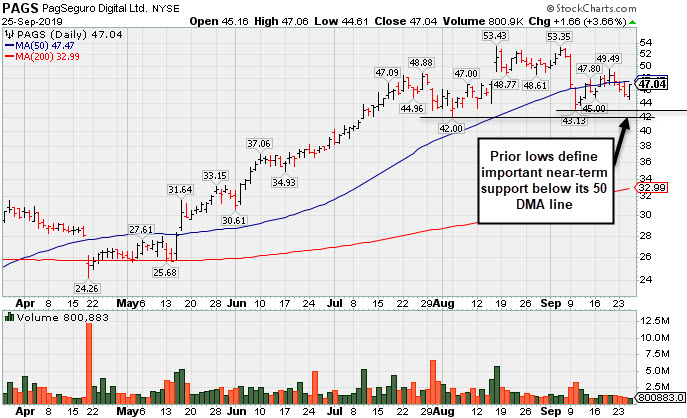
Recent Lows Define Important Near-Term Support While Consolidating
Kenneth J. Gruneisen - Passed the CAN SLIM® Master's Exam
Pagseguro Digital Cl A (PAGS +$1.66 or +3.66% to $47.04) posted a gain today with light volume. Recently it slumped back below its 50-day moving average (DMA) line ($47.47) which may act as resistance. A convincing rebound above the 50 DMA line would help its outlook, however, it faces some additional near-term resistance due to overhead supply up to the $53 level. Meanwhile, the prior lows in the $42-43 area define very important support where violations may trigger more worrisome technical sell signals.
Fundamentals are strong. Bullish action came with on 8/16/19 with a gap up after it reported earnings +35% on +39% sales revenues for the quarter ended June 30,2019 versus the year ago period. That showed a strong sales revenues increase while continuing its strong track record of quarterly comparisons with earnings increases above the +25% minimum guideline (C criteria).It has a 98 Earnings Per Share Rating. The limited history for this Brazil-based firm was noted as a concern. It completed its $21.50 IPO on 1/24/18.
PAGS traded up as much as +41.9% since first highlighted in yellow with pivot point cited based on its 3/29/18 high plus 10 cents in the 6/25/19 mid-day report (read here). It showed resilience after last shown in this FSU section on 9/11/19 with an annotated graph under the headline, "50-Day Moving Average Violation Triggered Technical Sell Signal".
The number of top-rated funds owning its shares rose from 254 in Sep '18 to 383 in Jun '19, a reassuring sign concerning the I criteria. Its current Up/Down Volume Ratio of 0.9 is an unbiased indication its shares have been under slight distributional pressure over the past 50 days. It has earned a Timeliness Rating of A and Sponsorship Rating of B.
|
|
|
Color Codes Explained :
Y - Better candidates highlighted by our
staff of experts.
G - Previously featured
in past reports as yellow but may no longer be buyable under the
guidelines.
***Last / Change / Volume data in this table is the closing quote data***
Symbol/Exchange
Company Name
Industry Group |
PRICE |
CHANGE
(%Change) |
Day High |
Volume
(% DAV)
(% 50 day avg vol) |
52 Wk Hi
% From Hi |
Featured
Date |
Price
Featured |
Pivot Featured |
|
Max Buy |
 MLR
-
NYSE
MLR
-
NYSE
Miller Industries Inc
AUTOMOTIVE - Auto Parts
|
$33.77
|
+0.06
0.18% |
$33.87
|
29,483
84.24% of 50 DAV
50 DAV is 35,000
|
$35.26
-4.23%
|
9/24/2019
|
$34.00
|
PP = $35.36
|
|
MB = $37.13
|
Most Recent Note - 9/24/2019 7:50:52 PM
Y - Suffered a loss with above average volume and finished near the session low. Highlighted in yellow with new pivot point cited based on its 3/05/19 high plus 10 cents in the earlier mid-day report while noted - "Subsequent gains above the pivot point backed by at least +40% above average volume may trigger a technical buy signal. Very little resistance remains due to overhead supply. Reported June '19 quarterly earnings +40% on +26% sales revenues versus the year ago period, and 3 of the past 4 comparisons were above the +25% minimum earnings guideline (C criteria)." See the latest FSU analysis for more details and a new annotated graph.
>>> FEATURED STOCK ARTICLE : Encountered Distributional Pressure After Challenging Prior High - 9/24/2019 |
View all notes |
Set NEW NOTE alert |
Company Profile |
SEC
News |
Chart |
Request a new note
C
A
S
I |
CCBG
-
NASDAQ
Capital City Bk Gp
BANKING - Regional - Mid-Atlantic Banks
|
$27.43
|
+0.57
2.12% |
$27.62
|
57,457
229.83% of 50 DAV
50 DAV is 25,000
|
$28.00
-2.04%
|
9/13/2019
|
$27.03
|
PP = $27.05
|
|
MB = $28.40
|
 Most Recent Note - 9/25/2019 12:01:43 PM
Y - Stalled after hitting a new 52-week high on 9/20/19 with a solid gain above the pivot point backed by +339% above average volume triggering a technical buy signal. Prior highs define initial support to watch above its 50 DMA line ($25.23).
>>> FEATURED STOCK ARTICLE : Thinly Traded Bank Rallied To Multi-Year Highs - 9/13/2019 |
View all notes |
Set NEW NOTE alert |
Company Profile |
SEC
News |
Chart |
Request a new note
C
A
S
I |
EPAM
-
NYSE
Epam Systems Inc
COMPUTER SOFTWARE and SERVICES - Information Technology Service
|
$183.83
|
+2.05
1.13% |
$184.56
|
150,996
42.18% of 50 DAV
50 DAV is 358,000
|
$201.00
-8.54%
|
5/9/2019
|
$169.25
|
PP = $180.55
|
|
MB = $189.58
|
Most Recent Note - 9/23/2019 5:42:06 PM
G - A rebound above its 50 DMA line ($189.64) is still needed for its outlook to improve. Prior lows in the $174-175 area define the next important support level. Reported earnings +27% on +24% sales revenues for the Jun '19 quarter.
>>> FEATURED STOCK ARTICLE : Recent Slump Below 50-Day Average Hurt Outlook - 9/16/2019 |
View all notes |
Set NEW NOTE alert |
Company Profile |
SEC
News |
Chart |
Request a new note
C
A
S
I |
AUDC
-
NASDAQ
Audiocodes Ltd
ELECTRONICS - Scientific and Technical Instrum
|
$20.69
|
-0.31
-1.48% |
$21.00
|
444,467
199.31% of 50 DAV
50 DAV is 223,000
|
$22.50
-8.04%
|
9/13/2019
|
$19.68
|
PP = $19.84
|
|
MB = $20.83
|
Most Recent Note - 9/25/2019 12:00:44 PM
Y - Color code is changed to yellow while pulling back below its "max buy" level today following a "negative reversal" on the prior session after hitting a new all-time high. Its prior high ($19.74 on 7/30/19) defines initial support to watch above its 50 DMA line ($18.27).
>>> FEATURED STOCK ARTICLE : Recent Spurt of Gains for New Highs Marked By Volume - 9/17/2019 |
View all notes |
Set NEW NOTE alert |
Company Profile |
SEC
News |
Chart |
Request a new note
C
A
S
I |
LHCG
-
NASDAQ
L H C Group Inc
HEALTH SERVICES - Home Health Care
|
$117.33
|
+1.19
1.02% |
$117.99
|
295,439
137.67% of 50 DAV
50 DAV is 214,600
|
$129.37
-9.31%
|
7/1/2019
|
$110.94
|
PP = $122.20
|
|
MB = $128.31
|
Most Recent Note - 9/23/2019 5:35:37 PM
G - A rebound above its 50 DMA line ($120.74) is needed to help its outlook, however it has recently acted as resistance. The recent low ($115.06 9/10/19) defines near-term support above its 200 DMA line ($111.94).
>>> FEATURED STOCK ARTICLE : 50-Day Moving Average Recently Acted as Resistance - 9/12/2019 |
View all notes |
Set NEW NOTE alert |
Company Profile |
SEC
News |
Chart |
Request a new note
C
A
S
I |
Symbol/Exchange
Company Name
Industry Group |
PRICE |
CHANGE
(%Change) |
Day High |
Volume
(% DAV)
(% 50 day avg vol) |
52 Wk Hi
% From Hi |
Featured
Date |
Price
Featured |
Pivot Featured |
|
Max Buy |
CHDN
-
NASDAQ
Churchill Downs Inc
LEISURE - Gaming Activities
|
$123.70
|
+1.84
1.51% |
$124.08
|
344,979
151.97% of 50 DAV
50 DAV is 227,000
|
$132.73
-6.80%
|
7/22/2019
|
$118.45
|
PP = $118.89
|
|
MB = $124.83
|
Most Recent Note - 9/25/2019 6:01:44 PM
Y - Posted a gain today with above average volume while sputtering near its 50 DMA line ($121). That important short-term average has acted as support in recent weeks during its consolidation. Prior lows define the next important support to watch. Jun '19 earnings +10% on +26% sales revenues versus the year ago period were below the +25% minimum earnings guideline (C criteria), noted recently raising fundamental concerns.
>>> FEATURED STOCK ARTICLE : Consolidating Above 50-Day Moving Average Line - 9/20/2019 |
View all notes |
Set NEW NOTE alert |
Company Profile |
SEC
News |
Chart |
Request a new note
C
A
S
I |
LULU
-
NASDAQ
Lululemon Athletica
MANUFACTURING - Textile Manufacturing
|
$193.02
|
-0.83
-0.43% |
$195.10
|
1,335,005
76.03% of 50 DAV
50 DAV is 1,756,000
|
$204.44
-5.59%
|
9/6/2019
|
$201.25
|
PP = $194.35
|
|
MB = $204.07
|
Most Recent Note - 9/23/2019 12:27:27 PM
Y - Rebounding today after a loss with above average volume on the prior session undercut the prior high ($194.25). Its 50 DMA line ($186.83) defines important near-term support to watch.
>>> FEATURED STOCK ARTICLE : Consolidating Near Prior High Following Latest Breakout - 9/18/2019 |
View all notes |
Set NEW NOTE alert |
Company Profile |
SEC
News |
Chart |
Request a new note
C
A
S
I |
CPRT
-
NASDAQ
Copart Inc
SPECIALTY RETAIL - Auto Dealerships
|
$81.04
|
-0.65
-0.80% |
$82.02
|
1,051,026
77.91% of 50 DAV
50 DAV is 1,349,000
|
$83.70
-3.18%
|
9/5/2019
|
$79.13
|
PP = $79.84
|
|
MB = $83.83
|
Most Recent Note - 9/23/2019 5:40:08 PM
Y - Remains perched near its all-time high. Held its ground stubbornly after the big volume-driven gain above the pivot point on 9/05/19 clinched a technical buy signal. Fundamentals are strong. See the latest FSU analysis for more details and an annotated graph.
>>> FEATURED STOCK ARTICLE : Hovering Near All-Time High Following Recent Breakout - 9/19/2019 |
View all notes |
Set NEW NOTE alert |
Company Profile |
SEC
News |
Chart |
Request a new note
C
A
S
I |
BLD
-
NYSE
Topbuild Corp
Bldg-Constr Prds/Misc
|
$97.43
|
+1.47
1.53% |
$97.66
|
186,425
63.84% of 50 DAV
50 DAV is 292,000
|
$97.55
-0.12%
|
5/17/2019
|
$82.19
|
PP = $87.31
|
|
MB = $91.68
|
Most Recent Note - 9/23/2019 5:34:17 PM
G - Perched near its all-time high, extended from the prior base. Earnings rose +39% on +9% sales revenues for the Jun '19 quarter versus the year ago period. Its 50 DMA line ($88.71) defines important support to watch along with its prior low ($86.53 on 8/28/19). See the latest FSU analysis for more details and a new annotated graph.
>>> FEATURED STOCK ARTICLE : Perched Near Record High, Extended From Prior Base - 9/23/2019 |
View all notes |
Set NEW NOTE alert |
Company Profile |
SEC
News |
Chart |
Request a new note
C
A
S
I |
PAGS
-
NYSE
Pagseguro Digital Cl A
Finance-CrdtCard/PmtPr
|
$47.04
|
+1.66
3.66% |
$47.06
|
795,862
39.38% of 50 DAV
50 DAV is 2,021,000
|
$53.43
-11.96%
|
6/25/2019
|
$37.69
|
PP = $40.07
|
|
MB = $42.07
|
Most Recent Note - 9/25/2019 5:58:58 PM
G - Gain today was backed by light volume as it rebounded near its 50 DMA line ($47.47) which may act as resistance. Prior lows in the $42-43 area define the next important chart support level to watch. Fundamentals are strong. See the latest FSU analysis for more details and a new annotated graph.
>>> FEATURED STOCK ARTICLE : Recent Lows Define Important Near-Term Support While Consolidating - 9/25/2019 |
View all notes |
Set NEW NOTE alert |
Company Profile |
SEC
News |
Chart |
Request a new note
C
A
S
I |
Symbol/Exchange
Company Name
Industry Group |
PRICE |
CHANGE
(%Change) |
Day High |
Volume
(% DAV)
(% 50 day avg vol) |
52 Wk Hi
% From Hi |
Featured
Date |
Price
Featured |
Pivot Featured |
|
Max Buy |
|
|
|
THESE ARE NOT BUY RECOMMENDATIONS!
Comments contained in the body of this report are technical
opinions only. The material herein has been obtained
from sources believed to be reliable and accurate, however,
its accuracy and completeness cannot be guaranteed.
This site is not an investment advisor, hence it does
not endorse or recommend any securities or other investments.
Any recommendation contained in this report may not
be suitable for all investors and it is not to be deemed
an offer or solicitation on our part with respect to
the purchase or sale of any securities. All trademarks,
service marks and trade names appearing in this report
are the property of their respective owners, and are
likewise used for identification purposes only.
This report is a service available
only to active Paid Premium Members.
You may opt-out of receiving report notifications
at any time. Questions or comments may be submitted
by writing to Premium Membership Services 665 S.E. 10 Street, Suite 201 Deerfield Beach, FL 33441-5634 or by calling 1-800-965-8307
or 954-785-1121.
|
|
|