You are not logged in.
This means you
CAN ONLY VIEW reports that were published prior to Sunday, February 25, 2024.
You
MUST UPGRADE YOUR MEMBERSHIP if you want to see any current reports.
AFTER MARKET UPDATE - THURSDAY, SEPTEMBER 24TH, 2020
Previous After Market Report Next After Market Report >>>
|
|
|
|
DOW |
+52.31 |
26,815.44 |
+0.20% |
|
Volume |
927,745,324 |
-7% |
|
Volume |
4,049,981,800 |
-0% |
|
NASDAQ |
+39.28 |
10,672.27 |
+0.37% |
|
Advancers |
1,439 |
49% |
|
Advancers |
1,386 |
42% |
|
S&P 500 |
+9.67 |
3,246.59 |
+0.30% |
|
Decliners |
1,513 |
51% |
|
Decliners |
1,903 |
58% |
|
Russell 2000 |
+0.36 |
1,451.82 |
+0.02% |
|
52 Wk Highs |
9 |
|
|
52 Wk Highs |
13 |
|
|
S&P 600 |
+4.17 |
826.80 |
+0.51% |
|
52 Wk Lows |
72 |
|
|
52 Wk Lows |
132 |
|
|
The major indices have shown worrisome action indicative of a market correction and leadership has been very thin. Weakness in stocks prompts disciplined investors on a case-by-case basis to reduce market exposure and raise cash.
|
 |
Market Internals Were Not Encouraging While Indices Pared Losses
Kenneth J. Gruneisen - Passed the CAN SLIM® Master's Exam
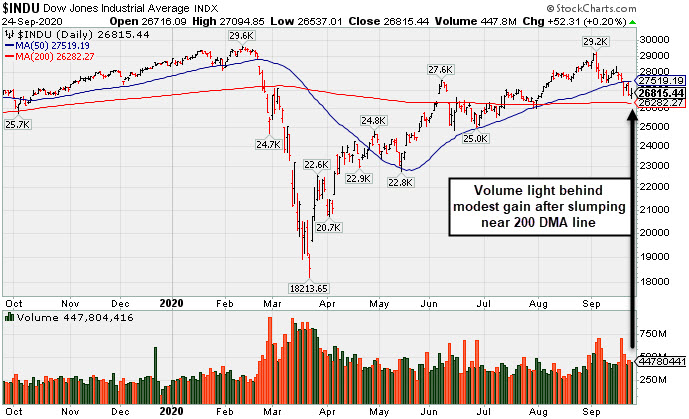
The S&P 500 climbed 0.3%, but remains 9.3% below its September 2 all-time high. The Dow pared a more than 300 point advance to finish 52 points higher, while the Nasdaq Composite rose 0.4%. Still, all three major averages are set for their first monthly decline since March. The reported volume totals were lighter than the prior session totals on the NYSE and on the Nasdaq exchange, revealing lackluster institutional buying demand. Decliners led advancers by almost a 3-2 margin on the Nasdaq exchange and by a narrower margin on the NYSE. There were 2 high-ranked companies from the Leaders List that hit new 52-week highs and were listed on the BreakOuts Page, versus the total of 12 on the prior session. New 52-week lows totals expanded and outnumbered shrinking new highs totals on the NYSE and on the Nasdaq exchange. The major indices have been showing action indicative of a market correction (M criteria). In weak markets it is considered critical to reduce exposure and sell faltering stocks on a case-by-case basis.
PICTURED: The Dow Jones Industrial Average posted a modest gain after slumping near its 200-day moving average (DMA) line.
Stocks finished higher during a volatile trading session on Wall Street, as investors weighed a confluence of factors. Risk sentiment was supported by news Treasury Secretary Steven Mnuchin and Democratic House Leader Nancy Pelosi were open to fresh fiscal stimulus talks. However, stocks came off the best levels of the day as a roughly $1 trillion gap remained between the latest Democratic proposal and the amount President Trump recently indicated. Economic data was also in focus. Initial jobless claims came in at 870,000 in the week ending September 19, higher than expected and above the prior upwardly revised 866,000 figure. Meanwhile, a separate release revealed new home sales unexpectedly increased 4.8% last month to the highest level since 2006. Treasuries advanced modestly, with the yield on the 10-year note down one basis point to 0.66%.
In FOREX trading, a gauge of the U.S. dollar declined for the first time in four sessions, but remains up more than 1.5% this week. The recent strength in the greenback has provided a headwind to most other assets, particularly COMEX gold, which is off nearly 5% week-to-date. Ten of 11 S&P 500 sectors ended in positive territory, with the Health Care group the lone laggard. |
 Kenneth J. Gruneisen started out as a licensed stockbroker in August 1987, a couple of months prior to the historic stock market crash that took the Dow Jones Industrial Average down -22.6% in a single day. He has published daily fact-based fundamental and technical analysis on high-ranked stocks online for two decades. Through FACTBASEDINVESTING.COM, Kenneth provides educational articles, news, market commentary, and other information regarding proven investment systems that work in good times and bad.
Comments contained in the body of this report are technical opinions only and are not necessarily those of Gruneisen Growth Corp. The material herein has been obtained from sources believed to be reliable and accurate, however, its accuracy and completeness cannot be guaranteed. Our firm, employees, and customers may effect transactions, including transactions contrary to any recommendation herein, or have positions in the securities mentioned herein or options with respect thereto. Any recommendation contained in this report may not be suitable for all investors and it is not to be deemed an offer or solicitation on our part with respect to the purchase or sale of any securities. |
|
 |
Gold & Silver Index Led Retail, Financial, and Semiconductors Higher
Kenneth J. Gruneisen - Passed the CAN SLIM® Master's Exam
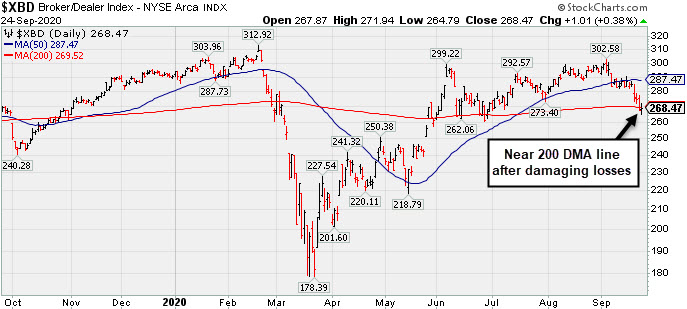
The Retail Index ($RLX +0.26%) and financial indexes posted modest gains as the Broker/Dealer Index ($XBD +0.38%) and Bank Index ($BKX +0.30%) each edged higher. The Semiconductor Index ($SOX +0.97%) led the tech sector while the Networking Index ($NWX -0.56%) and the Biotech Index ($BTK -0.35%) both wedged lower. The Gold & Silver Index ($XAU +3.78%) posted a standout gain. The Oil Services Index ($OSX -2.98%) suffered a big loss while the Integrated Oil Index ($XOI +0.40%) eked out a modest gain.
PICTURED: The Broker/Dealer Index ($XBD +0.38%) is near its 200-day moving average (DMA) line after damaging losses.
| Oil Services |
$OSX |
28.64 |
-0.88 |
-2.98% |
-63.42% |
| Integrated Oil |
$XOI |
614.66 |
+2.46 |
+0.40% |
-51.62% |
| Semiconductor |
$SOX |
2,147.42 |
+20.73 |
+0.97% |
+16.10% |
| Networking |
$NWX |
516.42 |
-2.90 |
-0.56% |
-11.48% |
| Broker/Dealer |
$XBD |
268.47 |
+1.01 |
+0.38% |
-7.55% |
| Retail |
$RLX |
3,268.66 |
+8.57 |
+0.26% |
+33.45% |
| Gold & Silver |
$XAU |
140.88 |
+5.13 |
+3.78% |
+31.76% |
| Bank |
$BKX |
70.08 |
+0.21 |
+0.30% |
-38.18% |
| Biotech |
$BTK |
5,199.12 |
-18.15 |
-0.35% |
+2.60% |
|
|
|
 |
Showed Resilience When Testing 50-Day Moving Average Line Again
Kenneth J. Gruneisen - Passed the CAN SLIM® Master's Exam
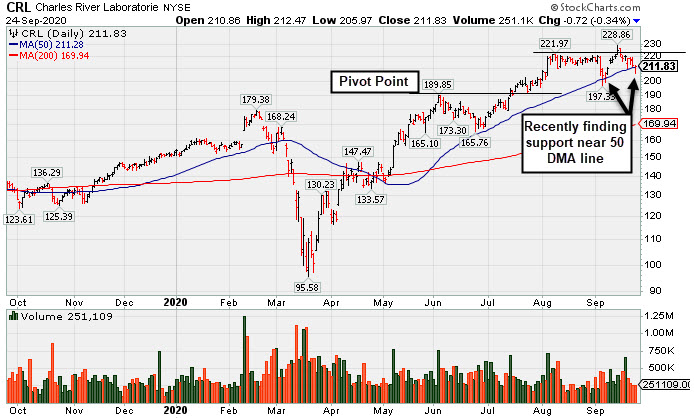
Charles River Labs Intl (CRL -$0.72 or -0.34% to $211.83) pulled back for a 4th consecutive loss today with below average volume, however, it showed resilience and finished near the session high and above its 50-day moving average (DMA) line after a deeper loss earlier in the session. More damaging losses would raise greater concerns and trigger a technical sell signal.
It recently cleared prior highs in the $221 area but promptly slumped back into the prior base. Subsequent gains into new high territory would help its outlook improve. However, it recently raised fundamental concerns when it reported Jun '20 quarterly earnings -3% on +4% sales revenues, below the +25% minimum guideline (C criteria), but the results were better than expected and the company also raised its guidance. It now has a 92 Earnings Per Share Rating, down from 96 prior to the report. The 2 prior quarterly earnings increases were above the +25% minimum guideline (C criteria) of the fact-based investment system. Annual earnings (A criteria) history has been strong and steady.
CRL traded up as much as +18.8% since it was highlighted in yellow with pivot point cited based on its 6/03/20 high plus 10 cents in the 7/15/20 mid-day report (read here). It was last shown in this FSU section on 9/11/20 with an annotated graph under the headline, "Found Prompt Support at 50-Day Moving Average Line".
It hails from the Medical - Research Equipment/Services industry group which has an 73 Group Relative Strength Rating (L criteria). The number of top-rated funds owning its shares rose from 681 in Dec '19 to 753 in Jun '20, and its Up/Down Volume Ratio is 1.1 is an unbiased indication its shares have been under slight accumulation over the past 50 days. There is a small number of only 49.7 million shares (S criteria) outstanding, which can contribute to greater price volatility in the event of institutional buying or selling.
|
|
|
Color Codes Explained :
Y - Better candidates highlighted by our
staff of experts.
G - Previously featured
in past reports as yellow but may no longer be buyable under the
guidelines.
***Last / Change / Volume data in this table is the closing quote data***
Symbol/Exchange
Company Name
Industry Group |
PRICE |
CHANGE
(%Change) |
Day High |
Volume
(% DAV)
(% 50 day avg vol) |
52 Wk Hi
% From Hi |
Featured
Date |
Price
Featured |
Pivot Featured |
|
Max Buy |
 ADBE
-
NASDAQ
ADBE
-
NASDAQ
Adobe Inc
COMPUTER SOFTWARE and SERVICES - Application Software
|
$467.67
|
-2.72
-0.58% |
$471.43
|
2,837,768
93.01% of 50 DAV
50 DAV is 3,051,000
|
$536.88
-12.89%
|
9/10/2020
|
$488.46
|
PP = $536.88
|
|
MB = $563.72
|
Most Recent Note - 9/23/2020 5:36:36 PM
G - Fell back toward its 50 DMA line ($466) with today's loss on below average volume. Disciplined investors always limit losses by selling any stock that falls more than 7-8% from their purchase price. Reported Aug '20 quarterly earnings +25% on +14% sales revenues versus the year ago period. See the latest FSU analysis for more details and a new annotated graph.
>>> FEATURED STOCK ARTICLE : Light Volume Loss Falling Near 50-Day Moving Average Line Again - 9/23/2020 |
View all notes |
Set NEW NOTE alert |
Company Profile |
SEC
News |
Chart |
Request a new note
C
A
S
I |
CRL
-
NYSE
Charles River Labs Intl
DRUGS - Biotechnology
|
$211.83
|
-0.72
-0.34% |
$212.47
|
251,109
75.41% of 50 DAV
50 DAV is 333,000
|
$228.86
-7.44%
|
7/15/2020
|
$192.66
|
PP = $189.95
|
|
MB = $199.45
|
 Most Recent Note - 9/24/2020 6:56:14 PM
G - Pulled back for a 4th consecutive loss today with below average volume but showed resilience after undercutting its 50 DMA line ($211.28) which recently acted as support. More damaging losses would raise greater concerns and trigger a technical sell signal. Raised fundamental concerns when it recently reported Jun '20 quarterly earnings -3% on +4% sales revenues, below the +25% minimum guideline (C criteria). See the latest FSU analysis for more details and a new annotated graph.
>>> FEATURED STOCK ARTICLE : Showed Resilience When Testing 50-Day Moving Average Line Again - 9/24/2020 |
View all notes |
Set NEW NOTE alert |
Company Profile |
SEC
News |
Chart |
Request a new note
C
A
S
I |
AMD
-
NASDAQ
Advanced Micro Devices
ELECTRONICS - Semiconductor - Broad Line
|
$75.82
|
+1.09
1.46% |
$77.25
|
57,444,206
88.09% of 50 DAV
50 DAV is 65,208,000
|
$94.28
-19.58%
|
8/31/2020
|
$90.42
|
PP = $87.39
|
|
MB = $91.76
|
Most Recent Note - 9/23/2020 5:47:50 PM
G - Slumped below its 50 DMA line ($77.38) with today's loss on lighter volume. More damaging losses below the recent low ($73.85 on 9/18/20) would raise greater concerns and trigger a more worrisome technical sell signal. Faces near-term resistance due to overhead supply up to the $94 level. Fundamentals remain strong.
>>> FEATURED STOCK ARTICLE : Found Support Above 50 DMA Line After Negating Recent Breakout - 9/15/2020 |
View all notes |
Set NEW NOTE alert |
Company Profile |
SEC
News |
Chart |
Request a new note
C
A
S
I |
TREX
-
NYSE
Trex Company Inc
MATERIALS and CONSTRUCTION - General Building Materials
|
$68.02
|
+0.98
1.46% |
$69.37
|
624,524
59.20% of 50 DAV
50 DAV is 1,055,000
|
$78.32
-13.15%
|
6/26/2020
|
$54.53
|
PP = $66.47
|
|
MB = $69.79
|
Most Recent Note - 9/23/2020 5:52:26 PM
G - Reversed into the red after earlier gains today and closed near the session low. A rebound above its 50 DMA line ($70.18) is needed for its outlook to improve. More damaging losses would raise greater concerns. Do not be confused by the 2:1 share split effective 9/15/20 (Featured Price, Pivot Point, and Max Buy prices have been adjusted accordingly). Fundamentals remain strong.
>>> FEATURED STOCK ARTICLE : Slumped Below 50-Day Average With Loss on Light Volume - 9/17/2020 |
View all notes |
Set NEW NOTE alert |
Company Profile |
SEC
News |
Chart |
Request a new note
C
A
S
I |
NFLX
-
NASDAQ
Netflix Inc
SPECIALTY RETAIL - Music and Video Stores
|
$473.08
|
+2.47
0.52% |
$477.00
|
3,703,924
52.82% of 50 DAV
50 DAV is 7,013,000
|
$575.37
-17.78%
|
9/1/2020
|
$547.45
|
PP = $575.47
|
|
MB = $604.24
|
Most Recent Note - 9/23/2020 5:43:42 PM
G - Met resistance when rebounding toward its 50 DMA line ($497) and slumped again with light volume behind today's loss. The recent low ($458.60 on 9/18/20) defines important near term support where any further deterioration would raise more serious concerns. Subsequent gains back above the 50 DMA line are needed for its outlook to improve.
>>> FEATURED STOCK ARTICLE : Met Resistance at 50 DMA Line and Reversed Today - 9/16/2020 |
View all notes |
Set NEW NOTE alert |
Company Profile |
SEC
News |
Chart |
Request a new note
C
A
S
I |
Symbol/Exchange
Company Name
Industry Group |
PRICE |
CHANGE
(%Change) |
Day High |
Volume
(% DAV)
(% 50 day avg vol) |
52 Wk Hi
% From Hi |
Featured
Date |
Price
Featured |
Pivot Featured |
|
Max Buy |
LGIH
-
NASDAQ
L G I Homes Inc
Bldg-Resident/Comml
|
$110.20
|
+4.90
4.65% |
$110.51
|
260,729
86.33% of 50 DAV
50 DAV is 302,000
|
$123.94
-11.09%
|
7/7/2020
|
$99.19
|
PP = $95.82
|
|
MB = $100.61
|
Most Recent Note - 9/24/2020 6:39:32 PM
G - Rebounded toward its 50 DMA line ($112.92) which may act as resistance, and subsequent gains above the 50 DMA line are needed for its outlook to improve. More damaging losses below the latest low ($101.30 on 9/21/20) would raise greater concerns and trigger a worrisome technical sell signal. Reported Jun '20 quarterly earnings +21% on +4% sales revenues, breaking a streak of 4 comparisons above the +25% minimum guideline (C criteria).
>>> FEATURED STOCK ARTICLE : Violation of 50-Day Average on Volume Triggered Technical Sell Signal - 9/18/2020 |
View all notes |
Set NEW NOTE alert |
Company Profile |
SEC
News |
Chart |
Request a new note
C
A
S
I |
NOW
-
NYSE
Servicenow Inc
Computer Sftwr-Enterprse
|
$460.12
|
-0.35
-0.08% |
$465.17
|
842,535
50.60% of 50 DAV
50 DAV is 1,665,000
|
$501.82
-8.31%
|
8/20/2020
|
$453.34
|
PP = $454.79
|
|
MB = $477.53
|
Most Recent Note - 9/23/2020 5:45:07 PM
Y - Volume totals have been cooling while still showing resilience and finding support above its 50 DMA line ($448). Fundamentals remain strong. More damaging losses below the 50 DMA line and prior low ($432.85 on 9/08/20) may raise concerns and trigger a technical sell signal.
>>> FEATURED STOCK ARTICLE : Tested Support at 50-Day Moving Average Line - 9/14/2020 |
View all notes |
Set NEW NOTE alert |
Company Profile |
SEC
News |
Chart |
Request a new note
C
A
S
I |
|
|
|
THESE ARE NOT BUY RECOMMENDATIONS!
Comments contained in the body of this report are technical
opinions only. The material herein has been obtained
from sources believed to be reliable and accurate, however,
its accuracy and completeness cannot be guaranteed.
This site is not an investment advisor, hence it does
not endorse or recommend any securities or other investments.
Any recommendation contained in this report may not
be suitable for all investors and it is not to be deemed
an offer or solicitation on our part with respect to
the purchase or sale of any securities. All trademarks,
service marks and trade names appearing in this report
are the property of their respective owners, and are
likewise used for identification purposes only.
This report is a service available
only to active Paid Premium Members.
You may opt-out of receiving report notifications
at any time. Questions or comments may be submitted
by writing to Premium Membership Services 665 S.E. 10 Street, Suite 201 Deerfield Beach, FL 33441-5634 or by calling 1-800-965-8307
or 954-785-1121.
|
|
|