***Last / Change / Volume data in this table is the closing quote data***
Symbol/Exchange
Company Name
Industry Group |
PRICE |
CHANGE
(%Change) |
Day High |
Volume
(% DAV)
(% 50 day avg vol) |
52 Wk Hi
% From Hi |
Featured
Date |
Price
Featured |
Pivot Featured |
|
Max Buy |
OSBC
-
NASDAQ
Old Second Bancorp Inc
BANKING - Regional - Midwest Banks
|
$15.50
|
-0.05
-0.32% |
$15.75
|
141,711
170.74% of 50 DAV
50 DAV is 83,000
|
$16.30
-4.91%
|
9/24/2018
|
$15.38
|
PP = $16.40
|
|
MB = $17.22
|
 Most Recent Note - 9/24/2018 12:33:59 PM
Y - Color code is changed to yellow and a new pivot point is cited based on its 7/26/18 high plus 10 cents while building a new base, consolidating above its 50 DMA line ($15.29). Prior lows and its 200 DMA line define additional near-term support. Its Relative Strength Rating is 78, below the 80+ minimum guideline for buy candidates. Met stubborn resistance after hitting a new high on 7/26/18 with a big volume-driven gain. Fundamentals remain strong.
>>> FEATURED STOCK ARTICLE : Bank Perched Less Than -5% Off Record High - 8/23/2018 |
View all notes |
Set NEW NOTE alert |
Company Profile |
SEC
News |
Chart |
Request a new note
C
A
S
I |
SIVB
-
NASDAQ
S V B Financial Group
BANKING - Regional - Pacific Banks
|
$320.83
|
-3.26
-1.01% |
$324.91
|
267,629
65.28% of 50 DAV
50 DAV is 410,000
|
$333.74
-3.87%
|
8/6/2018
|
$314.77
|
PP = $329.75
|
|
MB = $346.24
|
Most Recent Note - 9/20/2018 5:20:06 PM
Y - Posted a solid gain today, rising from its 50 DMA line ($317.92) and challenging prior highs. Subsequent gains above the pivot point backed by at least +40% above average volume may trigger a convincing new technical buy signal.
>>> FEATURED STOCK ARTICLE : Bank Posted Quiet Gain for a Best-Ever Close - 8/27/2018 |
View all notes |
Set NEW NOTE alert |
Company Profile |
SEC
News |
Chart |
Request a new note
C
A
S
I |
ZBRA
-
NASDAQ
Zebra Tech Corp Cl A
COMPUTER HARDWARE - Computer Peripherals
|
$174.15
|
-1.05
-0.60% |
$175.87
|
207,771
55.70% of 50 DAV
50 DAV is 373,000
|
$179.47
-2.96%
|
8/7/2018
|
$164.26
|
PP = $161.82
|
|
MB = $169.91
|
Most Recent Note - 9/24/2018 5:11:07 PM
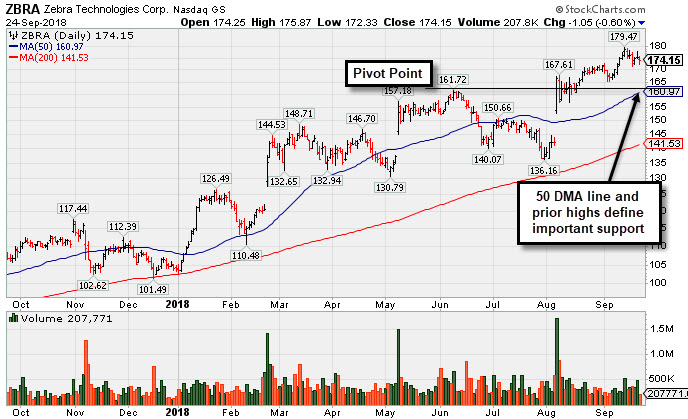
G - Hovering near its all-time high. Prior high in the $161 area defines support coinciding with its 50 DMA line. Fundamentals remain strong. See the latest FSU analysis for more details and an annotated graph.
>>> FEATURED STOCK ARTICLE : Hovering Near All-Time High With Strong Fundamentals - 9/24/2018 |
View all notes |
Set NEW NOTE alert |
Company Profile |
SEC
News |
Chart |
Request a new note
C
A
S
I |
EPAM
-
NYSE
Epam Systems Inc
COMPUTER SOFTWARE and SERVICES - Information Technology Service
|
$136.72
|
-1.40
-1.01% |
$138.55
|
301,354
68.18% of 50 DAV
50 DAV is 442,000
|
$144.19
-5.18%
|
7/5/2018
|
$123.70
|
PP = $131.85
|
|
MB = $138.44
|
Most Recent Note - 9/21/2018 1:03:00 PM
G - Holding its ground near its "max buy" level. Volume totals have been cooling in recent weeks after a bout of distributional pressure. Prior highs in the $137 area define near term support along with its 50 DMA line ($135.50). Fundamentals remain strong.
>>> FEATURED STOCK ARTICLE : Tech Services Firm Remains Fundamentally and Technically Strong - 8/20/2018 |
View all notes |
Set NEW NOTE alert |
Company Profile |
SEC
News |
Chart |
Request a new note
C
A
S
I |
IRBT
-
NASDAQ
Irobot Corp
CONSUMER DURABLES - Electronic Equipment
|
$104.12
|
+0.01
0.01% |
$105.40
|
706,445
71.50% of 50 DAV
50 DAV is 988,000
|
$118.75
-12.32%
|
8/29/2018
|
$112.07
|
PP = $109.88
|
|
MB = $115.37
|
Most Recent Note - 9/20/2018 5:16:36 PM
Y - Suffered a big loss today on higher (near average) volume as it slumped back below its pivot point and finished near the session low. Prior low ($99.73 on 9/07/18) defines important near-term support to watch. Very little resistance remains due to overhead supply.
>>> FEATURED STOCK ARTICLE : Household Appliance Maker Rallied From Choppy Base - 8/29/2018 |
View all notes |
Set NEW NOTE alert |
Company Profile |
SEC
News |
Chart |
Request a new note
C
A
S
I |
Symbol/Exchange
Company Name
Industry Group |
PRICE |
CHANGE
(%Change) |
Day High |
Volume
(% DAV)
(% 50 day avg vol) |
52 Wk Hi
% From Hi |
Featured
Date |
Price
Featured |
Pivot Featured |
|
Max Buy |
TSC
-
NASDAQ
TriState Capital Hld Inc
CONSUMER NON-DURABLES - Personal Products
|
$27.95
|
-0.50
-1.76% |
$28.35
|
107,217
60.92% of 50 DAV
50 DAV is 176,000
|
$30.10
-7.14%
|
9/11/2018
|
$29.75
|
PP = $30.20
|
|
MB = $31.71
|
Most Recent Note - 9/24/2018 4:23:05 PM
G - Failing to rebound after recently violating its 50 DMA line. A rebound above the 50 DMA line ($29.03) is needed for its outlook to improve.
>>> FEATURED STOCK ARTICLE : TriState Bank Perched Near All-Time High - 9/11/2018 |
View all notes |
Set NEW NOTE alert |
Company Profile |
SEC
News |
Chart |
Request a new note
C
A
S
I |
FLT
-
NYSE
Fleetcor Technologies
DIVERSIFIED SERVICES - Business/Management Services
|
$222.00
|
-0.28
-0.13% |
$222.78
|
425,486
75.44% of 50 DAV
50 DAV is 564,000
|
$227.15
-2.27%
|
9/12/2018
|
$221.01
|
PP = $226.02
|
|
MB = $237.32
|
Most Recent Note - 9/20/2018 5:13:46 PM
Y - Finished perched only -1.7% off its record high. Volume totals have been cooling in recent weeks while consolidating above its 50 DMA line ($217.81). New pivot point cited was based on its 7/25/18 high plus 10 cents. Subsequent volume-driven gains above the pivot point may trigger a new (or add-on) technical buy signal. The prior low ($210.64 on 8/03/18) defines important near-term support above its 200 DMA line ($202). Fundamentals remain strong. See the latest FSU analysis for more details and a new annotated graph.
>>> FEATURED STOCK ARTICLE : Perched Within Close Striking Distance of New Pivot Point - 9/20/2018 |
View all notes |
Set NEW NOTE alert |
Company Profile |
SEC
News |
Chart |
Request a new note
C
A
S
I |
MA
-
NYSE
Mastercard Inc Cl A
Finance-CrdtCard/PmtPr
|
$221.35
|
-0.55
-0.25% |
$222.14
|
2,509,006
78.43% of 50 DAV
50 DAV is 3,199,000
|
$223.37
-0.90%
|
7/11/2018
|
$203.84
|
PP = $204.10
|
|
MB = $214.31
|
Most Recent Note - 9/18/2018 3:22:21 PM
G - Color code is changed to green while rising above its "max buy" level and quietly hitting another new all-time high with today's gain on light volume. Its 50 DMA line ($207.55) defines support above the prior lows in the $193-196 area. Fundamentals remain strong.
>>> FEATURED STOCK ARTICLE : Found Support Near 50-Day Moving Average Line - 8/10/2018 |
View all notes |
Set NEW NOTE alert |
Company Profile |
SEC
News |
Chart |
Request a new note
C
A
S
I |
V
-
NYSE
Visa Inc Cl A
Finance-CrdtCard/PmtPr
|
$149.11
|
-0.94
-0.63% |
$149.65
|
6,671,531
91.49% of 50 DAV
50 DAV is 7,292,000
|
$150.26
-0.77%
|
4/26/2018
|
$126.68
|
PP = $126.98
|
|
MB = $133.33
|
Most Recent Note - 9/24/2018 4:24:15 PM
G - Perched near its all-time high, very extended from any sound base. Its 50 DMA line ($142.77) and recent low ($135.31 on 7/30/18) define important near-term support to watch on pullbacks. Fundamentals remain strong.
>>> FEATURED STOCK ARTICLE : Visa Near Record but Endured Distributional Pressure - 9/13/2018 |
View all notes |
Set NEW NOTE alert |
Company Profile |
SEC
News |
Chart |
Request a new note
C
A
S
I |
NANO
-
NASDAQ
Nanometrics Inc
ELECTRONICS - Scientific and Technical Instrum
|
$36.30
|
+0.45
1.26% |
$36.38
|
235,332
55.50% of 50 DAV
50 DAV is 424,000
|
$48.26
-24.78%
|
8/13/2018
|
$44.17
|
PP = $44.27
|
|
MB = $46.48
|
Most Recent Note - 9/24/2018 4:29:26 PM
G - Slumped well below its 50 DMA line ($40) with recent volume-driven losses raising concerns. Prior low ($34.72 on 6/28/18) defines important near-term support above its 200 DMA line. A rebound above the 50 DMA line is needed for its outlook to improve. Fundamentals remain strong.
>>> FEATURED STOCK ARTICLE : Five Times Average Volume Behind Breakout Gain - 8/13/2018 |
View all notes |
Set NEW NOTE alert |
Company Profile |
SEC
News |
Chart |
Request a new note
C
A
S
I |
Symbol/Exchange
Company Name
Industry Group |
PRICE |
CHANGE
(%Change) |
Day High |
Volume
(% DAV)
(% 50 day avg vol) |
52 Wk Hi
% From Hi |
Featured
Date |
Price
Featured |
Pivot Featured |
|
Max Buy |
ENV
-
NYSE
Envestnet Inc
FINANCIAL SERVICES - Diversified Investments
|
$60.80
|
-0.60
-0.98% |
$61.35
|
260,632
96.64% of 50 DAV
50 DAV is 269,700
|
$64.80
-6.17%
|
6/15/2018
|
$57.85
|
PP = $60.37
|
|
MB = $63.39
|
Most Recent Note - 9/21/2018 7:22:22 PM
Y - It found support recently near its 50 DMA line ($60.85). Still perched near its all-time high, stubbornly holding its ground. in recent weeks. Fundamentals remain strong. See the latest FSU analysis for more details and a new annotated graph.
>>> FEATURED STOCK ARTICLE : Found Recent Support at 50-Day Moving Average - 9/21/2018 |
View all notes |
Set NEW NOTE alert |
Company Profile |
SEC
News |
Chart |
Request a new note
C
A
S
I |
TPL
-
NYSE
Texas Pacific Land Trust
Real Estate Dvlpmt/Ops
|
$834.68
|
-5.36
-0.64% |
$845.08
|
5,731
47.76% of 50 DAV
50 DAV is 12,000
|
$874.00
-4.50%
|
9/14/2018
|
$820.45
|
PP = $874.10
|
|
MB = $917.81
|
Most Recent Note - 9/24/2018 4:21:38 PM
Y - Holding its ground in a tight range. New pivot point cited was based on its 8/27/18 high plus 10 cents. Subsequent volume-driven gains above the pivot point may trigger a new (or add-on) technical buy signal. The 50 DMA line ($806) defines important near-term support to watch on pullbacks.
>>> FEATURED STOCK ARTICLE : Best Ever Close After a Solid Gain on Higher Volume - 9/4/2018 |
View all notes |
Set NEW NOTE alert |
Company Profile |
SEC
News |
Chart |
Request a new note
C
A
S
I |
FIZZ
-
NASDAQ
National Beverage Corp
FOOD and BEVERAGE - Beverages - Soft Drinks
|
$112.30
|
-1.14
-1.00% |
$114.54
|
156,204
82.52% of 50 DAV
50 DAV is 189,300
|
$127.32
-11.80%
|
9/6/2018
|
$125.92
|
PP = $129.92
|
|
MB = $136.42
|
Most Recent Note - 9/18/2018 3:17:36 PM
Y - Met resistance near its old high and it has been slumping near its 50 DMA line ($112). Subsequent gains above the pivot point for a a new high (N criteria) backed by at least +40% above average volume may trigger a proper technical buy signal. Fundamentals through Jun '18 have been strong.
>>> FEATURED STOCK ARTICLE : Strong Beverage Firm Challenges Prior High - 9/6/2018 |
View all notes |
Set NEW NOTE alert |
Company Profile |
SEC
News |
Chart |
Request a new note
C
A
S
I |
ODFL
-
NASDAQ
Old Dominion Fght Line
TRANSPORTATION - Trucking
|
$158.14
|
+1.37
0.87% |
$158.27
|
806,051
131.92% of 50 DAV
50 DAV is 611,000
|
$170.22
-7.10%
|
9/6/2018
|
$163.11
|
PP = $164.20
|
|
MB = $172.41
|
Most Recent Note - 9/21/2018 1:05:14 PM
Y - Enduring distributional pressure this week, undercutting prior highs in the $164 area. Raised concerns while completely negating the recent technical breakout and slumping back into the prior base.
>>> FEATURED STOCK ARTICLE : Trucking Firm Perched at All-Time High - 9/7/2018 |
View all notes |
Set NEW NOTE alert |
Company Profile |
SEC
News |
Chart |
Request a new note
C
A
S
I |
DPZ
-
NYSE
Dominos Pizza Inc
Retail-Restaurants
|
$288.99
|
+2.77
0.97% |
$290.00
|
586,302
99.71% of 50 DAV
50 DAV is 588,000
|
$305.34
-5.35%
|
8/13/2018
|
$288.60
|
PP = $293.91
|
|
MB = $308.61
|
Most Recent Note - 9/21/2018 2:53:06 PM
Y - Rebound above the 50 DMA line ($283) has helped its outlook to improve. Remains below the previously cited pivot point, and it has not formed a sound new base.
>>> FEATURED STOCK ARTICLE : Pulling Back After Wedging Gains for Highs Lacked Great Volume - 9/5/2018 |
View all notes |
Set NEW NOTE alert |
Company Profile |
SEC
News |
Chart |
Request a new note
C
A
S
I |
Symbol/Exchange
Company Name
Industry Group |
PRICE |
CHANGE
(%Change) |
Day High |
Volume
(% DAV)
(% 50 day avg vol) |
52 Wk Hi
% From Hi |
Featured
Date |
Price
Featured |
Pivot Featured |
|
Max Buy |
FIVE
-
NASDAQ
Five Below Inc
Retail-DiscountandVariety
|
$125.40
|
+0.15
0.12% |
$128.83
|
927,611
96.03% of 50 DAV
50 DAV is 966,000
|
$136.13
-7.88%
|
7/6/2018
|
$98.90
|
PP = $104.09
|
|
MB = $109.29
|
Most Recent Note - 9/19/2018 5:37:43 PM
G - Pulling back after getting very extended from any sound base. Earnings rose +40% on +23% sales revenues for the Jul '18 quarter, continuing its strong earnings track record. Its 50 DMA line ($110.51) and prior high ($109.09 on 7/19/18) define important near-term support to watch.
>>> FEATURED STOCK ARTICLE : Volume Totals Cooling While Perched Near Record High - 8/16/2018 |
View all notes |
Set NEW NOTE alert |
Company Profile |
SEC
News |
Chart |
Request a new note
C
A
S
I |
NOW
-
NYSE
Servicenow Inc
Computer Sftwr-Enterprse
|
$193.12
|
+3.43
1.81% |
$194.07
|
2,048,221
109.01% of 50 DAV
50 DAV is 1,879,000
|
$206.30
-6.39%
|
8/24/2018
|
$193.83
|
PP = $194.91
|
|
MB = $204.66
|
Most Recent Note - 9/19/2018 12:37:56 PM
G - Violated its 50 DMA line ($189.45) with today's 4th consecutive loss backed by above average volume triggering a technical sell signal and its color code is changed to green. Only a prompt rebound above the 50 DMA line would help its outlook improve. Recent low ($174.35 on 7/31/18) defines important near-term support above its 200 DMA line. Fundamentals remain strong.
>>> FEATURED STOCK ARTICLE : Slump Below 50-Day Average Line Raises Concerns - 8/17/2018 |
View all notes |
Set NEW NOTE alert |
Company Profile |
SEC
News |
Chart |
Request a new note
C
A
S
I |
NVEE
-
NASDAQ
N V 5 Global Inc
Comml Svcs-Consulting
|
$89.20
|
-0.55
-0.61% |
$90.65
|
65,164
81.46% of 50 DAV
50 DAV is 80,000
|
$92.75
-3.83%
|
6/15/2018
|
$7,070.00
|
PP = $72.00
|
|
MB = $75.60
|
Most Recent Note - 9/18/2018 3:26:22 PM
G - Volume totals have been cooling while stubbornly holding its ground perched near its all-time high. Completed a new Public Offering on 8/09/18. Its 50 DMA line ($82.67) defines near-term support to watch on pullbacks.
>>> FEATURED STOCK ARTICLE : Remains Perched Near All-Time High Following Offering - 8/21/2018 |
View all notes |
Set NEW NOTE alert |
Company Profile |
SEC
News |
Chart |
Request a new note
C
A
S
I |
PANW
-
NYSE
Palo Alto Networks
Computer Sftwr-Security
|
$230.66
|
+1.14
0.50% |
$232.21
|
1,190,547
100.13% of 50 DAV
50 DAV is 1,189,000
|
$239.50
-3.69%
|
6/12/2018
|
$206.55
|
PP = $214.69
|
|
MB = $225.42
|
Most Recent Note - 9/19/2018 5:41:08 PM
G - Pulling back from its all-time high with losses on lighter than average volume. Extended from any sound base. Its 50 DMA line ($218.11) and prior high ($219.38 on 7/13/18) define important near term support to watch. Reported +39% earnings on +29% sales revenues for the Jul '18 quarter, continuing its strong earnings track record.
>>> FEATURED STOCK ARTICLE : Perched Near All-Time High With Volume Totals Cooling - 9/17/2018 |
View all notes |
Set NEW NOTE alert |
Company Profile |
SEC
News |
Chart |
Request a new note
C
A
S
I |
QLYS
-
NASDAQ
Qualys Inc
Computer Sftwr-Security
|
$87.70
|
+0.90
1.04% |
$88.37
|
280,562
82.28% of 50 DAV
50 DAV is 341,000
|
$98.30
-10.78%
|
8/31/2018
|
$91.05
|
PP = $98.40
|
|
MB = $103.32
|
Most Recent Note - 9/19/2018 5:43:31 PM
G - Undercut its 50 DMA line ($90.38) raising concerns and its color code is changed to green. The recent low ($82.91 on 8/15/18) defines the next important near term support to watch. A rebound above the 50 DMA line is needed for its outlook to improve. Subsequent volume-driven gains above the pivot point are needed to trigger a technical buy signal.
>>> FEATURED STOCK ARTICLE : Cloud Security Firm Faces Some Near Term Resistance - 9/3/2018 |
View all notes |
Set NEW NOTE alert |
Company Profile |
SEC
News |
Chart |
Request a new note
C
A
S
I |
Symbol/Exchange
Company Name
Industry Group |
PRICE |
CHANGE
(%Change) |
Day High |
Volume
(% DAV)
(% 50 day avg vol) |
52 Wk Hi
% From Hi |
Featured
Date |
Price
Featured |
Pivot Featured |
|
Max Buy |
ANET
-
NYSE
"Arista Networks, Inc"
TELECOMMUNICATIONS - Communication Equipment
|
$274.21
|
+4.92
1.83% |
$275.23
|
705,553
61.20% of 50 DAV
50 DAV is 1,152,900
|
$313.37
-12.50%
|
8/24/2018
|
$308.26
|
PP = $311.77
|
|
MB = $327.36
|
Most Recent Note - 9/24/2018 4:27:19 PM
G - Today's gain on light volume helped it close just above its 50 DMA line ($273.93) helping its outlook to improve. Found support at its 200 DMA line ($264). More damaging losses would raise serious concerns. Its Relative Strength Rating has slumped to 76. Faces near-term resistance due to overhead supply up to the $313 level.
>>> FEATURED STOCK ARTICLE : Considerable Gap Up Gain With Heavy Volume - 8/24/2018 |
View all notes |
Set NEW NOTE alert |
Company Profile |
SEC
News |
Chart |
Request a new note
C
A
S
I |
PAYC
-
NYSE
Paycom Software Inc
COMPUTER SOFTWARE and SERVICES - Application Software
|
$154.97
|
+1.32
0.86% |
$156.11
|
498,954
64.30% of 50 DAV
50 DAV is 776,000
|
$164.08
-5.55%
|
8/1/2018
|
$122.87
|
PP = $118.55
|
|
MB = $124.48
|
Most Recent Note - 9/18/2018 5:53:08 PM
G - Perched near its all-time high, very extended from any sound base. Fundamentals remain strong. See the latest FSU analysis for more details and a new annotated graph.
>>> FEATURED STOCK ARTICLE : Very Extended From Base After Impressive Rally - 9/18/2018 |
View all notes |
Set NEW NOTE alert |
Company Profile |
SEC
News |
Chart |
Request a new note
C
A
S
I |
GRUB
-
NYSE
Grubhub Inc
INTERNET - Content
|
$134.81
|
-0.94
-0.69% |
$137.19
|
1,501,989
104.89% of 50 DAV
50 DAV is 1,432,000
|
$149.35
-9.73%
|
8/24/2018
|
$138.44
|
PP = $141.16
|
|
MB = $148.22
|
Most Recent Note - 9/19/2018 5:35:11 PM
Y - Pulled back today with heavier volume indicative of distributional pressure. Recent gains lacked great volume conviction. Gains above the pivot point backed by at least +40% above average volume are needed to trigger a proper new (or add-on) technical buy signal. See the latest FSU analysis for more details and a new annotated graph.
>>> FEATURED STOCK ARTICLE : Wedged Higher Then Fell Below Pivot Point With Heavier Volume - 9/19/2018 |
View all notes |
Set NEW NOTE alert |
Company Profile |
SEC
News |
Chart |
Request a new note
C
A
S
I |
HQY
-
NASDAQ
Healthequity Inc
COMPUTER SOFTWARE and SERVICES - Healthcare Information Service
|
$92.29
|
-0.17
-0.18% |
$93.21
|
488,671
70.92% of 50 DAV
50 DAV is 689,000
|
$99.99
-7.70%
|
8/13/2018
|
$82.39
|
PP = $83.44
|
|
MB = $87.61
|
Most Recent Note - 9/24/2018 4:07:06 PM
G - Extended from any sound base, consolidating above its 50 DMA line ($86.86) and prior highs in the $82-83 area defining additional near-term support to watch.
>>> FEATURED STOCK ARTICLE : Very Extended From Any Sound Base After Streak of Gains - 9/10/2018 |
View all notes |
Set NEW NOTE alert |
Company Profile |
SEC
News |
Chart |
Request a new note
C
A
S
I |
PYPL
-
NASDAQ
Paypal Holdings Inc
Finance-CrdtCard/PmtPr
|
$89.62
|
-1.00
-1.10% |
$90.26
|
8,037,753
104.06% of 50 DAV
50 DAV is 7,724,000
|
$93.70
-4.35%
|
7/23/2018
|
$89.24
|
PP = $87.55
|
|
MB = $91.93
|
Most Recent Note - 9/24/2018 4:03:49 PM
Y - Consolidating near its 50 DMA line ($88.35), while the next important support is at prior lows in the $80-81 area.
>>> FEATURED STOCK ARTICLE : Consolidating Above 50-Day Moving Average Near High - 9/12/2018 |
View all notes |
Set NEW NOTE alert |
Company Profile |
SEC
News |
Chart |
Request a new note
C
A
S
I |
Symbol/Exchange
Company Name
Industry Group |
PRICE |
CHANGE
(%Change) |
Day High |
Volume
(% DAV)
(% 50 day avg vol) |
52 Wk Hi
% From Hi |
Featured
Date |
Price
Featured |
Pivot Featured |
|
Max Buy |
OLLI
-
NASDAQ
Ollie's Bargain Outlet
Retail-DiscountandVariety
|
$93.40
|
+0.65
0.70% |
$94.15
|
387,476
62.60% of 50 DAV
50 DAV is 619,000
|
$94.70
-1.37%
|
7/12/2018
|
$74.43
|
PP = $77.60
|
|
MB = $81.48
|
Most Recent Note - 9/21/2018 1:05:49 PM
G - Perched at its all-time high, extended from any sound base. Prior highs in the $77 area define support along with its 50 DMA line ($79.38). Reported earnings +48% on +13% sales revenues for the Jul '18 quarter, continuing its strong earnings track record.
>>> FEATURED STOCK ARTICLE : Hitting New Highs With More Volume-Driven Gains - 8/22/2018 |
View all notes |
Set NEW NOTE alert |
Company Profile |
SEC
News |
Chart |
Request a new note
C
A
S
I |
NOVT
-
NASDAQ
Novanta Inc
Elec-Scientific/Msrng
|
$70.05
|
-0.55
-0.78% |
$71.15
|
307,826
147.99% of 50 DAV
50 DAV is 208,000
|
$78.85
-11.16%
|
7/12/2018
|
$65.90
|
PP = $68.10
|
|
MB = $71.51
|
Most Recent Note - 9/24/2018 4:01:31 PM
G - Slumped below its 50 DMA line ($71.11) raising concerns with a streak of volume-driven losses. Prior highs in the $68-69 area defining important near-term support to watch.
>>> FEATURED STOCK ARTICLE : Electronic Systems Leader is Extended From Prior Base - 8/30/2018 |
View all notes |
Set NEW NOTE alert |
Company Profile |
SEC
News |
Chart |
Request a new note
C
A
S
I |
TEAM
-
NASDAQ
Atlassian Corp Plc Cl A
Comp Sftwr-Spec Enterprs
|
$92.47
|
+1.78
1.96% |
$93.16
|
1,362,073
96.94% of 50 DAV
50 DAV is 1,405,000
|
$95.00
-2.66%
|
7/27/2018
|
$73.73
|
PP = $68.85
|
|
MB = $72.29
|
Most Recent Note - 9/24/2018 3:59:51 PM
G - Posting a gain and rallying near its all-time high today with average volume. Extended from any sound base. The 50 DMA line ($80.48) defines near-term support to watch on pullbacks. Fundamentals through Jun '18 have been strong.
>>> FEATURED STOCK ARTICLE : Extended From Base and Hitting Another New High - 9/14/2018 |
View all notes |
Set NEW NOTE alert |
Company Profile |
SEC
News |
Chart |
Request a new note
C
A
S
I |
SEND
-
NYSE
Sendgrid Inc
INTERNET - Content
|
$35.43
|
-0.05
-0.14% |
$36.24
|
772,960
82.23% of 50 DAV
50 DAV is 940,000
|
$38.66
-8.35%
|
8/13/2018
|
$32.20
|
PP = $32.13
|
|
MB = $33.74
|
Most Recent Note - 9/21/2018 2:54:48 PM
G - Reversed into the red today after early gains challenging its all-time high. Extended from any sound base, and prior highs in the $32 area define initial support to watch above its 50 DMA line ($31.95).
>>> FEATURED STOCK ARTICLE : Strength Returned After Finding Support Near Prior Lows - 8/14/2018 |
View all notes |
Set NEW NOTE alert |
Company Profile |
SEC
News |
Chart |
Request a new note
C
A
S
I |