You are not logged in.
This means you
CAN ONLY VIEW reports that were published prior to Tuesday, February 20, 2024.
You
MUST UPGRADE YOUR MEMBERSHIP if you want to see any current reports.
AFTER MARKET UPDATE - FRIDAY, SEPTEMBER 23RD, 2022
Previous After Market Report Next After Market Report >>>
|
|
|
|
DOW |
-486.27 |
29,590.41 |
-1.62% |
|
Volume |
1,110,583,279 |
+21% |
|
Volume |
5,114,783,400 |
+5% |
|
NASDAQ |
-198.88 |
10,867.93 |
-1.80% |
|
Advancers |
374 |
12% |
|
Advancers |
929 |
24% |
|
S&P 500 |
-64.76 |
3,693.23 |
-1.72% |
|
Decliners |
2,666 |
88% |
|
Decliners |
2,907 |
76% |
|
Russell 2000 |
-42.72 |
1,679.59 |
-2.48% |
|
52 Wk Highs |
8 |
|
|
52 Wk Highs |
23 |
|
|
S&P 600 |
-24.67 |
1,080.92 |
-2.23% |
|
52 Wk Lows |
1,106 |
|
|
52 Wk Lows |
1,240 |
|
|
The market (M criteria) is in a correction. A caution flag has been raised by the technical damage in the major indices coupled with a shrinking list of stocks hitting new highs. Disciplined investors know to raise cash by selling weakening stocks on a case-by-case basis, and to protect that cash by avoiding any new buys until a new rally is confirmed with a follow-through day.
|
 |
Correction Brings More Damage to Major Market Indices
Kenneth J. Gruneisen - Passed the CAN SLIM® Master's Exam
The Dow lost 486 points to finish at its lowest level since November 2020 and end the week 4% lower. The Nasdaq Composite slid 1.8%, while the S&P 500 shed 1.7%, ending near its mid-June low. The Nasdaq Composite and S&P 500 notched weekly declines of 5.1% and 4.7%, respectively. The volume totals reported were higher than the prior session on the NYSE and on the Nasdaq exchange, indicative of an increase in institutional selling pressure termed "distribution". Breadth was negative as decliners led advancers by more than a 7-1 margin on the NYSE and more than 3-1 on the Nasdaq exchange. There were zero high-ranked companies from the Leaders List that hit new 52-week highs and were listed on the BreakOuts Page, versus the total of 4 on the prior session. New 52-week lows totals swelled again and solidly outnumbered shrinking new 52-week highs on both the NYSE and the Nasdaq exchange. The market is now in a correction (M criteria).
Chart courtesy of www.stockcharts.com%20on%20Tuesday.%20Yesterday,%20the%20broad%20benchmark%20eclipsed%20the%204,300%20level%20for%20the%20first%20time%20since%20late%20April.%20The%20Nasdaq%20Composite%20fell%201.3%%20amid%20weakness%20in%20mega-cap%20tech%20shares.%20The%20volume%20totals%20reported%20were%20mixed,%20lighter%20than%20the%20prior%20session%20on%20the%20NYSE%20and%20higher%20on%20the%20Nasdaq%20exchange.%20Decliners%20led%20advancers%20by%20a%204-1%20margin%20on%20the%20NYSE%20ad%20by%20a%203-1%20margin%20on%20the%20Nasdaq%20exchange.%20There%20were%2017%20high-ranked%20companies%20from%20the%20Leaders%20List%20that%20hit%20new%2052-week%20highs%20and%20were%20listed%20on%20the%20BreakOuts%20Page,%20down%20from%20the%20total%20of%2045%20on%20the%20prior%20session.%20New%2052-week%20highs%20outnumbered%20new%2052-week%20lows%20on%20the%20NYSE,%20but%20new%20lows%20outnumbered%20new%20highs%20on%20the%20Nasdaq%20exchange.%20The%20market%20is%20in%20a%20confirmed%20uptrend%20(M%20criteria).%20Any%20sustainable%20rally%20requires%20a%20healthy%20crop%20of%20leading%20stocks%20hitting%20new%20highs,%20so%20the%20recent%20improvement%20in%20leadership%20was%20a%20reassuring%20sign.) 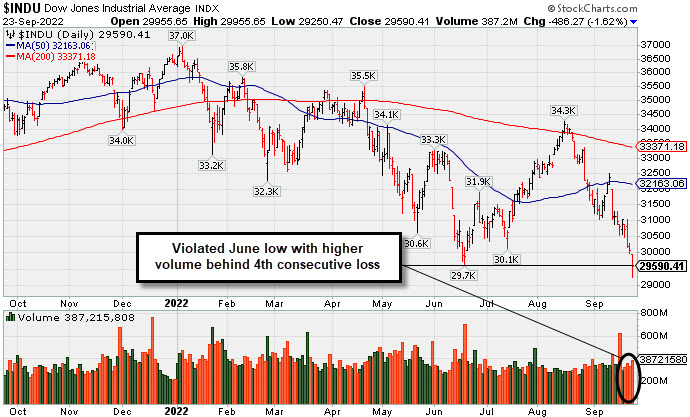 PICTURED: The Dow Jones Industrial Average had higher volume behind a 4th consecutive loss as it violated the June low.
U.S. equities finished lower Friday as investors assessed the likelihood of the Federal Reserve’s (Fed) hawkish monetary policy tipping the economy into a recession. A perceived risk-off mood pervaded during the session, and the Cboe Volatility Index, known as Wall Street’s “fear gauge”, climbed over 30 to its highest level since June 21. All sectors in the S&P 500 finished the week in negative territory, with Energy leading losses.
Shorter-dated Treasury yields continued their ascent, with the more policy-sensitive 2-year note climbing seven basis points (0.07%) to 4.19% to hover near its highest level since 2007. Meanwhile, the yield on the benchmark 10-year note slipped two basis points (0.02%) to 3.68%, while the 30-year bond yield dipped three basis points (0.03%) to 3.61% A gauge of the U.S. dollar advanced 1.5% to hit a fresh 20-year high against a basket of currencies. Meanwhile, West Texas Intermediate (WTI) crude slid 5.3% to $79.03/barrel amid recessionary worries and a climbing U.S. dollar. WTI crude notched its worst day since early January and a fourth-straight week of declines.
On the data front, September flash Purchasing Managers’ Index (PMI) readings showed contraction in manufacturing and services activity eased in September, while the composite PMI came in at its highest reading in three months.
|
 Kenneth J. Gruneisen started out as a licensed stockbroker in August 1987, a couple of months prior to the historic stock market crash that took the Dow Jones Industrial Average down -22.6% in a single day. He has published daily fact-based fundamental and technical analysis on high-ranked stocks online for two decades. Through FACTBASEDINVESTING.COM, Kenneth provides educational articles, news, market commentary, and other information regarding proven investment systems that work in good times and bad.
Comments contained in the body of this report are technical opinions only and are not necessarily those of Gruneisen Growth Corp. The material herein has been obtained from sources believed to be reliable and accurate, however, its accuracy and completeness cannot be guaranteed. Our firm, employees, and customers may effect transactions, including transactions contrary to any recommendation herein, or have positions in the securities mentioned herein or options with respect thereto. Any recommendation contained in this report may not be suitable for all investors and it is not to be deemed an offer or solicitation on our part with respect to the purchase or sale of any securities. |
|
 |
Commodity-Linked Groups Led Widespread Losses
Kenneth J. Gruneisen - Passed the CAN SLIM® Master's Exam
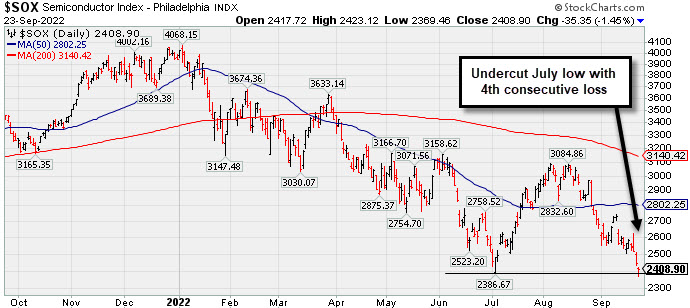
Commodity-linked groups were standout decliners on Friday as the Oil Services Index ($OSX -8.33%), Integrated Oil Index ($XOI -7.25%), and the Gold & Silver Index ($XAU -5.27%) each suffered a considerable loss. Losses for the Broker/Dealer Index ($XBD -2.58%), Bank Index ($BKX -1.97%), and Retail Index ($RLX -1.67%) all created a drag on the major averages. The Networking Index ($NWX -2.76%) led the tech sector lower while the Semiconductor Index ($SOX -1.45%) and Biotech Index ($BTK -1.39%) both slumped by more than -1%.
PICTURED: The Semiconductor Index ($SOX -1.45%) undercut its July low with Friday's 4th consecutive loss.
| Oil Services |
$OSX |
57.65 |
-5.24 |
-8.33% |
+9.36% |
| Integrated Oil |
$XOI |
1,453.59 |
-113.70 |
-7.25% |
+23.37% |
| Semiconductor |
$SOX |
2,408.89 |
-35.35 |
-1.45% |
-38.96% |
| Networking |
$NWX |
721.65 |
-20.50 |
-2.76% |
-25.69% |
| Broker/Dealer |
$XBD |
419.03 |
-11.12 |
-2.58% |
-13.93% |
| Retail |
$RLX |
2,978.66 |
-50.67 |
-1.67% |
-29.52% |
| Gold & Silver |
$XAU |
93.81 |
-5.22 |
-5.27% |
-29.17% |
| Bank |
$BKX |
98.89 |
-1.98 |
-1.97% |
-25.21% |
| Biotech |
$BTK |
4,476.70 |
-63.24 |
-1.39% |
-18.88% |
|
|
|
 |
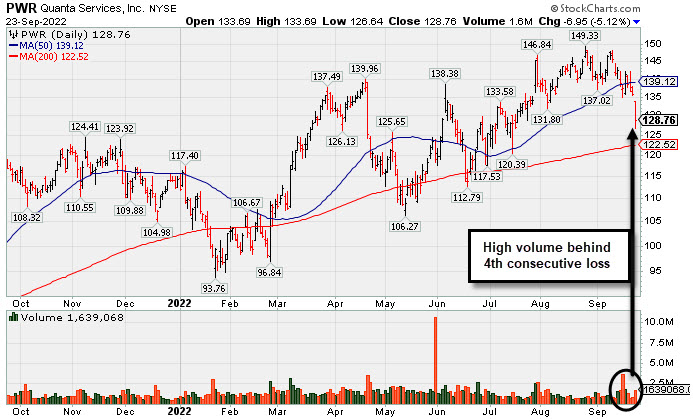
Volume Higher Behind 4th Consecutive Damaging Loss
Kenneth J. Gruneisen - Passed the CAN SLIM® Master's Exam
Quanta Services Inc (PWR-$6.95 or -5.12% to $128.76) slumped further below its 50-day moving average (DMA) line higher volume behind today's 4th consecutive loss. A rebound back above the 50 DMA line ($139) is needed for its outlook to improve. It will be dropped from the Featured Stocks list tonight.
It has a 98 Earnings Per Share Rating. Fundamentals remain strong as Jun '22 quarterly earnings rose +45% on +41% sales revenues versus the year ago period, its 4th quarterly comparison above the +25% minimum earnings guideline (C criteria). Annual earnings (A criteria) growth has been strong and steady.
The company hails from the Building - Heavy Construction industry group which is currently ranked 97th on the 197 Industry Groups list with a Group Relative Strength Rating of 51 (C+). The number of top-rated funds owning its shares rose from 1,202 in Sep '21 to 1,530 in Jun '22, a reassuring sign concerning the I criteria. It has 143.7 million shares outstanding (S criteria).
|
|
|
Color Codes Explained :
Y - Better candidates highlighted by our
staff of experts.
G - Previously featured
in past reports as yellow but may no longer be buyable under the
guidelines.
***Last / Change / Volume data in this table is the closing quote data***
Symbol/Exchange
Company Name
Industry Group |
PRICE |
CHANGE
(%Change) |
Day High |
Volume
(% DAV)
(% 50 day avg vol) |
52 Wk Hi
% From Hi |
Featured
Date |
Price
Featured |
Pivot Featured |
|
Max Buy |
 CI
-
NYSE
CI
-
NYSE
Cigna Corp
Medical-Managed Care
|
$277.77
|
-5.13
-1.81% |
$280.89
|
1,856,176
96.73% of 50 DAV
50 DAV is 1,919,000
|
$296.29
-6.25%
|
7/7/2022
|
$276.55
|
PP = $273.68
|
|
MB = $287.36
|
Most Recent Note - 9/21/2022 2:46:19 PM
G - Found support above its 50 DMA line ($282) while consolidating near its all-time high in recent weeks. Reported earnings for the Jun '22 quarter rose +19% on +5% sales revenues versus the year ago period, breaking a streak of 3 quarterly earnings increases above the +25% minimum guideline (C criteria), raising fundamental concerns.
>>> FEATURED STOCK ARTICLE : Found Support Above 50-Day Moving Average Line This Week - 9/16/2022 |
View all notes |
Set NEW NOTE alert |
Company Profile |
SEC
News |
Chart |
Request a new note
C
A
S
I |
ESQ
-
NASDAQ
Esquire Financial Hldgs
Finance-Commercial Loans
|
$38.70
|
+0.16
0.42% |
$38.92
|
37,832
145.51% of 50 DAV
50 DAV is 26,000
|
$41.68
-7.15%
|
7/26/2022
|
$37.74
|
PP = $39.19
|
|
MB = $41.15
|
 Most Recent Note - 9/23/2022 5:55:18 PM
Y - Still finding support above its 50 DMA line ($37.69). Gains back above the pivot point were a reassuring sign of fresh institutional buying. The market is in a correction (M criteria) and disciplined investors know to avoid new buying efforts until a new rally confirmed with a follow-through day.
>>> FEATURED STOCK ARTICLE : Thinly-Traded Esquire Still Perched Near High - 9/20/2022 |
View all notes |
Set NEW NOTE alert |
Company Profile |
SEC
News |
Chart |
Request a new note
C
A
S
I |
CSL
-
NYSE
Carlisle Cos Inc
Diversified Operations
|
$273.41
|
-5.53
-1.98% |
$275.67
|
516,767
101.53% of 50 DAV
50 DAV is 509,000
|
$318.71
-14.21%
|
7/28/2022
|
$282.31
|
PP = $275.23
|
|
MB = $288.99
|
Most Recent Note - 9/23/2022 6:02:00 PM
Today's 4th consecutive loss added to recent damage, violating prior highs in the $275 area. It will be dropped from the Featured Stocks list tonight. A rebound above the 50 DMA line is needed for its outlook to improve.
>>> FEATURED STOCK ARTICLE : Consolidating Near High Well Above 50-Day Moving Average - 9/14/2022 |
View all notes |
Set NEW NOTE alert |
Company Profile |
SEC
News |
Chart |
Request a new note
C
A
S
I |
ENPH
-
NASDAQ
Enphase Energy Inc
Energy-Solar
|
$279.49
|
-4.14
-1.46% |
$281.50
|
3,932,458
105.80% of 50 DAV
50 DAV is 3,717,000
|
$324.84
-13.96%
|
7/28/2022
|
$276.66
|
PP = $282.55
|
|
MB = $296.68
|
Most Recent Note - 9/22/2022 12:25:10 PM
Y - Color code is changed to yellow while pulling back below its "max buy" level for a 4th consecutive loss. Its 50 DMA line ($279.69) and recent lows in the $271-272 area define important near-term support. Fundamentals remain strong. The market is in a correction (M criteria) and disciplined investors know to avoid new buying efforts until a new rally confirmed with a follow-through day.
>>> FEATURED STOCK ARTICLE : High-Ranked Solar Energy Firm Hovering Near All-Time High - 9/13/2022 |
View all notes |
Set NEW NOTE alert |
Company Profile |
SEC
News |
Chart |
Request a new note
C
A
S
I |
PWR
-
NYSE
Quanta Services Inc
MATERIALS and CONSTRUCTION - General Contractors
|
$128.76
|
-6.95
-5.12% |
$133.69
|
1,632,273
147.85% of 50 DAV
50 DAV is 1,104,000
|
$149.33
-13.77%
|
7/28/2022
|
$141.83
|
PP = $140.14
|
|
MB = $147.15
|
Most Recent Note - 9/23/2022 5:48:22 PM
Slumped further below its 50 DMA line higher volume behind today's 4th consecutive loss. A rebound back above the 50 DMA line ($139) is needed for its outlook to improve. It will be dropped from the Featured Stocks list tonight. See the latest FSU analysis for more details and an annotated graph.
>>> FEATURED STOCK ARTICLE : Volume Higher Behind 4th Consecutive Damaging Loss - 9/23/2022 |
View all notes |
Set NEW NOTE alert |
Company Profile |
SEC
News |
Chart |
Request a new note
C
A
S
I |
Symbol/Exchange
Company Name
Industry Group |
PRICE |
CHANGE
(%Change) |
Day High |
Volume
(% DAV)
(% 50 day avg vol) |
52 Wk Hi
% From Hi |
Featured
Date |
Price
Featured |
Pivot Featured |
|
Max Buy |
GFF
-
NYSE
Griffon Corporation
MATERIALS and CONSTRUCTION - General Building Materials
|
$28.86
|
-0.79
-2.66% |
$29.74
|
360,799
95.20% of 50 DAV
50 DAV is 379,000
|
$34.92
-17.35%
|
8/8/2022
|
$32.46
|
PP = $31.12
|
|
MB = $32.68
|
Most Recent Note - 9/23/2022 5:59:42 PM
Violated its 50 DMA line ($31) and prior low in the $30 area during a streak of 4 consecutive losses triggering technical sell signals. Only a prompt rebound above the 50 DMA line would help its outlook improve. It will be dropped from the Featured Stocks list tonight.
>>> FEATURED STOCK ARTICLE : Griffon Near All-Time High Making Limited Progress - 9/15/2022 |
View all notes |
Set NEW NOTE alert |
Company Profile |
SEC
News |
Chart |
Request a new note
C
A
S
I |
CLH
-
NYSE
Clean Harbors Inc
Pollution Control
|
$109.62
|
-2.84
-2.53% |
$111.16
|
654,778
179.39% of 50 DAV
50 DAV is 365,000
|
$124.49
-11.94%
|
8/10/2022
|
$111.78
|
PP = $115.10
|
|
MB = $120.86
|
Most Recent Note - 9/23/2022 12:27:59 PM
G - Color code is changed to green after gapping down and violating its 50 DMA line ($110.45) with today's 4th consecutive loss raising concerns and triggering a technical sell signal. Fundamentals remain strong.
>>> FEATURED STOCK ARTICLE : Tested Support Near Prior High in the $115 Area - 9/19/2022 |
View all notes |
Set NEW NOTE alert |
Company Profile |
SEC
News |
Chart |
Request a new note
C
A
S
I |
CASY
-
NASDAQ
Caseys General Stores
RETAIL - Super/Mini Markets
|
$202.54
|
-6.11
-2.93% |
$207.89
|
299,935
120.94% of 50 DAV
50 DAV is 248,000
|
$223.90
-9.54%
|
9/8/2022
|
$217.81
|
PP = $222.40
|
|
MB = $233.52
|
Most Recent Note - 9/23/2022 5:52:33 PM
G - Violated its 50 DMA line ($210) decisively this week and above average volume was behind today's 4th consecutive loss triggering a technical sell signal. Color code is changed to green. Only a prompt rebound above the 50 DMA line would help its outlook improve.
>>> FEATURED STOCK ARTICLE : Casey's is Perched Within Close Range of All-Time High - 9/9/2022 |
View all notes |
Set NEW NOTE alert |
Company Profile |
SEC
News |
Chart |
Request a new note
C
A
S
I |
CPRX
-
NASDAQ
Catalyst Pharma Inc
Medical-Biomed/Biotech
|
$11.87
|
-0.33
-2.70% |
$12.11
|
3,369,484
90.97% of 50 DAV
50 DAV is 3,704,000
|
$17.22
-31.07%
|
9/8/2022
|
$15.14
|
PP = $15.17
|
|
MB = $15.93
|
Most Recent Note - 9/23/2022 5:58:17 PM
Slumped further below its 50 DMA line ($12.53) with today's 7th consecutive loss raising greater concerns. Only a prompt rebound above the 50 DMA line would help its outlook improve. It will be dropped from the Featured Stocks list tonight.
>>> FEATURED STOCK ARTICLE : Hit a New High After a 4-Week Tight Pattern of Closes - 9/8/2022 |
View all notes |
Set NEW NOTE alert |
Company Profile |
SEC
News |
Chart |
Request a new note
C
A
S
I |
CCRN
-
NASDAQ
Cross Country Healthcare
DIVERSIFIED SERVICES - Staffing and Outsourcing Service
|
$27.17
|
-0.11
-0.40% |
$27.27
|
738,376
80.70% of 50 DAV
50 DAV is 915,000
|
$30.51
-10.95%
|
9/9/2022
|
$27.32
|
PP = $30.61
|
|
MB = $32.14
|
Most Recent Note - 9/22/2022 12:16:39 PM
Y - Volume totals have been cooling while consolidating within striking distance of prior highs in the $30 area. Its 50 DMA line ($25.93) defines important support to watch on pullbacks. Recently reported insider buying is a reassuring sign.The market is in a correction (M criteria) and disciplined investors know to avoid new buying efforts until a new rally confirmed with a follow-through day.
>>> FEATURED STOCK ARTICLE : Positive Reversal While Consolidating Above 50-Day Moving Average - 9/12/2022 |
View all notes |
Set NEW NOTE alert |
Company Profile |
SEC
News |
Chart |
Request a new note
C
A
S
I |
Symbol/Exchange
Company Name
Industry Group |
PRICE |
CHANGE
(%Change) |
Day High |
Volume
(% DAV)
(% 50 day avg vol) |
52 Wk Hi
% From Hi |
Featured
Date |
Price
Featured |
Pivot Featured |
|
Max Buy |
|
|
|
THESE ARE NOT BUY RECOMMENDATIONS!
Comments contained in the body of this report are technical
opinions only. The material herein has been obtained
from sources believed to be reliable and accurate, however,
its accuracy and completeness cannot be guaranteed.
This site is not an investment advisor, hence it does
not endorse or recommend any securities or other investments.
Any recommendation contained in this report may not
be suitable for all investors and it is not to be deemed
an offer or solicitation on our part with respect to
the purchase or sale of any securities. All trademarks,
service marks and trade names appearing in this report
are the property of their respective owners, and are
likewise used for identification purposes only.
This report is a service available
only to active Paid Premium Members.
You may opt-out of receiving report notifications
at any time. Questions or comments may be submitted
by writing to Premium Membership Services 665 S.E. 10 Street, Suite 201 Deerfield Beach, FL 33441-5634 or by calling 1-800-965-8307
or 954-785-1121.
|
|
|