You are not logged in.
This means you
CAN ONLY VIEW reports that were published prior to Tuesday, February 20, 2024.
You
MUST UPGRADE YOUR MEMBERSHIP if you want to see any current reports.
AFTER MARKET UPDATE - TUESDAY, SEPTEMBER 22ND, 2020
Previous After Market Report Next After Market Report >>>
|
|
|
|
DOW |
+140.48 |
27,288.18 |
+0.52% |
|
Volume |
947,252,915 |
-22% |
|
Volume |
3,482,928,600 |
-9% |
|
NASDAQ |
+183.20 |
10,962.00 |
+1.70% |
|
Advancers |
1,673 |
56% |
|
Advancers |
1,688 |
50% |
|
S&P 500 |
+34.51 |
3,315.57 |
+1.05% |
|
Decliners |
1,301 |
44% |
|
Decliners |
1,656 |
50% |
|
Russell 2000 |
+11.71 |
1,496.96 |
+0.79% |
|
52 Wk Highs |
30 |
|
|
52 Wk Highs |
36 |
|
|
S&P 600 |
+5.65 |
846.18 |
+0.67% |
|
52 Wk Lows |
26 |
|
|
52 Wk Lows |
56 |
|
|
The major indices have been under pressure and have shown worrisome action indicative of a market correction. Leadership is very thin. Weakness in stocks on a case-by-case basis prompts disciplined investors to reduce market exposure and raise cash.
|
 |
Major Indices Rose With Lighter Volume Revealing Lackluster Demand
Kenneth J. Gruneisen - Passed the CAN SLIM® Master's Exam
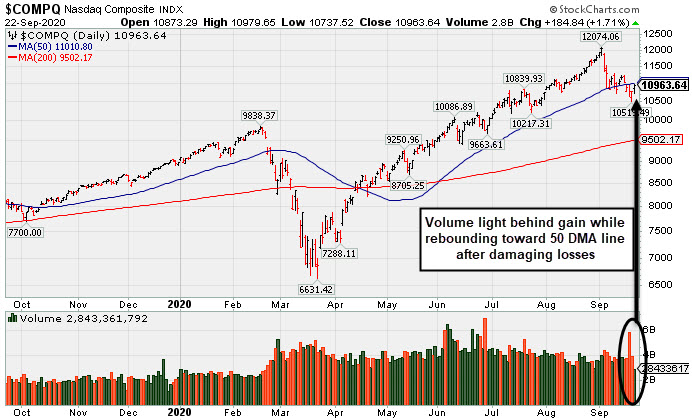
The S&P 500 rose 1.1%, rebounding from a four day decline that had marked its longest losing streak since February. However, the benchmark index is off more than 7% from its all-time high notched in early September, and is on pace for its first monthly decline since March. The Dow added 140 points, while the Nasdaq Composite advanced 1.7%. The reported volume totals were lighter than the prior session totals on the NYSE and on the Nasdaq exchange, revealing lackluster institutional buying demand. Advancers led decliners by a 4-3 margin on the NYSE while the mix was nearly even on the Nasdaq exchange. Leadership improved as there were 8 high-ranked companies from the Leaders List that hit new 52-week highs and were listed on the BreakOuts Page, versus the total of only 1 on the prior session. New 52-week highs outnumbered new 52-week lows on the NYSE but new lows outnumbered new highs on the Nasdaq exchange. The major indices have been showing action indicative of a market correction (M criteria). In weak markets it is considered critical to reduce exposure and sell faltering stocks on a case-by-case basis.
PICTURED: The Nasdaq Composite Index posted a gain with lighter volume, rebounding toward its 50-day moving average (DMA) line after damaging volume-driven losses.
Stocks finished higher Tuesday as investors bought the dip despite cautionary commentary from the Federal Reserve. In a speech on Capitol Hill today, Fed Chair Jerome Powell said the economy has a long way to go before fully recovering. He also noted that the Fed is open to more relaxed rules for financial institutions during the pandemic and reiterated the central bank’s support to help the economy fully recover.
Eight of 11 S&P 500 sectors ended the day in positive territory. Consumer Discretionary shares paced the gains, with Amazon (AMZN +5.69%) rose on the heels of an analyst upgrade. In other corporate news, Carvana (CVNA +30.61%) rallied for a best-ever close after the car retailer forecasted a break even third quarter amid record sales. Elsewhere, Comcast (CMCSA +3.38%) after an activist investor took a $900 million dollar stake in the company, calling shares undervalued.
On the data front, existing home sales rose 2.4% in August, in-line with forecasts and slowing from July’s 24.7% jump. Separately, an update showed manufacturing activity in the Richmond Fed region unexpectedly improved in September. Treasuries fluctuated, with the yield on the 10-year note unchanged at 0.67%. In commodities, WTI crude oil rose 0.7% to $39.60/barrel, stabilizing from yesterday’s decline of nearly 4.0%. |
 Kenneth J. Gruneisen started out as a licensed stockbroker in August 1987, a couple of months prior to the historic stock market crash that took the Dow Jones Industrial Average down -22.6% in a single day. He has published daily fact-based fundamental and technical analysis on high-ranked stocks online for two decades. Through FACTBASEDINVESTING.COM, Kenneth provides educational articles, news, market commentary, and other information regarding proven investment systems that work in good times and bad.
Comments contained in the body of this report are technical opinions only and are not necessarily those of Gruneisen Growth Corp. The material herein has been obtained from sources believed to be reliable and accurate, however, its accuracy and completeness cannot be guaranteed. Our firm, employees, and customers may effect transactions, including transactions contrary to any recommendation herein, or have positions in the securities mentioned herein or options with respect thereto. Any recommendation contained in this report may not be suitable for all investors and it is not to be deemed an offer or solicitation on our part with respect to the purchase or sale of any securities. |
|
 |
Retail, Tech Sector, and Gold & Silver Index Rose
Kenneth J. Gruneisen - Passed the CAN SLIM® Master's Exam
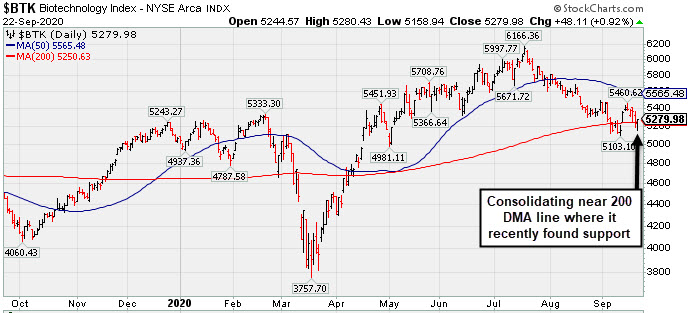
The major indices were helped by a solid gain from the Retail Index ($RLX +3.64%) while the Bank Index ($BKX -2.34%) suffered a solid loss and the Broker/Dealer Index ($XBD -0.42%) also lost ground. The tech sector had a positive bias as the Semiconductor Index ($SOX +1.21%), Networking Index ($NWX +0.82%), and Biotech Index ($BTK +0.92%) posted unanimous gains. Commodity-linked groups were mixed as the Oil Services Index ($OSX -0.48%) and Integrated Oil Index ($XOI -0.74%) both lost ground while the Gold & Silver Index ($XAU +0.53%) edged higher. PICTURED: The Biotech Index ($BTK +0.92%) is consolidating near its 200-day moving average (DMA)) line where it recently found support.
| Oil Services |
$OSX |
31.50 |
-0.15 |
-0.48% |
-59.76% |
| Integrated Oil |
$XOI |
641.01 |
-4.76 |
-0.74% |
-49.55% |
| Semiconductor |
$SOX |
2,180.25 |
+25.97 |
+1.21% |
+17.88% |
| Networking |
$NWX |
536.04 |
+4.35 |
+0.82% |
-8.12% |
| Broker/Dealer |
$XBD |
274.89 |
-1.15 |
-0.42% |
-5.33% |
| Retail |
$RLX |
3,368.58 |
+118.22 |
+3.64% |
+37.53% |
| Gold & Silver |
$XAU |
145.54 |
+0.77 |
+0.53% |
+36.12% |
| Bank |
$BKX |
71.62 |
-1.72 |
-2.34% |
-36.82% |
| Biotech |
$BTK |
5,279.98 |
+48.11 |
+0.92% |
+4.19% |
|
|
|
 |
Featured Stocks
Kenneth J. Gruneisen - Passed the CAN SLIM® Master's Exam
Charles River Labs Intl (CRL)
showed resilience this week and rebounded near its all-time high with 3 consecutive gains. It found prompt support at its 50-day moving average (DMA) line ($205.04) after a spurt of volume-driven losses. Subsequent losses leading to a violation of the 50 DMA line and prior low ($197.33 on 9.04/20) may raise greater concerns and trigger technical sell signals.
Recently it raised fundamental concerns after it reported Jun '20 quarterly earnings -3% on +4% sales revenues, below the +25% minimum guideline (C criteria), but the results were better than expected and the company also raised its guidance. It now has a 92 Earnings Per Share Rating, down from 96 prior to the report. The 2 prior quarterly earnings increases were above the +25% minimum guideline (C criteria) of the fact-based investment system. Annual earnings (A criteria) history has been strong and steady.
It hails from the Medical - Research Equipment/Services industry group which has an 74 Group Relative Strength Rating (L criteria). The number of top-rated funds owning its shares rose from 681 in Dec '19 to 755 in Jun '20, and its Up/Down Volume Ratio is 1.3, an unbiased indication its shares have been under accumulation over the past 50 days. There is a small number of only 49.7 million shares (S criteria) outstanding, which can contribute to greater price volatility in the event of institutional buying or selling.
|
|
|
Color Codes Explained :
Y - Better candidates highlighted by our
staff of experts.
G - Previously featured
in past reports as yellow but may no longer be buyable under the
guidelines.
***Last / Change / Volume data in this table is the closing quote data***
Symbol/Exchange
Company Name
Industry Group |
PRICE |
CHANGE
(%Change) |
Day High |
Volume
(% DAV)
(% 50 day avg vol) |
52 Wk Hi
% From Hi |
Featured
Date |
Price
Featured |
Pivot Featured |
|
Max Buy |
 ADBE
-
NASDAQ
ADBE
-
NASDAQ
Adobe Inc
COMPUTER SOFTWARE and SERVICES - Application Software
|
$486.78
|
+11.14
2.34% |
$487.20
|
2,622,008
83.82% of 50 DAV
50 DAV is 3,128,000
|
$536.88
-9.33%
|
9/10/2020
|
$488.46
|
PP = $536.88
|
|
MB = $563.72
|
 Most Recent Note - 9/22/2020 5:58:26 PM
G - Posted a gain today with lighter volume. Found prompt support after undercutting its prior low ($461.18 on 9/08/20) and its 50 DMA line ($465). Disciplined investors always limit losses by selling any stock that falls more than 7-8% from their purchase price. Reported Aug '20 quarterly earnings +25% on +14% sales revenues versus the year ago period.
>>> FEATURED STOCK ARTICLE : Adobe Found Support Following Recent Breakout - 9/10/2020 |
View all notes |
Set NEW NOTE alert |
Company Profile |
SEC
News |
Chart |
Request a new note
C
A
S
I |
CRL
-
NYSE
Charles River Labs Intl
DRUGS - Biotechnology
|
$217.33
|
-0.60
-0.28% |
$218.78
|
275,037
81.13% of 50 DAV
50 DAV is 339,000
|
$228.86
-5.04%
|
7/15/2020
|
$192.66
|
PP = $189.95
|
|
MB = $199.45
|
Most Recent Note - 9/18/2020 4:53:53 PM
G - Posted a gain today with above average volume. Still perched near its all-time high after falling back below prior highs in the $221 area. Found prompt support at its 50 DMA line ($208.94) after volume-driven losses. More damaging losses would raise greater concerns and trigger a technical sell signal. Recently reported Jun '20 quarterly earnings -3% on +4% sales revenues, below the +25% minimum guideline (C criteria), but better than expected while the company also raised its guidance.
>>> FEATURED STOCK ARTICLE : Found Prompt Support at 50-Day Moving Average Line - 9/11/2020 |
View all notes |
Set NEW NOTE alert |
Company Profile |
SEC
News |
Chart |
Request a new note
C
A
S
I |
AMD
-
NASDAQ
Advanced Micro Devices
ELECTRONICS - Semiconductor - Broad Line
|
$77.70
|
-0.24
-0.31% |
$78.79
|
55,892,310
85.34% of 50 DAV
50 DAV is 65,493,000
|
$94.28
-17.59%
|
8/31/2020
|
$90.42
|
PP = $87.39
|
|
MB = $91.76
|
Most Recent Note - 9/21/2020 4:50:37 PM
G - Posted a solid gain today with near average volume while promptly rebounding above its 50 DMA line ($76.50), action indicative of institutional support. Faces near-term resistance due to overhead supply up to the $94 level. Fundamentals remain strong.
>>> FEATURED STOCK ARTICLE : Found Support Above 50 DMA Line After Negating Recent Breakout - 9/15/2020 |
View all notes |
Set NEW NOTE alert |
Company Profile |
SEC
News |
Chart |
Request a new note
C
A
S
I |
TREX
-
NYSE
Trex Company Inc
MATERIALS and CONSTRUCTION - General Building Materials
|
$68.24
|
+1.88
2.83% |
$68.29
|
982,361
91.13% of 50 DAV
50 DAV is 1,078,000
|
$78.32
-12.87%
|
6/26/2020
|
$54.53
|
PP = $66.47
|
|
MB = $69.79
|
Most Recent Note - 9/22/2020 6:03:14 PM
G - Rebounded toward its 50 DMA line ($70.12) with today's gain on near average (lighter) volume. More damaging losses would raise greater concerns. Do not be confused by the 2:1 share split effective 9/15/20 (Featured Price, Pivot Point, and Max Buy prices have been adjusted accordingly). Fundamentals remain strong.
>>> FEATURED STOCK ARTICLE : Slumped Below 50-Day Average With Loss on Light Volume - 9/17/2020 |
View all notes |
Set NEW NOTE alert |
Company Profile |
SEC
News |
Chart |
Request a new note
C
A
S
I |
NFLX
-
NASDAQ
Netflix Inc
SPECIALTY RETAIL - Music and Video Stores
|
$491.17
|
+3.82
0.78% |
$491.82
|
3,457,741
45.86% of 50 DAV
50 DAV is 7,539,000
|
$575.37
-14.63%
|
9/1/2020
|
$547.45
|
PP = $575.47
|
|
MB = $604.24
|
Most Recent Note - 9/21/2020 4:47:59 PM
G - Rebounded toward its 50 DMA line ($498.84) with light volume behind today's gain. Subsequent gains back above the 50 DMA line are needed for its outlook to improve.
>>> FEATURED STOCK ARTICLE : Met Resistance at 50 DMA Line and Reversed Today - 9/16/2020 |
View all notes |
Set NEW NOTE alert |
Company Profile |
SEC
News |
Chart |
Request a new note
C
A
S
I |
Symbol/Exchange
Company Name
Industry Group |
PRICE |
CHANGE
(%Change) |
Day High |
Volume
(% DAV)
(% 50 day avg vol) |
52 Wk Hi
% From Hi |
Featured
Date |
Price
Featured |
Pivot Featured |
|
Max Buy |
LGIH
-
NASDAQ
L G I Homes Inc
Bldg-Resident/Comml
|
$112.50
|
+5.28
4.92% |
$112.66
|
317,505
103.09% of 50 DAV
50 DAV is 308,000
|
$123.94
-9.23%
|
7/7/2020
|
$99.19
|
PP = $95.82
|
|
MB = $100.61
|
Most Recent Note - 9/22/2020 6:00:56 PM
G - Rebounded near its 50 DMA line ($112.89) with today's big gain on average volume. Found prompt support after briefly undercutting prior lows in the $103-104 area. More damaging losses would raise greater concerns. Reported Jun '20 quarterly earnings +21% on +4% sales revenues, breaking a streak of 4 comparisons above the +25% minimum guideline (C criteria).
>>> FEATURED STOCK ARTICLE : Violation of 50-Day Average on Volume Triggered Technical Sell Signal - 9/18/2020 |
View all notes |
Set NEW NOTE alert |
Company Profile |
SEC
News |
Chart |
Request a new note
C
A
S
I |
NOW
-
NYSE
Servicenow Inc
Computer Sftwr-Enterprse
|
$470.57
|
+8.69
1.88% |
$471.10
|
929,772
54.76% of 50 DAV
50 DAV is 1,698,000
|
$501.82
-6.23%
|
8/20/2020
|
$453.34
|
PP = $454.79
|
|
MB = $477.53
|
Most Recent Note - 9/21/2020 4:52:39 PM
Y - Posted a gain today with light volume, still showing resilience and finding support at its 50 DMA line ($446). Fundamentals remain strong. More damaging losses below the 50 DMA line and prior low ($432.85 on 9/08/20) may raise concerns and trigger a technical sell signal.
>>> FEATURED STOCK ARTICLE : Tested Support at 50-Day Moving Average Line - 9/14/2020 |
View all notes |
Set NEW NOTE alert |
Company Profile |
SEC
News |
Chart |
Request a new note
C
A
S
I |
|
|
|
THESE ARE NOT BUY RECOMMENDATIONS!
Comments contained in the body of this report are technical
opinions only. The material herein has been obtained
from sources believed to be reliable and accurate, however,
its accuracy and completeness cannot be guaranteed.
This site is not an investment advisor, hence it does
not endorse or recommend any securities or other investments.
Any recommendation contained in this report may not
be suitable for all investors and it is not to be deemed
an offer or solicitation on our part with respect to
the purchase or sale of any securities. All trademarks,
service marks and trade names appearing in this report
are the property of their respective owners, and are
likewise used for identification purposes only.
This report is a service available
only to active Paid Premium Members.
You may opt-out of receiving report notifications
at any time. Questions or comments may be submitted
by writing to Premium Membership Services 665 S.E. 10 Street, Suite 201 Deerfield Beach, FL 33441-5634 or by calling 1-800-965-8307
or 954-785-1121.
|
|
|