You are not logged in.
This means you
CAN ONLY VIEW reports that were published prior to Monday, February 19, 2024.
You
MUST UPGRADE YOUR MEMBERSHIP if you want to see any current reports.
AFTER MARKET UPDATE - MONDAY, SEPTEMBER 21ST, 2020
Previous After Market Report Next After Market Report >>>
|
|
|
|
DOW |
-509.72 |
27,147.70 |
-1.84% |
|
Volume |
1,221,945,021 |
-62% |
|
Volume |
3,847,611,100 |
-33% |
|
NASDAQ |
-13.88 |
10,779.40 |
-0.13% |
|
Advancers |
439 |
15% |
|
Advancers |
645 |
19% |
|
S&P 500 |
-38.41 |
3,281.06 |
-1.16% |
|
Decliners |
2,523 |
85% |
|
Decliners |
2,673 |
81% |
|
Russell 2000 |
-51.53 |
1,485.25 |
-3.35% |
|
52 Wk Highs |
19 |
|
|
52 Wk Highs |
36 |
|
|
S&P 600 |
+30.04 |
840.53 |
+3.71% |
|
52 Wk Lows |
42 |
|
|
52 Wk Lows |
60 |
|
|
The major indices have been under pressure and have shown worrisome action indicative of a market correction. Leadership has evaporated. Weakness in stocks on a case-by-case basis prompts disciplined investors to reduce market exposure and raise cash.
|
 |
Weak Action Raises Concerns of a Greater Market Correction
Kenneth J. Gruneisen - Passed the CAN SLIM® Master's Exam
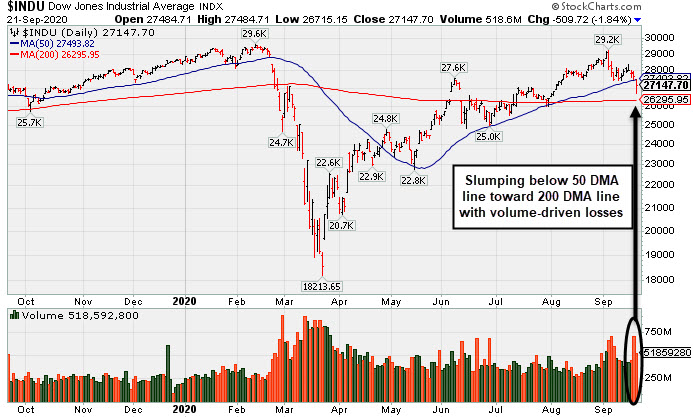
The S&P 500 fell 1.2%, its fourth consecutive decline and longest losing streak since February. The broad benchmark index briefly dipped into negative year-to-date territory during intraday trading, ending 8.4% below its most recent all-time high notched on September 2. The Dow slumped 509 points, while the Nasdaq Composite slipped just 0.1% as Tech shares outperformed. The reported volume totals were lighter than the prior session totals on the NYSE and on the Nasdaq exchange. Breadth was clearly negative as decliners led advancers by almost a 6-1 margin on the NYSE and by more than a 4-1 margin on the Nasdaq exchange. Leadership evaporated as there was only 1 high-ranked company from the Leaders List that hit a new 52-week high and was listed on the BreakOuts Page, versus the total of 17 on the prior session. New 52-week lows totals expanded and outnumbered new 52-week highs on the NYSE and on the Nasdaq exchange. The major indices are showing action indicative of a market correction (M criteria). In weak markets it is considered critical to reduce exposure and sell faltering stocks on a case-by-case basis.
PICTURED: The Dow Jones Industrial Average is slumping below its 50-day moving average (DMA) line toward its 200 DMA with recent volume-driven losses.
Stocks finished lower on Monday, extending September’s sell-off as a confluence of factors added to market uncertainty. Treasuries strengthened amid the perceived “risk off” tone, with the yield on the 10-year note down three basis points to 0.67%. In FOREX trading, a gauge of the U.S. dollar posted its best day since June.
Concerns of a resurgence in global COVID-19 cases weighed on sentiment, while political tensions in Washington also contributed to the downbeat mood. Negotiations over additional fiscal stimulus are expected to be further complicated after the passing of Justice Ruth Bader Ginsburg created an unexpected vacancy on the U.S. Supreme Court.
Ten of 11 S&P 500 sectors closed in negative territory, with the Technology group bucking the downtrend. The more cyclical and value-oriented stocks performed the worst, with Energy shares lagging amid a decline in oil prices. WTI crude slid nearly 4%, back below $40.00/barrel. Financials were also pressured after news articles alleged several major global banks of continuing to work with customers despite suspecting money laundering activities. In M&A news, President Trump agreed in concept to a deal in which Oracle (ORCL +1.79%) and Walmart (WMT +1.32%) would partner with TikTok to form a U.S.-based company, though later reports indicated he could rescind such approval. |
 Kenneth J. Gruneisen started out as a licensed stockbroker in August 1987, a couple of months prior to the historic stock market crash that took the Dow Jones Industrial Average down -22.6% in a single day. He has published daily fact-based fundamental and technical analysis on high-ranked stocks online for two decades. Through FACTBASEDINVESTING.COM, Kenneth provides educational articles, news, market commentary, and other information regarding proven investment systems that work in good times and bad.
Comments contained in the body of this report are technical opinions only and are not necessarily those of Gruneisen Growth Corp. The material herein has been obtained from sources believed to be reliable and accurate, however, its accuracy and completeness cannot be guaranteed. Our firm, employees, and customers may effect transactions, including transactions contrary to any recommendation herein, or have positions in the securities mentioned herein or options with respect thereto. Any recommendation contained in this report may not be suitable for all investors and it is not to be deemed an offer or solicitation on our part with respect to the purchase or sale of any securities. |
|
 |
Commodity-Linked Groups and Financial Indexes Led Decliners
Kenneth J. Gruneisen - Passed the CAN SLIM® Master's Exam
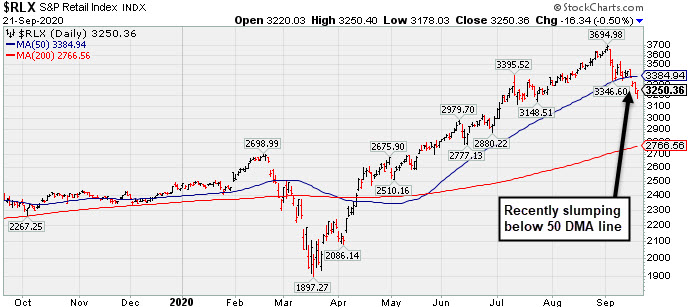
Big losses for the Broker/Dealer Index ($XBD -3.14%) and Bank Index ($BKX -3.85%) weighed on the major indices. The Biotech Index ($BTK -2.54%) and Networking Index ($NWX -1.47%) both outpaced the Semiconductor Index ($SOX -0.28%) to the downside. Commodity-linked groups were big decliners as the Oil Services Index ($OSX -6.91%), Integrated Oil Index ($XOI -3.68%), and Gold & Silver Index ($XAU -4.45%) each suffered large losses. PICTURED: The Retail Index ($RLX -0.50%) edged lower and has recently been slumping below its 50-day moving average (DMA) line.
| Oil Services |
$OSX |
31.66 |
-2.35 |
-6.91% |
-59.56% |
| Integrated Oil |
$XOI |
645.76 |
-24.70 |
-3.68% |
-49.17% |
| Semiconductor |
$SOX |
2,154.88 |
-6.10 |
-0.28% |
+16.50% |
| Networking |
$NWX |
531.69 |
-7.92 |
-1.47% |
-8.87% |
| Broker/Dealer |
$XBD |
276.04 |
-8.96 |
-3.14% |
-4.94% |
| Retail |
$RLX |
3,250.36 |
-16.34 |
-0.50% |
+32.71% |
| Gold & Silver |
$XAU |
144.78 |
-6.74 |
-4.45% |
+35.41% |
| Bank |
$BKX |
73.33 |
-2.94 |
-3.85% |
-35.31% |
| Biotech |
$BTK |
5,232.44 |
-136.24 |
-2.54% |
+3.26% |
|
|
|
 |
Featured Stocks
Kenneth J. Gruneisen - Passed the CAN SLIM® Master's Exam
|
|
|
Color Codes Explained :
Y - Better candidates highlighted by our
staff of experts.
G - Previously featured
in past reports as yellow but may no longer be buyable under the
guidelines.
***Last / Change / Volume data in this table is the closing quote data***
Symbol/Exchange
Company Name
Industry Group |
PRICE |
CHANGE
(%Change) |
Day High |
Volume
(% DAV)
(% 50 day avg vol) |
52 Wk Hi
% From Hi |
Featured
Date |
Price
Featured |
Pivot Featured |
|
Max Buy |
 ADBE
-
NASDAQ
ADBE
-
NASDAQ
Adobe Inc
COMPUTER SOFTWARE and SERVICES - Application Software
|
$475.64
|
+8.09
1.73% |
$475.86
|
3,720,699
119.14% of 50 DAV
50 DAV is 3,123,000
|
$536.88
-11.41%
|
9/10/2020
|
$488.46
|
PP = $536.88
|
|
MB = $563.72
|
Most Recent Note - 9/18/2020 12:43:27 PM
G - Color code is changed to green while undercutting its prior low ($461.18 on 9/08/20) and also slumping below its 50 DMA line ($464.22) with today's 3rd consecutive loss raising concerns and triggering technical sell signals. Disciplined investors always limit losses by selling any stock that falls more than 7-8% from their purchase price. Reported Aug '20 quarterly earnings +25% on +14% sales revenues versus the year ago period.
>>> FEATURED STOCK ARTICLE : Adobe Found Support Following Recent Breakout - 9/10/2020 |
View all notes |
Set NEW NOTE alert |
Company Profile |
SEC
News |
Chart |
Request a new note
C
A
S
I |
CRL
-
NYSE
Charles River Labs Intl
DRUGS - Biotechnology
|
$217.93
|
-1.68
-0.76% |
$218.43
|
353,437
104.88% of 50 DAV
50 DAV is 337,000
|
$228.86
-4.78%
|
7/15/2020
|
$192.66
|
PP = $189.95
|
|
MB = $199.45
|
Most Recent Note - 9/18/2020 4:53:53 PM
G - Posted a gain today with above average volume. Still perched near its all-time high after falling back below prior highs in the $221 area. Found prompt support at its 50 DMA line ($208.94) after volume-driven losses. More damaging losses would raise greater concerns and trigger a technical sell signal. Recently reported Jun '20 quarterly earnings -3% on +4% sales revenues, below the +25% minimum guideline (C criteria), but better than expected while the company also raised its guidance.
>>> FEATURED STOCK ARTICLE : Found Prompt Support at 50-Day Moving Average Line - 9/11/2020 |
View all notes |
Set NEW NOTE alert |
Company Profile |
SEC
News |
Chart |
Request a new note
C
A
S
I |
AMD
-
NASDAQ
Advanced Micro Devices
ELECTRONICS - Semiconductor - Broad Line
|
$77.94
|
+3.01
4.02% |
$77.98
|
61,039,833
93.24% of 50 DAV
50 DAV is 65,464,000
|
$94.28
-17.33%
|
8/31/2020
|
$90.42
|
PP = $87.39
|
|
MB = $91.76
|
 Most Recent Note - 9/21/2020 4:50:37 PM
G - Posted a solid gain today with near average volume while promptly rebounding above its 50 DMA line ($76.50), action indicative of institutional support. Faces near-term resistance due to overhead supply up to the $94 level. Fundamentals remain strong.
>>> FEATURED STOCK ARTICLE : Found Support Above 50 DMA Line After Negating Recent Breakout - 9/15/2020 |
View all notes |
Set NEW NOTE alert |
Company Profile |
SEC
News |
Chart |
Request a new note
C
A
S
I |
TREX
-
NYSE
Trex Company Inc
MATERIALS and CONSTRUCTION - General Building Materials
|
$66.36
|
-0.02
-0.03% |
$66.50
|
1,066,179
95.36% of 50 DAV
50 DAV is 1,118,000
|
$78.32
-15.27%
|
6/26/2020
|
$54.53
|
PP = $66.47
|
|
MB = $69.79
|
Most Recent Note - 9/18/2020 4:55:23 PM
G - Slumped further below its 50 DMA line ($69.90) with today's loss on higher volume raising concerns. The recent low ($65.60 on 9/08/20) defines the next important support level to watch. Do not be confused by the 2:1 share split effective 9/15/20 (Featured Price, Pivot Point, and Max Buy prices have been adjusted accordingly). Fundamentals remain strong. See the latest FSU analysis for more details and an annotated graph.
>>> FEATURED STOCK ARTICLE : Slumped Below 50-Day Average With Loss on Light Volume - 9/17/2020 |
View all notes |
Set NEW NOTE alert |
Company Profile |
SEC
News |
Chart |
Request a new note
C
A
S
I |
NFLX
-
NASDAQ
Netflix Inc
SPECIALTY RETAIL - Music and Video Stores
|
$487.35
|
+17.39
3.70% |
$487.78
|
5,335,090
67.86% of 50 DAV
50 DAV is 7,862,000
|
$575.37
-15.30%
|
9/1/2020
|
$547.45
|
PP = $575.47
|
|
MB = $604.24
|
Most Recent Note - 9/21/2020 4:47:59 PM
G - Rebounded toward its 50 DMA line ($498.84) with light volume behind today's gain. Subsequent gains back above the 50 DMA line are needed for its outlook to improve.
>>> FEATURED STOCK ARTICLE : Met Resistance at 50 DMA Line and Reversed Today - 9/16/2020 |
View all notes |
Set NEW NOTE alert |
Company Profile |
SEC
News |
Chart |
Request a new note
C
A
S
I |
Symbol/Exchange
Company Name
Industry Group |
PRICE |
CHANGE
(%Change) |
Day High |
Volume
(% DAV)
(% 50 day avg vol) |
52 Wk Hi
% From Hi |
Featured
Date |
Price
Featured |
Pivot Featured |
|
Max Buy |
LGIH
-
NASDAQ
L G I Homes Inc
Bldg-Resident/Comml
|
$107.22
|
+1.46
1.38% |
$107.55
|
332,606
107.99% of 50 DAV
50 DAV is 308,000
|
$123.94
-13.49%
|
7/7/2020
|
$99.19
|
PP = $95.82
|
|
MB = $100.61
|
Most Recent Note - 9/18/2020 4:52:20 PM
G - Violated its 50 DMA line ($112.49) with today's damaging volume-driven loss raising greater concerns and triggering a technical sell signal. Prior lows in the $103-104 area define the next important support level to watch. Only a prompt rebound above the 50 DMA line would help its outlook improve. Reported Jun '20 quarterly earnings +21% on +4% sales revenues, breaking a streak of 4 comparisons above the +25% minimum guideline (C criteria). See the latest FSU analysis for more details and a new annotated graph.
>>> FEATURED STOCK ARTICLE : Violation of 50-Day Average on Volume Triggered Technical Sell Signal - 9/18/2020 |
View all notes |
Set NEW NOTE alert |
Company Profile |
SEC
News |
Chart |
Request a new note
C
A
S
I |
NOW
-
NYSE
Servicenow Inc
Computer Sftwr-Enterprse
|
$461.88
|
+8.79
1.94% |
$462.40
|
1,066,642
62.52% of 50 DAV
50 DAV is 1,706,000
|
$501.82
-7.96%
|
8/20/2020
|
$453.34
|
PP = $454.79
|
|
MB = $477.53
|
Most Recent Note - 9/21/2020 4:52:39 PM
Y - Posted a gain today with light volume, still showing resilience and finding support at its 50 DMA line ($446). Fundamentals remain strong. More damaging losses below the 50 DMA line and prior low ($432.85 on 9/08/20) may raise concerns and trigger a technical sell signal.
>>> FEATURED STOCK ARTICLE : Tested Support at 50-Day Moving Average Line - 9/14/2020 |
View all notes |
Set NEW NOTE alert |
Company Profile |
SEC
News |
Chart |
Request a new note
C
A
S
I |
|
|
|
THESE ARE NOT BUY RECOMMENDATIONS!
Comments contained in the body of this report are technical
opinions only. The material herein has been obtained
from sources believed to be reliable and accurate, however,
its accuracy and completeness cannot be guaranteed.
This site is not an investment advisor, hence it does
not endorse or recommend any securities or other investments.
Any recommendation contained in this report may not
be suitable for all investors and it is not to be deemed
an offer or solicitation on our part with respect to
the purchase or sale of any securities. All trademarks,
service marks and trade names appearing in this report
are the property of their respective owners, and are
likewise used for identification purposes only.
This report is a service available
only to active Paid Premium Members.
You may opt-out of receiving report notifications
at any time. Questions or comments may be submitted
by writing to Premium Membership Services 665 S.E. 10 Street, Suite 201 Deerfield Beach, FL 33441-5634 or by calling 1-800-965-8307
or 954-785-1121.
|
|
|