You are not logged in.
This means you
CAN ONLY VIEW reports that were published prior to Monday, February 19, 2024.
You
MUST UPGRADE YOUR MEMBERSHIP if you want to see any current reports.
AFTER MARKET UPDATE - MONDAY, SEPTEMBER 19TH, 2022
Previous After Market Report Next After Market Report >>>
|
|
|
|
DOW |
+197.26 |
31,019.68 |
+0.64% |
|
Volume |
913,525,922 |
-73% |
|
Volume |
4,153,669,400 |
-42% |
|
NASDAQ |
+86.62 |
11,535.02 |
+0.76% |
|
Advancers |
1,753 |
57% |
|
Advancers |
1,944 |
44% |
|
S&P 500 |
+26.56 |
3,899.89 |
+0.69% |
|
Decliners |
1,300 |
43% |
|
Decliners |
2,449 |
56% |
|
Russell 2000 |
+14.65 |
1,812.84 |
+0.81% |
|
52 Wk Highs |
15 |
|
|
52 Wk Highs |
42 |
|
|
S&P 600 |
+11.66 |
1,156.64 |
+1.02% |
|
52 Wk Lows |
229 |
|
|
52 Wk Lows |
493 |
|
|
The market (M criteria) is in a correction. A caution flag has been raised by the technical damage in the major indices coupled with a shrinking list of stocks hitting new highs. Disciplined investors know to raise cash by selling weakening stocks on a case-by-case basis, and to protect that cash by avoiding any new buys until a new rally is confirmed with a follow-through day.
|
 |
Major Indices Rose With Mixed Breadth and Lighter Volume Totals
Kenneth J. Gruneisen - Passed the CAN SLIM® Master's Exam
The Dow added 197 points, while the Nasdaq Composite finished 0.8% higher. The S&P 500 advanced 0.7%.The volume totals reported were lighter than the prior session on the NYSE and on the Nasdaq exchange, as Friday's totals were inflated by options expirations. Breadth was mixed as advancers led decliners by about a 3-2 margin on the NYSE while decliners led advancers by a 5-4 margin on the Nasdaq exchange. Leadership remained thin as there was 1 high-ranked company from the Leaders List that hit a new 52-week high and was listed on the BreakOuts Page, up from zero on the prior session. New 52-week lows totals again solidly outnumbered new 52-week highs on both the NYSE and the Nasdaq exchange. The market is now in a correction (M criteria).
Chart courtesy of www.stockcharts.com%20on%20Tuesday.%20Yesterday,%20the%20broad%20benchmark%20eclipsed%20the%204,300%20level%20for%20the%20first%20time%20since%20late%20April.%20The%20Nasdaq%20Composite%20fell%201.3%%20amid%20weakness%20in%20mega-cap%20tech%20shares.%20The%20volume%20totals%20reported%20were%20mixed,%20lighter%20than%20the%20prior%20session%20on%20the%20NYSE%20and%20higher%20on%20the%20Nasdaq%20exchange.%20Decliners%20led%20advancers%20by%20a%204-1%20margin%20on%20the%20NYSE%20ad%20by%20a%203-1%20margin%20on%20the%20Nasdaq%20exchange.%20There%20were%2017%20high-ranked%20companies%20from%20the%20Leaders%20List%20that%20hit%20new%2052-week%20highs%20and%20were%20listed%20on%20the%20BreakOuts%20Page,%20down%20from%20the%20total%20of%2045%20on%20the%20prior%20session.%20New%2052-week%20highs%20outnumbered%20new%2052-week%20lows%20on%20the%20NYSE,%20but%20new%20lows%20outnumbered%20new%20highs%20on%20the%20Nasdaq%20exchange.%20The%20market%20is%20in%20a%20confirmed%20uptrend%20(M%20criteria).%20Any%20sustainable%20rally%20requires%20a%20healthy%20crop%20of%20leading%20stocks%20hitting%20new%20highs,%20so%20the%20recent%20improvement%20in%20leadership%20was%20a%20reassuring%20sign.) 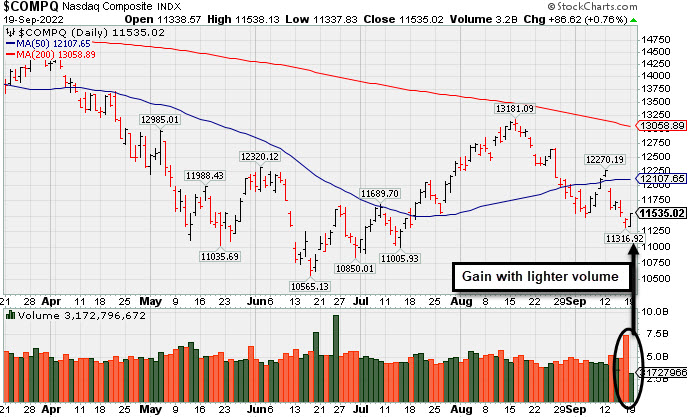 PICTURED: The Nasdaq Composite Index posted a gain with lighter volume. It recently slumped back below its 50-day moving average (DMA) line toward the June low.
U.S. equities finished higher in a volatile session Monday as investors turned their attention to the Federal Reserve’s (Fed) monetary policy meeting. The Fed’s two-day meeting will commence tomorrow, and the expectation is the central bank will implement a third-straight 75 basis point (0.75%) rate hike. Nine of 11 sectors in the S&P 500 finished in positive territory, with Materials pacing gains.
On the data front today, a gauge of U.S. homebuilder sentiment fell for the ninth-straight month, its longest stretch of declines since 1985. The report showed measures of current and future sales fell to their weakest levels since May 2020. Rising mortgage rates, which last week hit their highest level since 2008, were cited as the main reason for the cool-down in the housing market.
Treasuries weakened, with the yield on the 10-year note up four basis points (0.04%) to 3.49%. The benchmark yield hit 3.51% earlier in the session, its highest level since 2011. Meanwhile, the yield on the more policy-sensitive two-year note added eight basis points (0.08%) to 3.94%, to hover just below its highest level since October 2007. In commodities, West Texas Intermediate (WTI) crude climbed 0.1% to $85.22/barrel despite concerns over global fuel demand. Market participants weighed demand worries against easing COVID-19 restrictions in China and ongoing tight supply conditions. A gauge of the U.S. dollar has reversed earlier gains to end 0.1% lower, though it remained near a two-decade high. |
 Kenneth J. Gruneisen started out as a licensed stockbroker in August 1987, a couple of months prior to the historic stock market crash that took the Dow Jones Industrial Average down -22.6% in a single day. He has published daily fact-based fundamental and technical analysis on high-ranked stocks online for two decades. Through FACTBASEDINVESTING.COM, Kenneth provides educational articles, news, market commentary, and other information regarding proven investment systems that work in good times and bad.
Comments contained in the body of this report are technical opinions only and are not necessarily those of Gruneisen Growth Corp. The material herein has been obtained from sources believed to be reliable and accurate, however, its accuracy and completeness cannot be guaranteed. Our firm, employees, and customers may effect transactions, including transactions contrary to any recommendation herein, or have positions in the securities mentioned herein or options with respect thereto. Any recommendation contained in this report may not be suitable for all investors and it is not to be deemed an offer or solicitation on our part with respect to the purchase or sale of any securities. |
|
 |
Retail, Financial, Gold & Silver, and Semiconductor Indexes Rose
Kenneth J. Gruneisen - Passed the CAN SLIM® Master's Exam
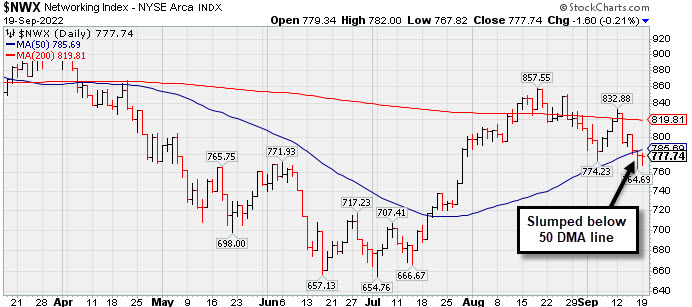
The Retail Index ($RLX +1.00%), Broker/Dealer Index ($XBD +1.00%), and Bank Index ($BKX +1.13%) each posted a gain +1% or more as they had a positive influence on the major averages. The Gold & Silver Index ($XAU +2.67%) posted a standout gain. The Oil Services Index ($OSX +0.21%) and Integrated Oil Index ($XOI -0.15%) were mixed and little changed. The tech sector was also mixed as the Semiconductor Index ($SOX +0.58%) edged higher while the Biotech Index ($BTK -0.45%) and Networking Index ($NWX -0.21%) each suffered a small loss.
PICTURED: The Networking Index ($NWX -0.21%) met resistance recently near its 200-day moving average (DMA) line and slumped below its 50 DMA line.
| Oil Services |
$OSX |
66.52 |
+0.14 |
+0.21% |
+26.18% |
| Integrated Oil |
$XOI |
1,599.44 |
-2.34 |
-0.15% |
+35.75% |
| Semiconductor |
$SOX |
2,577.94 |
+14.80 |
+0.58% |
-34.67% |
| Networking |
$NWX |
777.74 |
-1.60 |
-0.21% |
-19.91% |
| Broker/Dealer |
$XBD |
443.08 |
+4.38 |
+1.00% |
-8.99% |
| Retail |
$RLX |
3,192.64 |
+31.59 |
+1.00% |
-24.46% |
| Gold & Silver |
$XAU |
102.42 |
+2.66 |
+2.67% |
-22.67% |
| Bank |
$BKX |
107.28 |
+1.20 |
+1.13% |
-18.86% |
| Biotech |
$BTK |
4,729.41 |
-21.38 |
-0.45% |
-14.30% |
|
|
|
 |
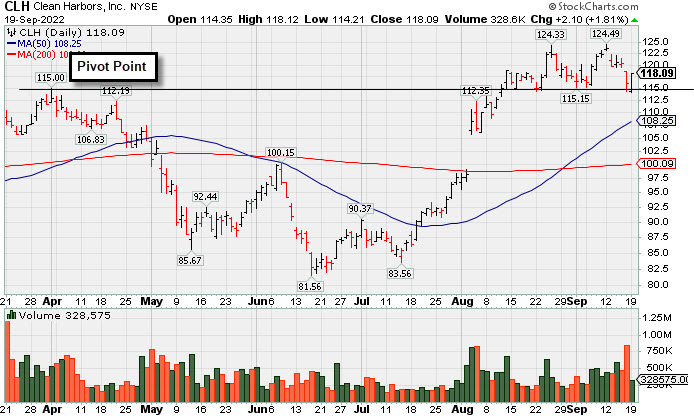
Tested Support Near Prior High in the $115 Area
Kenneth J. Gruneisen - Passed the CAN SLIM® Master's Exam
Clean Harbors Inc (CLH +$2.10 or +1.81% to $118.09) posted a gain today with near average volume, finding support after testing the prior high in the $115 area. More damaging losses would raise concerns and trigger a technical sell signal.
CLH has a highest possible Earnings Per Share Rating of 99. It reported Jun '22 quarterly earnings +105% on +46% sales revenues versus the year ago period. Prior quarters showed a strong earnings track record with earnings above the +25% minimum guideline (C criteria). Annual earnings (A criteria) growth has been strong and steady.
There are only 54.4 million shares outstanding (S criteria), which can contribute to greater price volatility in the event of institutional buying or selling. The number of top-rated funds owning its shares rose from 590 in Sep '21 to 615 in Jun '22, a reassuring sign concerning the I criteria. The current Up/Down Volume Ratio of 1.7 is an unbiased indication its shares have been under accumulation over the past 50 days. It has a Timeliness Rating of A and a Sponsorship rating of B.
|
|
|
Color Codes Explained :
Y - Better candidates highlighted by our
staff of experts.
G - Previously featured
in past reports as yellow but may no longer be buyable under the
guidelines.
***Last / Change / Volume data in this table is the closing quote data***
Symbol/Exchange
Company Name
Industry Group |
PRICE |
CHANGE
(%Change) |
Day High |
Volume
(% DAV)
(% 50 day avg vol) |
52 Wk Hi
% From Hi |
Featured
Date |
Price
Featured |
Pivot Featured |
|
Max Buy |
 CI
-
NYSE
CI
-
NYSE
Cigna Corp
Medical-Managed Care
|
$289.32
|
-1.03
-0.35% |
$289.45
|
2,042,900
105.09% of 50 DAV
50 DAV is 1,944,000
|
$296.29
-2.35%
|
7/7/2022
|
$276.55
|
PP = $273.68
|
|
MB = $287.36
|
Most Recent Note - 9/16/2022 6:14:05 PM
G - Found support above its 50 DMA line ($282) while consolidating near its all-time high hit this week. Reported earnings for the Jun '22 quarter rose +19% on +5% sales revenues versus the year ago period, breaking a streak of 3 quarterly earnings increases above the +25% minimum guideline (C criteria), raising fundamental concerns. See the latest FSU for more detailed analysis and a new annotated graph.
>>> FEATURED STOCK ARTICLE : Found Support Above 50-Day Moving Average Line This Week - 9/16/2022 |
View all notes |
Set NEW NOTE alert |
Company Profile |
SEC
News |
Chart |
Request a new note
C
A
S
I |
ESQ
-
NASDAQ
Esquire Financial Holdings
Finance-Commercial Loans
|
$39.04
|
-0.65
-1.64% |
$39.73
|
15,866
58.76% of 50 DAV
50 DAV is 27,000
|
$41.68
-6.33%
|
7/26/2022
|
$37.74
|
PP = $39.19
|
|
MB = $41.15
|
Most Recent Note - 9/16/2022 6:32:38 PM
Y - Posted a 3rd consecutive gain today, its 7th gain in the span of 8 sessions after recently finding support near its 50 DMA line ($37.25). The gain back above the pivot point was a reassuring sign of fresh institutional buying. The market is in a correction (M criteria) and disciplined investors know to avoid new buying efforts until a new rally confirmed with a follow-through day.
>>> FEATURED STOCK ARTICLE : Testing 50-Day Moving Average With 5th Straight Loss - 9/1/2022 |
View all notes |
Set NEW NOTE alert |
Company Profile |
SEC
News |
Chart |
Request a new note
C
A
S
I |
GPK
-
NYSE
Graphic Packaging Hldg
CONSUMER NON-DURABLES - Packaging and Containers
|
$21.93
|
+0.62
2.91% |
$21.97
|
3,305,727
119.69% of 50 DAV
50 DAV is 2,762,000
|
$24.07
-8.89%
|
7/26/2022
|
$22.63
|
PP = $23.09
|
|
MB = $24.24
|
 Most Recent Note - 9/19/2022 5:56:17 PM
G - Posted a solid gain today and ended near the session high. Violated its 50 DMA line ($22.34) on the prior session triggering a technical sell signal. Only a prompt rebound above its 50 DMA line would help its outlook improve.
>>> FEATURED STOCK ARTICLE : Recently Slipped Below Pivot Point Testing 50-Day Average - 9/6/2022 |
View all notes |
Set NEW NOTE alert |
Company Profile |
SEC
News |
Chart |
Request a new note
C
A
S
I |
CSL
-
NYSE
Carlisle Cos Inc
Diversified Operations
|
$296.62
|
+5.32
1.83% |
$298.08
|
484,808
101.00% of 50 DAV
50 DAV is 480,000
|
$318.71
-6.93%
|
7/28/2022
|
$282.31
|
PP = $275.23
|
|
MB = $288.99
|
Most Recent Note - 9/16/2022 2:46:38 PM
G - Gapped down today undercutting the prior low $291 and testing its 50 DMA line ($290.86). More damaging losses would raise greater concerns and trigger a technical sell signal,
>>> FEATURED STOCK ARTICLE : Consolidating Near High Well Above 50-Day Moving Average - 9/14/2022 |
View all notes |
Set NEW NOTE alert |
Company Profile |
SEC
News |
Chart |
Request a new note
C
A
S
I |
ENPH
-
NASDAQ
Enphase Energy Inc
Energy-Solar
|
$316.23
|
-1.78
-0.56% |
$319.65
|
3,010,449
82.05% of 50 DAV
50 DAV is 3,669,000
|
$324.84
-2.65%
|
7/28/2022
|
$276.66
|
PP = $282.55
|
|
MB = $296.68
|
Most Recent Note - 9/16/2022 6:42:10 PM
G - Hovering near its all-time high holding its ground after a volume-driven breakout gain on 9/07/22 following a brief consolidation. Recent lows in the $271-272 coincide with its 50 DMA line ($271.52) defining important near-term support. Fundamentals remain strong.
>>> FEATURED STOCK ARTICLE : High-Ranked Solar Energy Firm Hovering Near All-Time High - 9/13/2022 |
View all notes |
Set NEW NOTE alert |
Company Profile |
SEC
News |
Chart |
Request a new note
C
A
S
I |
Symbol/Exchange
Company Name
Industry Group |
PRICE |
CHANGE
(%Change) |
Day High |
Volume
(% DAV)
(% 50 day avg vol) |
52 Wk Hi
% From Hi |
Featured
Date |
Price
Featured |
Pivot Featured |
|
Max Buy |
PWR
-
NYSE
Quanta Services Inc
MATERIALS and CONSTRUCTION - General Contractors
|
$141.28
|
+3.86
2.81% |
$142.15
|
1,753,558
161.92% of 50 DAV
50 DAV is 1,083,000
|
$149.33
-5.39%
|
7/28/2022
|
$141.83
|
PP = $140.14
|
|
MB = $147.15
|
Most Recent Note - 9/19/2022 5:57:45 PM
Y - Color code is changed to yellow after rebounding above its 50 DMA line ($138.63) with a volume-driven gain helping its outlook improve. Fundamentals remain strong.
>>> FEATURED STOCK ARTICLE : Consolidating Near Prior Highs and Above 50-Day Moving Average - 9/7/2022 |
View all notes |
Set NEW NOTE alert |
Company Profile |
SEC
News |
Chart |
Request a new note
C
A
S
I |
GFF
-
NYSE
Griffon Corporation
MATERIALS and CONSTRUCTION - General Building Materials
|
$32.57
|
+0.82
2.58% |
$32.72
|
294,652
78.57% of 50 DAV
50 DAV is 375,000
|
$34.92
-6.73%
|
8/8/2022
|
$32.46
|
PP = $31.12
|
|
MB = $32.68
|
Most Recent Note - 9/19/2022 5:54:25 PM
Y - Consolidating above its 50 DMA line ($30.78) and prior low in the $30 area which define important near-term support.
>>> FEATURED STOCK ARTICLE : Griffon Near All-Time High Making Limited Progress - 9/15/2022 |
View all notes |
Set NEW NOTE alert |
Company Profile |
SEC
News |
Chart |
Request a new note
C
A
S
I |
CLH
-
NYSE
Clean Harbors Inc
Pollution Control
|
$118.09
|
+2.10
1.81% |
$118.12
|
328,575
93.88% of 50 DAV
50 DAV is 350,000
|
$124.49
-5.14%
|
8/10/2022
|
$111.78
|
PP = $115.10
|
|
MB = $120.86
|
Most Recent Note - 9/19/2022 5:51:59 PM
Y - Color code is changed to yellow after consolidating below its "max buy" level and recently testing the prior high in the $115 area noted as important near-term support to watch. More damaging losses would raise concerns. Fundamentals remain strong. See the latest FSU analysis for more details and a new annotated graph.
>>> FEATURED STOCK ARTICLE : Tested Support Near Prior High in the $115 Area - 9/19/2022 |
View all notes |
Set NEW NOTE alert |
Company Profile |
SEC
News |
Chart |
Request a new note
C
A
S
I |
CASY
-
NASDAQ
Caseys General Stores
RETAIL - Super/Mini Markets
|
$216.42
|
+1.52
0.71% |
$216.60
|
179,398
71.19% of 50 DAV
50 DAV is 252,000
|
$223.90
-3.34%
|
9/8/2022
|
$217.81
|
PP = $222.40
|
|
MB = $233.52
|
Most Recent Note - 9/16/2022 6:38:32 PM
Y - Stubbornly holding its ground. Failed to close above the pivot point and clinch a proper technical buy signal since Featured on 9/08/22. Fundamentals remain strong.
>>> FEATURED STOCK ARTICLE : Casey's is Perched Within Close Range of All-Time High - 9/9/2022 |
View all notes |
Set NEW NOTE alert |
Company Profile |
SEC
News |
Chart |
Request a new note
C
A
S
I |
CPRX
-
NASDAQ
Catalyst Pharma Inc
Medical-Biomed/Biotech
|
$12.97
|
-0.44
-3.28% |
$13.20
|
4,029,725
111.63% of 50 DAV
50 DAV is 3,610,000
|
$17.22
-24.68%
|
9/8/2022
|
$15.14
|
PP = $15.17
|
|
MB = $15.93
|
Most Recent Note - 9/19/2022 5:53:31 PM
G - Abruptly retreated from its high with 3 consecutive losses, quickly erasing recent gains and slumping back below the pivot point raising concerns. Its 50 DMA line ($12.19) defines near-term support to watch. Highlighted in yellow with pivot point cited based on its 8/23/22 high plus 10 cents in the 9/08/22 mid-day report. Reported Jun '22 quarterly earnings +75% on +46% sales revenues versus the year ago period, its 3rd consecutive quarterly comparison above the +25% minimum earnings guideline (C criteria). Annual earnings (A criteria) growth has been strong since turning profitable in FY '19.
>>> FEATURED STOCK ARTICLE : Hit a New High After a 4-Week Tight Pattern of Closes - 9/8/2022 |
View all notes |
Set NEW NOTE alert |
Company Profile |
SEC
News |
Chart |
Request a new note
C
A
S
I |
Symbol/Exchange
Company Name
Industry Group |
PRICE |
CHANGE
(%Change) |
Day High |
Volume
(% DAV)
(% 50 day avg vol) |
52 Wk Hi
% From Hi |
Featured
Date |
Price
Featured |
Pivot Featured |
|
Max Buy |
CCRN
-
NASDAQ
Cross Country Healthcare
DIVERSIFIED SERVICES - Staffing and Outsourcing Service
|
$29.60
|
-0.02
-0.07% |
$29.70
|
708,865
77.81% of 50 DAV
50 DAV is 911,000
|
$30.51
-2.98%
|
9/9/2022
|
$27.32
|
PP = $30.61
|
|
MB = $32.14
|
Most Recent Note - 9/16/2022 6:40:30 PM
Y - Posted a 3rd consecutive gain today while challenging prior highs in the $30 area. The market is in a correction (M criteria) and disciplined investors know to avoid new buying efforts until a new rally confirmed with a follow-through day. It has been consolidating above its 50 DMA line ($25.51) which defines important support to watch. Recently reported insider buying is a reassuring sign. Highlighted in yellow with pivot point cited based on its 7/21/22 high plus 10 cents in the 9/09/22 mid-day report and noted - "Subsequent gains above the pivot point backed by at least +40% above average volume may trigger a technical buy signal."
>>> FEATURED STOCK ARTICLE : Positive Reversal While Consolidating Above 50-Day Moving Average - 9/12/2022 |
View all notes |
Set NEW NOTE alert |
Company Profile |
SEC
News |
Chart |
Request a new note
C
A
S
I |
|
|
|
THESE ARE NOT BUY RECOMMENDATIONS!
Comments contained in the body of this report are technical
opinions only. The material herein has been obtained
from sources believed to be reliable and accurate, however,
its accuracy and completeness cannot be guaranteed.
This site is not an investment advisor, hence it does
not endorse or recommend any securities or other investments.
Any recommendation contained in this report may not
be suitable for all investors and it is not to be deemed
an offer or solicitation on our part with respect to
the purchase or sale of any securities. All trademarks,
service marks and trade names appearing in this report
are the property of their respective owners, and are
likewise used for identification purposes only.
This report is a service available
only to active Paid Premium Members.
You may opt-out of receiving report notifications
at any time. Questions or comments may be submitted
by writing to Premium Membership Services 665 S.E. 10 Street, Suite 201 Deerfield Beach, FL 33441-5634 or by calling 1-800-965-8307
or 954-785-1121.
|
|
|