You are not logged in.
This means you
CAN ONLY VIEW reports that were published prior to Sunday, February 25, 2024.
You
MUST UPGRADE YOUR MEMBERSHIP if you want to see any current reports.
AFTER MARKET UPDATE - THURSDAY, SEPTEMBER 19TH, 2019
Previous After Market Report Next After Market Report >>>
|
|
|
|
DOW |
-52.29 |
27,094.79 |
-0.19% |
|
Volume |
814,846,730 |
-7% |
|
Volume |
1,795,043,011 |
-12% |
|
NASDAQ |
+5.49 |
8,182.88 |
+0.07% |
|
Advancers |
1,498 |
53% |
|
Advancers |
1,410 |
46% |
|
S&P 500 |
+0.06 |
3,006.79 |
+0.00% |
|
Decliners |
1,348 |
47% |
|
Decliners |
1,670 |
54% |
|
Russell 2000 |
-6.87 |
1,561.47 |
-0.44% |
|
52 Wk Highs |
107 |
|
|
52 Wk Highs |
84 |
|
|
S&P 600 |
-5.00 |
965.34 |
-0.52% |
|
52 Wk Lows |
7 |
|
|
52 Wk Lows |
40 |
|
|
 |
Major Indices Were Indecisive on Mixed Session
Kenneth J. Gruneisen - Passed the CAN SLIM® Master's Exam
The Dow slipped 52 points while the S&P 500 was unchanged. The Nasdaq Composite gained 0.1%. The volume totals reported were lighter than the prior session on the NYSE and on the Nasdaq exchange. Decliners led advancers by an 8-7 margin on the Nasdaq exchange while advancers led decliners by about the same margin on the NYSE. There were 46 high-ranked companies from the Leaders List hit new 52-week highs and were listed on the BreakOuts Page, versus the total of 28 on the prior session. New 52-week highs totals expanded and outnumbered new 52-week lows totals on the NYSE and on the Nasdaq exchange. Concerning the M criteria of the fact-based investment system, investors have a green light to make carefully selected new buying efforts. The Featured Stocks Page provides the most timely analysis on high-ranked leaders. Charts used courtesy of www.stockcharts.com
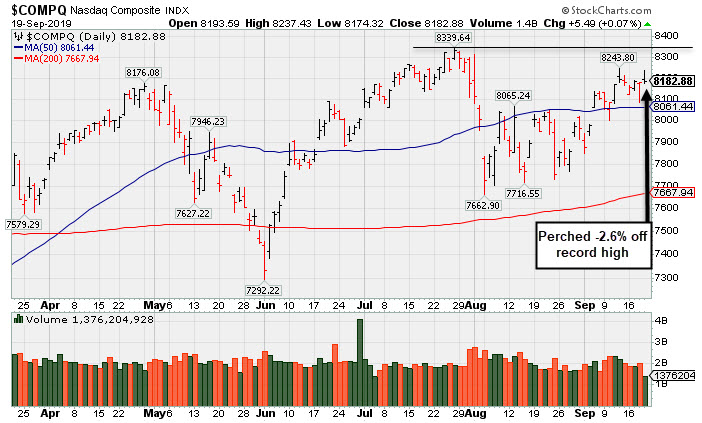
PICTURED: The Nasdaq Composite Index is perched -2.6% off its record high.
U.S. stocks finished mixed Thursday as investors awaited further trade updates. Trade headlines were in focus throughout the session as U.S. and Chinese negotiators are set to begin in-person talks for the first time in two months shortly after the closing bell.
On the economic front, an update showed the leading economic index was flat in August, versus projections of negative 0.1% and July’s 0.5% jump. Separately, initial jobless claims came in at 208,000 in the prior week, below consensus estimates of 213,000. A survey on the housing market revealed existing home-sales climbed 1.3% month-over-month in August, above projections of a 0.7% drop. Treasuries were mixed with the yield on the benchmark 10-year note finishing unchanged at 1.79%.
There was very little sector dispersion today with Health shares the top performer. Technology stocks also posted solid gains as Microsoft (MSFT +1.84%) rose after the software provider announced a new $40 billion share repurchase program. Industrials underperformed as the group slipped roughly 0.5% due to weakness in transportation companies. In other corporate news, Costco (COST -1.57%) fell following an analyst downgrade of the membership warehouse store. Shares of Darden Restaurants (DRI -5.07%) fell after the restaurant chain operator’s revenue figures and same-store sales comps came in below Wall Street projections.
In commodities, WTI crude added 0.5% to $58.41/barrel. COMEX gold slipped 0.7% to $1,499.00/ounce despite a weaker dollar.
|
 Kenneth J. Gruneisen started out as a licensed stockbroker in August 1987, a couple of months prior to the historic stock market crash that took the Dow Jones Industrial Average down -22.6% in a single day. He has published daily fact-based fundamental and technical analysis on high-ranked stocks online for two decades. Through FACTBASEDINVESTING.COM, Kenneth provides educational articles, news, market commentary, and other information regarding proven investment systems that work in good times and bad.
Comments contained in the body of this report are technical opinions only and are not necessarily those of Gruneisen Growth Corp. The material herein has been obtained from sources believed to be reliable and accurate, however, its accuracy and completeness cannot be guaranteed. Our firm, employees, and customers may effect transactions, including transactions contrary to any recommendation herein, or have positions in the securities mentioned herein or options with respect thereto. Any recommendation contained in this report may not be suitable for all investors and it is not to be deemed an offer or solicitation on our part with respect to the purchase or sale of any securities. |
|
 |
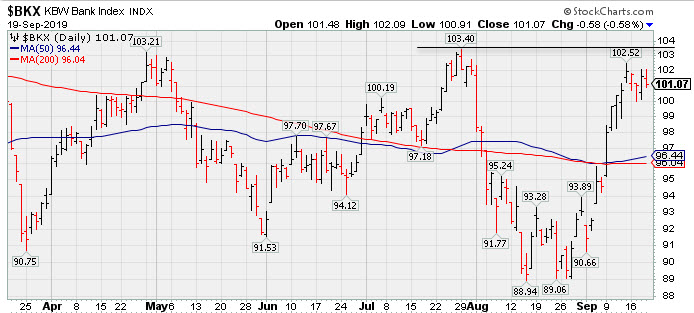
Gold & Silver Index Posts Standout Gain
Kenneth J. Gruneisen - Passed the CAN SLIM® Master's Exam
The Bank Index ($BKX -0.58%) and the Broker/Dealer Index ($XBD -0.42%) edged lower and the Retail Index ($RLX -0.14%) suffered a smaller loss. The tech sector was led lower by modest losses for the Networking Index ($NWX -0.69%) and the Semiconductor Index ($SOX -0.55%) while the Biotech Index ($BTK +0.04%) finished the session flat. Commodity-linked groups were mixed as the Oil Services Index ($OSX -1.01%) and Integrated Oil Index ($XOI -0.30%) each fell, meanwhile, the Gold & Silver Index ($XAU +1.94%) notched a solid gain.
PICTURED: The Bank Index ($BKX -0.58%) has been consolidating after rebounding near the prior highs. Its stance improved with the recent rally above the 50-day and 200-day moving average (DMA) lines also helping the broader market outlook.
| Oil Services |
$OSX |
72.68 |
-0.75 |
-1.02% |
-9.83% |
| Integrated Oil |
$XOI |
1,242.10 |
-3.76 |
-0.30% |
+7.16% |
| Semiconductor |
$SOX |
1,592.07 |
-8.88 |
-0.55% |
+37.82% |
| Networking |
$NWX |
559.59 |
-3.87 |
-0.69% |
+14.51% |
| Broker/Dealer |
$XBD |
274.81 |
-1.17 |
-0.42% |
+15.79% |
| Retail |
$RLX |
2,399.83 |
-3.29 |
-0.14% |
+22.98% |
| Gold & Silver |
$XAU |
92.99 |
+1.76 |
+1.93% |
+31.60% |
| Bank |
$BKX |
101.07 |
-0.59 |
-0.58% |
+17.81% |
| Biotech |
$BTK |
4,455.25 |
+1.61 |
+0.04% |
+5.55% |
|
|
|
 |
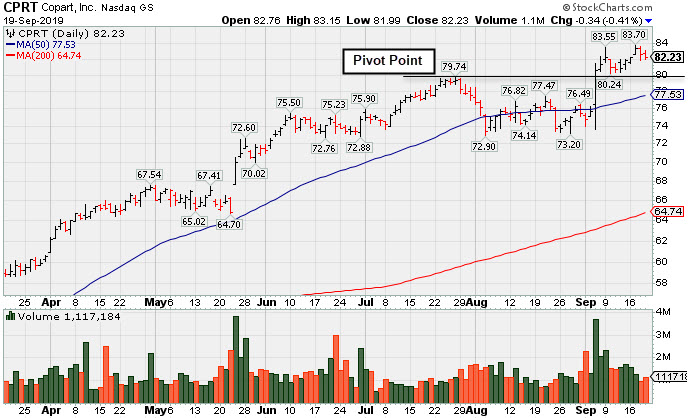
Hovering Near All-Time High Following Recent Breakout
Kenneth J. Gruneisen - Passed the CAN SLIM® Master's Exam
Copart Inc (CPRT -$0.34 or -0.41% to $82.23) is below its "max buy" level yet perched very near its all-time high. It held its ground stubbornly after the big volume-driven gain above the pivot point on 9/05/19 clinched a technical buy signal.
Bullish action came after it reported earnings +43% on +21% sales revenues for the Jul '19 quarter. Three of the past 4 quarterly earnings increases were above the +25% minimum guideline (C criteria) and its sales revenues growth rate has accelerated. Annual earnings (A criteria) history has been strong and steady since a downturn in FY '13.
The number of top-rated funds owning its shares rose from 1,120 in Sep '18 to 1,275 in Jun '19, a reassuring sign concerning the I criteria. It has a Timeliness Rating of A and Sponsorship Rating of B.
|
|
|
Color Codes Explained :
Y - Better candidates highlighted by our
staff of experts.
G - Previously featured
in past reports as yellow but may no longer be buyable under the
guidelines.
***Last / Change / Volume data in this table is the closing quote data***
Symbol/Exchange
Company Name
Industry Group |
PRICE |
CHANGE
(%Change) |
Day High |
Volume
(% DAV)
(% 50 day avg vol) |
52 Wk Hi
% From Hi |
Featured
Date |
Price
Featured |
Pivot Featured |
|
Max Buy |
 CCBG
-
NASDAQ
CCBG
-
NASDAQ
Capital City Bk Gp
BANKING - Regional - Mid-Atlantic Banks
|
$26.49
|
-0.15
-0.56% |
$27.19
|
23,891
113.77% of 50 DAV
50 DAV is 21,000
|
$27.24
-2.75%
|
9/13/2019
|
$27.03
|
PP = $27.05
|
|
MB = $28.40
|
Most Recent Note - 9/18/2019 6:05:59 PM
Y - Managed a "positive reversal" today and it remains perched near its 52-week high. Subsequent volume-driven gains above the pivot point may trigger a technical buy signal.
>>> FEATURED STOCK ARTICLE : Thinly Traded Bank Rallied To Multi-Year Highs - 9/13/2019 |
View all notes |
Set NEW NOTE alert |
Company Profile |
SEC
News |
Chart |
Request a new note
C
A
S
I |
EPAM
-
NYSE
Epam Systems Inc
COMPUTER SOFTWARE and SERVICES - Information Technology Service
|
$185.24
|
+0.68
0.37% |
$187.46
|
219,346
57.87% of 50 DAV
50 DAV is 379,000
|
$201.00
-7.84%
|
5/9/2019
|
$169.25
|
PP = $180.55
|
|
MB = $189.58
|
Most Recent Note - 9/16/2019 5:56:58 PM
G - Halted its slide above the prior low ($175.33 on 8/07/19) which defines the next important support level. A rebound above its 50 DMA line ($190) is needed for its outlook to improve. Reported earnings +27% on +24% sales revenues for the Jun '19 quarter. See the latest FSU analysis for more details and a new annotated graph.
>>> FEATURED STOCK ARTICLE : Recent Slump Below 50-Day Average Hurt Outlook - 9/16/2019 |
View all notes |
Set NEW NOTE alert |
Company Profile |
SEC
News |
Chart |
Request a new note
C
A
S
I |
AUDC
-
NASDAQ
Audiocodes Ltd
ELECTRONICS - Scientific and Technical Instrum
|
$20.80
|
-0.38
-1.79% |
$21.66
|
372,573
183.53% of 50 DAV
50 DAV is 203,000
|
$21.51
-3.30%
|
9/13/2019
|
$19.68
|
PP = $19.84
|
|
MB = $20.83
|
 Most Recent Note - 9/19/2019 12:45:53 PM
G - Rallied further above its "max buy" level and hit another new all-time high today after 6 consecutive gains marked by volume. Its 50 DMA line ($17.93) defines important support.
>>> FEATURED STOCK ARTICLE : Recent Spurt of Gains for New Highs Marked By Volume - 9/17/2019 |
View all notes |
Set NEW NOTE alert |
Company Profile |
SEC
News |
Chart |
Request a new note
C
A
S
I |
LHCG
-
NASDAQ
L H C Group Inc
HEALTH SERVICES - Home Health Care
|
$118.06
|
-0.23
-0.19% |
$119.62
|
199,416
93.19% of 50 DAV
50 DAV is 214,000
|
$129.37
-8.74%
|
7/1/2019
|
$110.94
|
PP = $122.20
|
|
MB = $128.31
|
Most Recent Note - 9/18/2019 6:01:53 PM
G - A rebound above its 50 DMA line ($121.11) is needed to help its outlook, however it has recently acted as resistance. The recent low ($115.06 9/10/19) defines near-term support above its 200 DMA line ($111.74).
>>> FEATURED STOCK ARTICLE : 50-Day Moving Average Recently Acted as Resistance - 9/12/2019 |
View all notes |
Set NEW NOTE alert |
Company Profile |
SEC
News |
Chart |
Request a new note
C
A
S
I |
CHDN
-
NASDAQ
Churchill Downs Inc
LEISURE - Gaming Activities
|
$123.72
|
-0.38
-0.31% |
$126.00
|
152,274
68.59% of 50 DAV
50 DAV is 222,000
|
$132.73
-6.79%
|
7/22/2019
|
$118.45
|
PP = $118.89
|
|
MB = $124.83
|
Most Recent Note - 9/16/2019 5:53:56 PM
Y - Volume has been cooling while consolidating above its 50 DMA line ($120.45). Below that important short-term average, the prior low ($113.88 on 8/05/19) defines the next support level. Jun '19 earnings +10% on +26% sales revenues versus the year ago period were below the +25% minimum earnings guideline (C criteria), noted recently raising fundamental concerns.
>>> FEATURED STOCK ARTICLE : Found Support After Making Limited Progress - 9/4/2019 |
View all notes |
Set NEW NOTE alert |
Company Profile |
SEC
News |
Chart |
Request a new note
C
A
S
I |
Symbol/Exchange
Company Name
Industry Group |
PRICE |
CHANGE
(%Change) |
Day High |
Volume
(% DAV)
(% 50 day avg vol) |
52 Wk Hi
% From Hi |
Featured
Date |
Price
Featured |
Pivot Featured |
|
Max Buy |
LULU
-
NASDAQ
Lululemon Athletica
MANUFACTURING - Textile Manufacturing
|
$193.61
|
-1.75
-0.90% |
$196.06
|
1,318,936
75.63% of 50 DAV
50 DAV is 1,744,000
|
$204.44
-5.30%
|
9/6/2019
|
$201.25
|
PP = $194.35
|
|
MB = $204.07
|
Most Recent Note - 9/18/2019 5:58:26 PM
Y - Quietly consolidating near its prior high after latest breakout. Reported earnings +35% on +22% sales revenues for the Jul '19 quarter. Prior high ($194.25) defines initial support to watch above its 50 DMA line ($186.41). See the latest FSU analysis for more details and a new annotated graph.
>>> FEATURED STOCK ARTICLE : Consolidating Near Prior High Following Latest Breakout - 9/18/2019 |
View all notes |
Set NEW NOTE alert |
Company Profile |
SEC
News |
Chart |
Request a new note
C
A
S
I |
CPRT
-
NASDAQ
Copart Inc
SPECIALTY RETAIL - Auto Dealerships
|
$82.23
|
-0.34
-0.41% |
$83.15
|
1,117,247
87.15% of 50 DAV
50 DAV is 1,282,000
|
$83.70
-1.76%
|
9/5/2019
|
$79.13
|
PP = $79.84
|
|
MB = $83.83
|
Most Recent Note - 9/19/2019 5:13:08 PM
Y - Quietly perched near its all-time high. Held its ground after the big volume-driven gain above the pivot point on 9/05/19 clinched a technical buy signal. Fundamentals are strong. See the latest FSU analysis for more details and a new annotated graph.
>>> FEATURED STOCK ARTICLE : Hovering Near All-Time High Following Recent Breakout - 9/19/2019 |
View all notes |
Set NEW NOTE alert |
Company Profile |
SEC
News |
Chart |
Request a new note
C
A
S
I |
BLD
-
NYSE
Topbuild Corp
Bldg-Constr Prds/Misc
|
$95.59
|
+0.03
0.03% |
$96.63
|
199,924
69.66% of 50 DAV
50 DAV is 287,000
|
$96.22
-0.65%
|
5/17/2019
|
$82.19
|
PP = $87.31
|
|
MB = $91.68
|
Most Recent Note - 9/18/2019 6:04:53 PM
G - Posted a 4th consecutive gain today and hit a new all-time high. Earnings rose +39% on +9% sales revenues for the Jun '19 quarter versus the year ago period. Its 50 DMA line ($87.95) defines important support to watch along with its prior low ($86.53 on 8/28/19).
>>> FEATURED STOCK ARTICLE : Holding Ground Stubbornly in Tight Range Near Record High - 9/10/2019 |
View all notes |
Set NEW NOTE alert |
Company Profile |
SEC
News |
Chart |
Request a new note
C
A
S
I |
PAGS
-
NYSE
Pagseguro Digital Cl A
Finance-CrdtCard/PmtPr
|
$48.55
|
+1.20
2.53% |
$49.49
|
1,212,862
56.31% of 50 DAV
50 DAV is 2,154,000
|
$53.43
-9.13%
|
6/25/2019
|
$37.69
|
PP = $40.07
|
|
MB = $42.07
|
Most Recent Note - 9/19/2019 5:15:08 PM
G - Posted another gain today on lighter than average volume as it rebounded further above its 50 DMA line ($47.26) helping its outlook to improve. Halted its slide above the prior low ($42.00 on 8/05/19) which defines the next important chart support level. Fundamentals are strong.
>>> FEATURED STOCK ARTICLE : 50-Day Moving Average Violation Triggered Technical Sell Signal - 9/11/2019 |
View all notes |
Set NEW NOTE alert |
Company Profile |
SEC
News |
Chart |
Request a new note
C
A
S
I |
|
|
|
THESE ARE NOT BUY RECOMMENDATIONS!
Comments contained in the body of this report are technical
opinions only. The material herein has been obtained
from sources believed to be reliable and accurate, however,
its accuracy and completeness cannot be guaranteed.
This site is not an investment advisor, hence it does
not endorse or recommend any securities or other investments.
Any recommendation contained in this report may not
be suitable for all investors and it is not to be deemed
an offer or solicitation on our part with respect to
the purchase or sale of any securities. All trademarks,
service marks and trade names appearing in this report
are the property of their respective owners, and are
likewise used for identification purposes only.
This report is a service available
only to active Paid Premium Members.
You may opt-out of receiving report notifications
at any time. Questions or comments may be submitted
by writing to Premium Membership Services 665 S.E. 10 Street, Suite 201 Deerfield Beach, FL 33441-5634 or by calling 1-800-965-8307
or 954-785-1121.
|
|
|