You are not logged in.
This means you
CAN ONLY VIEW reports that were published prior to Sunday, February 25, 2024.
You
MUST UPGRADE YOUR MEMBERSHIP if you want to see any current reports.
AFTER MARKET UPDATE - THURSDAY, SEPTEMBER 17TH, 2020
Previous After Market Report Next After Market Report >>>
|
|
|
|
DOW |
-130.40 |
27,901.98 |
-0.47% |
|
Volume |
1,062,358,504 |
-3% |
|
Volume |
3,710,104,100 |
+2% |
|
NASDAQ |
-140.19 |
10,910.28 |
-1.27% |
|
Advancers |
1,148 |
39% |
|
Advancers |
1,418 |
45% |
|
S&P 500 |
-28.48 |
3,357.01 |
-0.84% |
|
Decliners |
1,796 |
61% |
|
Decliners |
1,742 |
55% |
|
Russell 2000 |
-9.73 |
1,542.60 |
-0.63% |
|
52 Wk Highs |
46 |
|
|
52 Wk Highs |
55 |
|
|
S&P 600 |
-6.92 |
875.86 |
-0.78% |
|
52 Wk Lows |
11 |
|
|
52 Wk Lows |
19 |
|
|
 |
Leadership Wanes, Major Indices Sputter, and Nasdaq Leads Retreat
Kenneth J. Gruneisen - Passed the CAN SLIM® Master's Exam
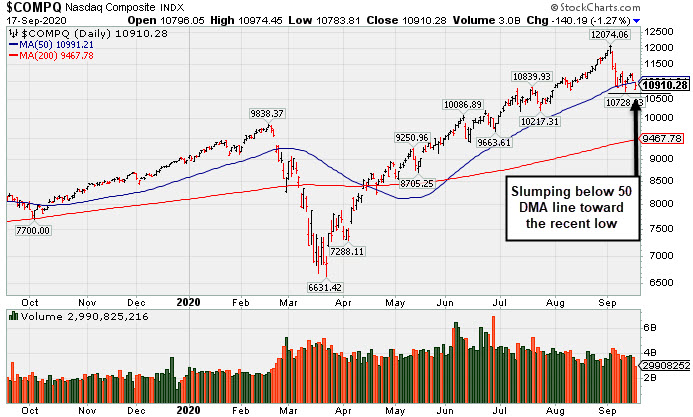
The Dow lost 130 points, while the S&P 500 fell 0.8%. The Nasdaq Composite declined 1.3%. The reported volume totals were mixed, lighter than the prior session total on the NYSE and higher on the Nasdaq exchange. Breadth was negative as decliners led advancers by a 3-2 margin on the NYSE and 6-5 on the Nasdaq exchange. Leadership contracted as only 7 high-ranked companies from the Leaders List hit new 52-week highs and were listed on the BreakOuts Page, versus the total of 31 on the prior session. New 52-week highs totals contracted yet still outnumbered new 52-week lows on the NYSE and on the Nasdaq exchange. The major indices have seen their uptrend recently come under pressure (M criteria). Any sustainable rally requires a healthy crop of new leaders, so improvement in the new highs totals in the near term may be considered critical.
PICTURED: The Nasdaq Composite Index slumped below its 50-day moving average (DMA) line toward the recent low.
Stocks finished lower Thursday, as investors weighed central bank updates and economic data reports. Yesterday, the Federal Reserve signaled an intent to keep rates in the near zero-bound range until at least 2023 and reiterated plans to utilize its full range of tools to support the economic recovery. However, the recent weakness has been attributed to a lack of updated guidance from the Fed and concerns of a peak in monetary stimulus.
On the data front, initial jobless claims declined modestly to 860,000 in the most recent week from the prior upwardly revised 893,000 reading. Meanwhile, housing starts dropped 5.1% in August, falling more than the 0.6% decline expected and last month’s downwardly revised 17.9% increase. Building permits posted a surprise 0.9% decrease in the same period. Treasuries are strengthening, with the yield on the benchmark 10-year note flat at 0.69%. In commodities WTI crude gained 2.2% to $41.08/barrel, while gold dipped 0.8% to $1946.10/ounce.
Eight of 11 S&P 500 sectors ended the day in negative territory, with the Real Estate group leading the declines. Tech and Tech-related companies were also pressured, with Facebook (FB -3.30%) and Amazon (AMZN -2.25%) slumping. In corporate news, shares of Carnival Corporation (CCL -1.34%) fell after extending cruise cancellations until the end of January 2021. Dave and Buster’s (PLAY -26.13%) tumbled after warning of bankruptcy if a deal cannot be made with lenders. |
 Kenneth J. Gruneisen started out as a licensed stockbroker in August 1987, a couple of months prior to the historic stock market crash that took the Dow Jones Industrial Average down -22.6% in a single day. He has published daily fact-based fundamental and technical analysis on high-ranked stocks online for two decades. Through FACTBASEDINVESTING.COM, Kenneth provides educational articles, news, market commentary, and other information regarding proven investment systems that work in good times and bad.
Comments contained in the body of this report are technical opinions only and are not necessarily those of Gruneisen Growth Corp. The material herein has been obtained from sources believed to be reliable and accurate, however, its accuracy and completeness cannot be guaranteed. Our firm, employees, and customers may effect transactions, including transactions contrary to any recommendation herein, or have positions in the securities mentioned herein or options with respect thereto. Any recommendation contained in this report may not be suitable for all investors and it is not to be deemed an offer or solicitation on our part with respect to the purchase or sale of any securities. |
|
 |
Retail, Financial, and Gold & Silver Indexes Lost Ground
Kenneth J. Gruneisen - Passed the CAN SLIM® Master's Exam
| Oil Services |
$OSX |
34.49 |
-0.21 |
-0.62% |
-55.95% |
| Integrated Oil |
$XOI |
678.70 |
+1.74 |
+0.26% |
-46.58% |
| Semiconductor |
$SOX |
2,194.15 |
-1.39 |
-0.06% |
+18.63% |
| Networking |
$NWX |
543.67 |
-1.99 |
-0.36% |
-6.78% |
| Broker/Dealer |
$XBD |
284.80 |
-2.17 |
-0.76% |
-1.92% |
| Retail |
$RLX |
3,315.38 |
-57.85 |
-1.71% |
+35.36% |
| Gold & Silver |
$XAU |
154.06 |
-2.00 |
-1.28% |
+44.09% |
| Bank |
$BKX |
76.67 |
-0.76 |
-0.98% |
-32.37% |
| Biotech |
$BTK |
5,381.56 |
-9.67 |
-0.18% |
+6.20% |
|
|
|
 |
Slumped Below 50-Day Average With Loss on Light Volume
Kenneth J. Gruneisen - Passed the CAN SLIM® Master's Exam
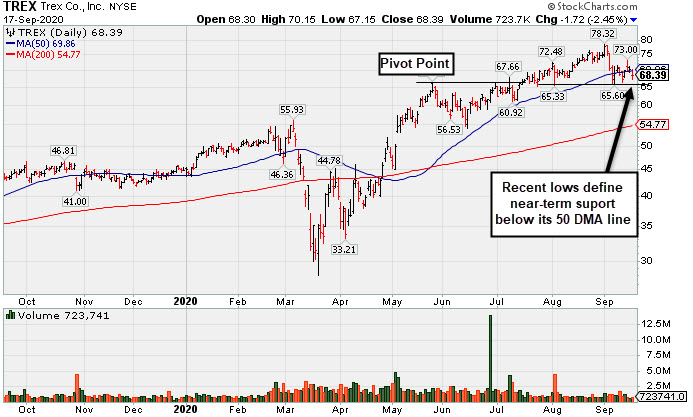
Trex Company Inc (TREX -$1.72 or -2.45% to $68.39) slumped to close below its 50-day moving average (DMA) line ($69.86) with today's loss on light volume. The recent lows in the $65 area define the next important support level to watch. Only a prompt rebound above the 50 DMA line might help its outlook improve. Do not be confused by the 2:1 share split effective 9/15/20 (Featured Price, Pivot Point, and Max Buy prices have been adjusted accordingly).
Fundamentals remain strong. Recently it reported Jun '20 quarterly earnings +27% on +7% sales revenues versus the year ago period, its 4th consecutive quarterly comparison above the +25% minimum earnings guideline (C criteria). It has shown resilience since last appearing in this FSU section on 9/04/20 with an annotated graph under the headline, "Fall Below "Max Buy" Level Also Undercut 50-Day Moving Average". It has earned the highest possible 99 Earnings Per Share Rating. Annual earnings (A criteria) growth has been strong. The company hails from the General Building Materials industry group which currently has a Group Relative Strength Rating of A+
The company has a new CEO as of 4/29/20. After a 2:1 share split effective 9/15/20 it now has a supply (S criteria) of 115.8 million shares outstanding. The number of top-rated funds owning its shares rose from 540 in Jun '19 to 719 in Jun '20, a reassuring sign concerning the I criteria. Its current Up/Down Volume Ratio of 1.2 is an unbiased indication its shares have been under accumulation over the past 50 days. It has a Timeliness rating of A and a Sponsorship Rating of C.
|
|
|
Color Codes Explained :
Y - Better candidates highlighted by our
staff of experts.
G - Previously featured
in past reports as yellow but may no longer be buyable under the
guidelines.
***Last / Change / Volume data in this table is the closing quote data***
Symbol/Exchange
Company Name
Industry Group |
PRICE |
CHANGE
(%Change) |
Day High |
Volume
(% DAV)
(% 50 day avg vol) |
52 Wk Hi
% From Hi |
Featured
Date |
Price
Featured |
Pivot Featured |
|
Max Buy |
 ADBE
-
NASDAQ
ADBE
-
NASDAQ
Adobe Inc
COMPUTER SOFTWARE and SERVICES - Application Software
|
$474.30
|
-1.70
-0.36% |
$475.17
|
4,548,835
152.95% of 50 DAV
50 DAV is 2,974,000
|
$536.88
-11.66%
|
9/10/2020
|
$488.46
|
PP = $536.88
|
|
MB = $563.72
|
 Most Recent Note - 9/17/2020 12:00:38 PM
Y - Undercut its prior low ($461.18 on 9/08/20) and its 50 DMA line ($464.18) with today's early weakness raising concerns following a "negative reversal" on the prior session with a big loss on heavy volume. Encountered distributional pressure and had a "negative reversal on 9/10/20. Since finding support at its 10 week-moving average (WMA), a valid secondary buy point exists up to 5% above the latest high. Subsequent losses violating its 50 DMA line and prior low may trigger technical sell signals. Disciplined investors always limit losses by selling any stock that falls more than 7-8% from their purchase price. Reported Aug '20 quarterly earnings +25% on +14% sales revenues versus the year ago period. Volume and volatility often increase near earnings news. This well-known Computer Software - Desktop firm has produced 4 consecutive quarterly earnings increases above the +25% minimum guideline (C criteria). Annual earnings history (A criteria) has been strong and steady.
>>> FEATURED STOCK ARTICLE : Adobe Found Support Following Recent Breakout - 9/10/2020 |
View all notes |
Set NEW NOTE alert |
Company Profile |
SEC
News |
Chart |
Request a new note
C
A
S
I |
CRL
-
NYSE
Charles River Labs Intl
DRUGS - Biotechnology
|
$218.15
|
-3.83
-1.73% |
$221.17
|
459,091
140.83% of 50 DAV
50 DAV is 326,000
|
$228.86
-4.68%
|
7/15/2020
|
$192.66
|
PP = $189.95
|
|
MB = $199.45
|
Most Recent Note - 9/17/2020 12:07:29 PM
G - Slumping for a 2nd consecutive loss after hitting a new all-time high, falling back below prior highs in the $221 area. Found prompt support at its 50 DMA line ($208.25) after volume-driven losses. More damaging losses would raise greater concerns and trigger a technical sell signal. Recently reported Jun '20 quarterly earnings -3% on +4% sales revenues, below the +25% minimum guideline (C criteria), but better than expected while the company also raised its guidance.
>>> FEATURED STOCK ARTICLE : Found Prompt Support at 50-Day Moving Average Line - 9/11/2020 |
View all notes |
Set NEW NOTE alert |
Company Profile |
SEC
News |
Chart |
Request a new note
C
A
S
I |
AMD
-
NASDAQ
Advanced Micro Devices
ELECTRONICS - Semiconductor - Broad Line
|
$76.55
|
-0.11
-0.14% |
$76.63
|
55,466,629
84.31% of 50 DAV
50 DAV is 65,786,000
|
$94.28
-18.81%
|
8/31/2020
|
$90.42
|
PP = $87.39
|
|
MB = $91.76
|
Most Recent Note - 9/16/2020 6:21:36 PM
Y - Pulled back today with lighter volume while slumping toward its 50 DMA line ($75.24). More damaging losses leading to a 50 DMA line violation may trigger a worrisome technical sell signal. Fundamentals remain strong. See the latest FSU analysis for more details and an annotated graph.
>>> FEATURED STOCK ARTICLE : Found Support Above 50 DMA Line After Negating Recent Breakout - 9/15/2020 |
View all notes |
Set NEW NOTE alert |
Company Profile |
SEC
News |
Chart |
Request a new note
C
A
S
I |
TREX
-
NYSE
Trex Company Inc
MATERIALS and CONSTRUCTION - General Building Materials
|
$68.39
|
-1.72
-2.45% |
$70.15
|
723,824
60.83% of 50 DAV
50 DAV is 1,190,000
|
$78.32
-12.68%
|
6/26/2020
|
$54.53
|
PP = $66.47
|
|
MB = $69.79
|
Most Recent Note - 9/17/2020 4:53:10 PM
G - Slumped below its 50 DMA line ($69.86) with today's loss on light volume. The recent low ($65.60 on 9/08/20) defines the next important support level to watch. Do not be confused by the 2:1 share split effective 9/15/20 (Featured Price, Pivot Point, and Max Buy prices have been adjusted accordingly). Fundamentals remain strong. See the latest FSU analysis for more details and a new annotated graph.
>>> FEATURED STOCK ARTICLE : Slumped Below 50-Day Average With Loss on Light Volume - 9/17/2020 |
View all notes |
Set NEW NOTE alert |
Company Profile |
SEC
News |
Chart |
Request a new note
C
A
S
I |
NFLX
-
NASDAQ
Netflix Inc
SPECIALTY RETAIL - Music and Video Stores
|
$470.20
|
-13.66
-2.82% |
$478.40
|
5,314,798
67.70% of 50 DAV
50 DAV is 7,850,000
|
$575.37
-18.28%
|
9/1/2020
|
$547.45
|
PP = $575.47
|
|
MB = $604.24
|
Most Recent Note - 9/17/2020 4:57:47 PM
G - Slumped further below its 50 DMA line ($500.82) and intra-day it undercut the prior low ($466.55 on 8/11/20) raising more serious concerns and triggering a more worrisome technical sell signal. Subsequent gains back above the 50 DMA line are needed for its outlook to improve. See the latest FSU analysis for more details and an annotated graph.
>>> FEATURED STOCK ARTICLE : Met Resistance at 50 DMA Line and Reversed Today - 9/16/2020 |
View all notes |
Set NEW NOTE alert |
Company Profile |
SEC
News |
Chart |
Request a new note
C
A
S
I |
Symbol/Exchange
Company Name
Industry Group |
PRICE |
CHANGE
(%Change) |
Day High |
Volume
(% DAV)
(% 50 day avg vol) |
52 Wk Hi
% From Hi |
Featured
Date |
Price
Featured |
Pivot Featured |
|
Max Buy |
LGIH
-
NASDAQ
L G I Homes Inc
Bldg-Resident/Comml
|
$109.71
|
-6.18
-5.33% |
$113.70
|
318,803
102.18% of 50 DAV
50 DAV is 312,000
|
$123.94
-11.48%
|
7/7/2020
|
$99.19
|
PP = $95.82
|
|
MB = $100.61
|
Most Recent Note - 9/17/2020 4:55:10 PM
G - Slumped below its 50 DMA line ($112.33) with today's damaging loss on higher (near average) volume raising greater concerns and triggering a technical sell signal. Only a prompt rebound would help its outlook improve. Reported Jun '20 quarterly earnings +21% on +4% sales revenues, breaking a streak of 4 comparisons above the +25% minimum guideline (C criteria).
>>> FEATURED STOCK ARTICLE : Homebuilder Halted Slide Near Prior Low and 50-Day Average - 9/8/2020 |
View all notes |
Set NEW NOTE alert |
Company Profile |
SEC
News |
Chart |
Request a new note
C
A
S
I |
NOW
-
NYSE
Servicenow Inc
Computer Sftwr-Enterprse
|
$453.80
|
-2.21
-0.48% |
$455.00
|
1,475,737
86.60% of 50 DAV
50 DAV is 1,704,000
|
$501.82
-9.57%
|
8/20/2020
|
$453.34
|
PP = $454.79
|
|
MB = $477.53
|
Most Recent Note - 9/16/2020 6:16:01 PM
Y - Reversed into the red today and closed near the session low. Showed resilience recently after briefly undercutting the prior high ($454) and testing support at its 50 DMA line ($444). Fundamentals remain strong. More damaging losses may raise concerns and trigger a technical sell signal.
>>> FEATURED STOCK ARTICLE : Tested Support at 50-Day Moving Average Line - 9/14/2020 |
View all notes |
Set NEW NOTE alert |
Company Profile |
SEC
News |
Chart |
Request a new note
C
A
S
I |
|
|
|
THESE ARE NOT BUY RECOMMENDATIONS!
Comments contained in the body of this report are technical
opinions only. The material herein has been obtained
from sources believed to be reliable and accurate, however,
its accuracy and completeness cannot be guaranteed.
This site is not an investment advisor, hence it does
not endorse or recommend any securities or other investments.
Any recommendation contained in this report may not
be suitable for all investors and it is not to be deemed
an offer or solicitation on our part with respect to
the purchase or sale of any securities. All trademarks,
service marks and trade names appearing in this report
are the property of their respective owners, and are
likewise used for identification purposes only.
This report is a service available
only to active Paid Premium Members.
You may opt-out of receiving report notifications
at any time. Questions or comments may be submitted
by writing to Premium Membership Services 665 S.E. 10 Street, Suite 201 Deerfield Beach, FL 33441-5634 or by calling 1-800-965-8307
or 954-785-1121.
|
|
|