You are not logged in.
This means you
CAN ONLY VIEW reports that were published prior to Tuesday, February 20, 2024.
You
MUST UPGRADE YOUR MEMBERSHIP if you want to see any current reports.
AFTER MARKET UPDATE - WEDNESDAY, SEPTEMBER 16TH, 2020
Previous After Market Report Next After Market Report >>>
|
|
|
|
DOW |
+36.78 |
28,032.38 |
+0.13% |
|
Volume |
1,091,923,495 |
+29% |
|
Volume |
3,652,539,100 |
-3% |
|
NASDAQ |
-139.85 |
11,050.47 |
-1.25% |
|
Advancers |
1,802 |
61% |
|
Advancers |
1,965 |
60% |
|
S&P 500 |
-15.71 |
3,385.49 |
-0.46% |
|
Decliners |
1,132 |
39% |
|
Decliners |
1,310 |
40% |
|
Russell 2000 |
+14.17 |
1,552.33 |
+0.92% |
|
52 Wk Highs |
89 |
|
|
52 Wk Highs |
89 |
|
|
S&P 600 |
+6.04 |
882.78 |
+0.69% |
|
52 Wk Lows |
7 |
|
|
52 Wk Lows |
21 |
|
|
 |
Indices Were Mixed as Dow Transports Hit a New Record High
Kenneth J. Gruneisen - Passed the CAN SLIM® Master's Exam
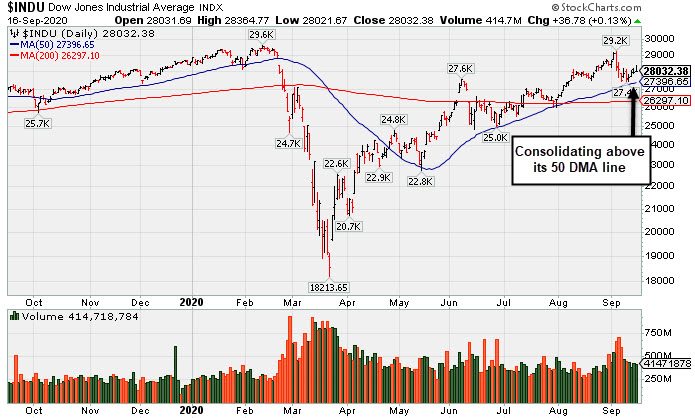
The Dow added 36 points, while the S&P 500 slipped 0.5%, erasing early session gains in the final hour of trading. More cyclical-oriented stocks outperformed, with the Dow Jones Transportation Average closing at a record level for the first time in two years. The Nasdaq Composite fell 1.3% amid weakness in Tech-focused shares. The reported volume totals were mixed, higher than the prior session total on the NYSE and lower on the Nasdaq exchange. Breadth was positive as advancers led decliners by a 3-2 margin on the NYSE and on the Nasdaq exchange. There were 31 high-ranked companies from the Leaders List hit new 52-week highs and were listed on the BreakOuts Page, versus the total of 32 on the prior session. New 52-week highs totals easily outnumbered shrinking new 52-week lows on the NYSE and on the Nasdaq exchange. The major indices have seen their uptrend recently come under pressure (M criteria). Any sustainable rally requires a healthy crop of new leaders, so recent improvement in the new highs totals has been a reassuring sign.
PICTURED: The Dow Jones Industrial Average halted its slide at its 50-day moving average (DMA) line after a spurt of losses marked by higher volume.
Stocks finished mixed on Wednesday as investors weighed the latest Federal Reserve policy decision. The central bank signaled an intent to keep rates in the near zero-bound range until at least 2023 and reiterated plans to utilize its full range of tools to support the economic recovery.
Six of 11 S&P 500 sectors closed in negative territory, with the Technology group declining the most. Energy shares outperformed amid an uptick in oil prices. WTI crude climbed 4.8% to $40.12/barrel after a government release revealed a surprise drawdown in U.S. crude stockpiles in the latest week. In earnings, FedEx (FDX +5.76%) rose after its profit tally exceeded even the highest analyst estimate.
On the data front, consumer spending slowed in August, with retail sales rising 0.6%, missing estimates of a 1% advance. Separately, a gauge of homebuilder sentiment jumped to an all-time high in September. Treasuries ended lower, with the yield on the 10-year note up one basis point to 0.69%.
Conflicting COVID-19 headlines also garnered attention. The CDC suggested the U.S. could realistically have enough vaccines to return to “regular life” by the third quarter of next year, while the Department of Health and Human Services and President Trump offered more optimistic timetables. |
 Kenneth J. Gruneisen started out as a licensed stockbroker in August 1987, a couple of months prior to the historic stock market crash that took the Dow Jones Industrial Average down -22.6% in a single day. He has published daily fact-based fundamental and technical analysis on high-ranked stocks online for two decades. Through FACTBASEDINVESTING.COM, Kenneth provides educational articles, news, market commentary, and other information regarding proven investment systems that work in good times and bad.
Comments contained in the body of this report are technical opinions only and are not necessarily those of Gruneisen Growth Corp. The material herein has been obtained from sources believed to be reliable and accurate, however, its accuracy and completeness cannot be guaranteed. Our firm, employees, and customers may effect transactions, including transactions contrary to any recommendation herein, or have positions in the securities mentioned herein or options with respect thereto. Any recommendation contained in this report may not be suitable for all investors and it is not to be deemed an offer or solicitation on our part with respect to the purchase or sale of any securities. |
|
 |
Energy and Financial Indexes Led Group Gainers
Kenneth J. Gruneisen - Passed the CAN SLIM® Master's Exam
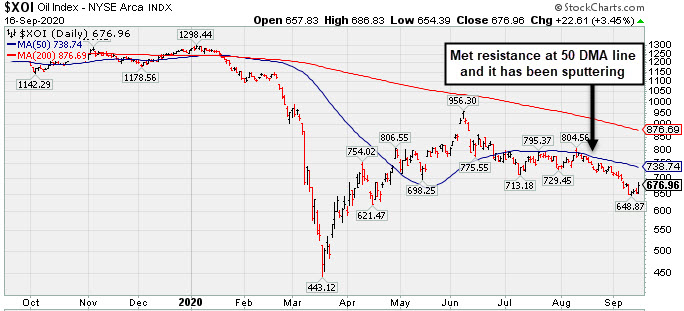
The Broker/Dealer Index ($XBD +1.27%) and Bank Index ($BKX +1.75%) both posted solid gains while the Retail Index ($RLX -1.67%) lost ground. The tech sector was mixed as the Semiconductor Index ($SOX -1.07%) fell while the Biotech Index ($BTK -0.07%) finished flat and the Networking Index ($NWX +0.35%) eked out a small gain. Energy-linked groups posted standout gains as the Oil Services Index ($OSX +3.72%) and the Integrated Oil Index ($XOI +3.45%) rose. The Gold & Silver Index ($XAU -0.08%) was unchanged.
Chart courtesy of www.stockcharts.comPICTURED: The Integrated Oil Index ($XOI +3.45%) met resistance at its 50-day moving average (DMA) line and has been sputtering.
| Oil Services |
$OSX |
34.70 |
+1.25 |
+3.72% |
-55.67% |
| Integrated Oil |
$XOI |
676.96 |
+22.61 |
+3.45% |
-46.72% |
| Semiconductor |
$SOX |
2,195.54 |
-23.65 |
-1.07% |
+18.70% |
| Networking |
$NWX |
545.66 |
+1.91 |
+0.35% |
-6.47% |
| Broker/Dealer |
$XBD |
286.97 |
+3.59 |
+1.27% |
-1.17% |
| Retail |
$RLX |
3,373.23 |
-57.16 |
-1.67% |
+37.72% |
| Gold & Silver |
$XAU |
156.06 |
-0.12 |
-0.08% |
+45.96% |
| Bank |
$BKX |
77.43 |
+1.33 |
+1.75% |
-31.70% |
| Biotech |
$BTK |
5,391.23 |
-3.98 |
-0.07% |
+6.39% |
|
|
|
 |
Met Resistance at 50 DMA Line and Reversed Today
Kenneth J. Gruneisen - Passed the CAN SLIM® Master's Exam
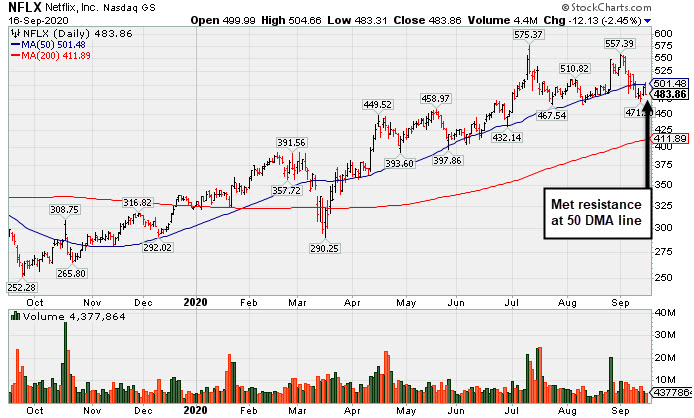
Netflix Inc (NFLX -$12.13 or -2.45% to $483.86) reversed into the red after meeting resistance at its 50-day moving average (DMA) line ($501.38). Subsequent gains back above the 50 DMA line are needed for its outlook to improve. The prior low ($466.55 on 8/11/20) defines the next important chart support level where a violation would raise serious concerns and trigger a more worrisome technical sell signal.
Since NFLX was last shown in this FSU section on 9/03/20 its Accumulation/Distribution Rating has slumped from C+ top D+. On 9/03/20 it was shown with an annotated graph under the headline,"Pulling Back After Best Ever Close on Tuesday". It has traded up as much as +46.2% since it was highlighted in yellow with pivot point cited based on its 3/03/20 high plus 10 cents in the 4/13/20 mid-day report (read here).
Fundamentals remain strong. NFLX has been consolidating after reporting Jun '20 earnings +165% on +25% sales revenues versus the year ago period. It has tallied 4 consecutive quarterly comparisons well above the +25% minimum guideline (C criteria). A previously noted downturn in FY '15 earnings (A criteria) has been followed by very strong growth. The number of top-rated funds owning its shares (I criteria) rose from 1,534 in Mar '17 to 2,790 in Jun '20, a reassuring sign concerning the I criteria. Its current Up/Down Volume Ratio of 0.9 is an unbiased indication its shares have been under slight distributional pressure over the past 50 days. The company has 423.4 million shares in the public float (S criteria) which can make it a less likely sprinter. It has a Timeliness rating of A, a Sponsorship rating of B. Charts courtesy of www.stockcharts.com
 |
|
|
Color Codes Explained :
Y - Better candidates highlighted by our
staff of experts.
G - Previously featured
in past reports as yellow but may no longer be buyable under the
guidelines.
***Last / Change / Volume data in this table is the closing quote data***
Symbol/Exchange
Company Name
Industry Group |
PRICE |
CHANGE
(%Change) |
Day High |
Volume
(% DAV)
(% 50 day avg vol) |
52 Wk Hi
% From Hi |
Featured
Date |
Price
Featured |
Pivot Featured |
|
Max Buy |
 ADBE
-
NASDAQ
ADBE
-
NASDAQ
Adobe Inc
COMPUTER SOFTWARE and SERVICES - Application Software
|
$476.00
|
-21.67
-4.35% |
$505.50
|
8,457,766
295.93% of 50 DAV
50 DAV is 2,858,000
|
$536.88
-11.34%
|
9/10/2020
|
$488.46
|
PP = $536.88
|
|
MB = $563.72
|
 Most Recent Note - 9/16/2020 5:46:28 PM
Y - Reversed into the red and closed at the session low with a big loss on heavy volume. Encountered distributional pressure and had a "negative reversal on 9/10/20. Since finding support at its 10 week-moving average (WMA), a valid secondary buy point exists up to 5% above the latest high. Subsequent losses violating its 50 DMA line ($463) may trigger a technical sell signal. Disciplined investors always limit losses by selling any stock that falls more than 7-8% from their purchase price. Reported Aug '20 quarterly earnings +25% on +14% sales revenues versus the year ago period. Volume and volatility often increase near earnings news. This well-known Computer Software - Desktop firm has produced 4 consecutive quarterly earnings increases above the +25% minimum guideline (C criteria). Annual earnings history (A criteria) has been strong and steady.
>>> FEATURED STOCK ARTICLE : Adobe Found Support Following Recent Breakout - 9/10/2020 |
View all notes |
Set NEW NOTE alert |
Company Profile |
SEC
News |
Chart |
Request a new note
C
A
S
I |
CRL
-
NYSE
Charles River Labs Intl
DRUGS - Biotechnology
|
$221.98
|
-3.32
-1.47% |
$226.71
|
319,406
97.68% of 50 DAV
50 DAV is 327,000
|
$228.86
-3.01%
|
7/15/2020
|
$192.66
|
PP = $189.95
|
|
MB = $199.45
|
Most Recent Note - 9/15/2020 5:13:03 PM
G - Hit a new all-time high with today's 5th consecutive gain clearing previously stubborn resistance in the $221 area. Found prompt support at its 50 DMA line ($206.77) after volume-driven losses. More damaging losses would raise greater concerns and trigger a technical sell signal. Recently reported Jun '20 quarterly earnings -3% on +4% sales revenues, below the +25% minimum guideline (C criteria), but better than expected while the company also raised its guidance.
>>> FEATURED STOCK ARTICLE : Found Prompt Support at 50-Day Moving Average Line - 9/11/2020 |
View all notes |
Set NEW NOTE alert |
Company Profile |
SEC
News |
Chart |
Request a new note
C
A
S
I |
AMD
-
NASDAQ
Advanced Micro Devices
ELECTRONICS - Semiconductor - Broad Line
|
$76.66
|
-2.27
-2.88% |
$79.72
|
38,350,101
58.41% of 50 DAV
50 DAV is 65,660,000
|
$94.28
-18.69%
|
8/31/2020
|
$90.42
|
PP = $87.39
|
|
MB = $91.76
|
Most Recent Note - 9/16/2020 6:21:36 PM
Y - Pulled back today with lighter volume while slumping toward its 50 DMA line ($75.24). More damaging losses leading to a 50 DMA line violation may trigger a worrisome technical sell signal. Fundamentals remain strong. See the latest FSU analysis for more details and an annotated graph.
>>> FEATURED STOCK ARTICLE : Found Support Above 50 DMA Line After Negating Recent Breakout - 9/15/2020 |
View all notes |
Set NEW NOTE alert |
Company Profile |
SEC
News |
Chart |
Request a new note
C
A
S
I |
TREX
-
NYSE
Trex Company Inc
MATERIALS and CONSTRUCTION - General Building Materials
|
$70.11
|
+0.23
0.33% |
$71.18
|
596,862
49.25% of 50 DAV
50 DAV is 1,212,000
|
$78.32
-10.48%
|
6/26/2020
|
$54.53
|
PP = $66.47
|
|
MB = $69.79
|
Most Recent Note - 9/16/2020 6:19:59 PM
G - Perched at its 50 DMA line ($69.78). The recent low ($65.60 on 9/08/20) defines the next important support level to watch. Do not be confused by the 2:1 share split effective 9/15/20 (Featured Price, Pivot Point, and Max Buy prices has been adjusted acordingly). Fundamentals remain strong.
>>> FEATURED STOCK ARTICLE : Fall Below "Max Buy" Level Also Undercut 50-Day Moving Average - 9/4/2020 |
View all notes |
Set NEW NOTE alert |
Company Profile |
SEC
News |
Chart |
Request a new note
C
A
S
I |
NFLX
-
NASDAQ
Netflix Inc
SPECIALTY RETAIL - Music and Video Stores
|
$483.86
|
-12.13
-2.45% |
$504.66
|
4,377,301
55.58% of 50 DAV
50 DAV is 7,876,000
|
$575.37
-15.90%
|
9/1/2020
|
$547.45
|
PP = $575.47
|
|
MB = $604.24
|
Most Recent Note - 9/16/2020 6:14:33 PM
G - Reversed into the red after meeting resistance at its 50 DMA line ($501.38). Subsequent gains back above the 50 DMA line are needed for its outlook to improve. Prior low ($466.55 on 8/11/20) defines the next important chart support level where a violation would raise serious concerns and trigger a more worrisome technical sell signal. See the latest FSU analysis for more details and a new annotated graph.
>>> FEATURED STOCK ARTICLE : Met Resistance at 50 DMA Line and Reversed Today - 9/16/2020 |
View all notes |
Set NEW NOTE alert |
Company Profile |
SEC
News |
Chart |
Request a new note
C
A
S
I |
Symbol/Exchange
Company Name
Industry Group |
PRICE |
CHANGE
(%Change) |
Day High |
Volume
(% DAV)
(% 50 day avg vol) |
52 Wk Hi
% From Hi |
Featured
Date |
Price
Featured |
Pivot Featured |
|
Max Buy |
LGIH
-
NASDAQ
L G I Homes Inc
Bldg-Resident/Comml
|
$115.89
|
+5.15
4.65% |
$117.44
|
327,543
103.33% of 50 DAV
50 DAV is 317,000
|
$123.94
-6.50%
|
7/7/2020
|
$99.19
|
PP = $95.82
|
|
MB = $100.61
|
Most Recent Note - 9/16/2020 5:56:04 PM
G - Finding support at its 50 DMA line ($112.19) after damaging losses. Further losses below the 50 DMA line and recent lows would raise greater concerns and trigger technical sell signals. Reported Jun '20 quarterly earnings +21% on +4% sales revenues, breaking a streak of 4 comparisons above the +25% minimum guideline (C criteria).
>>> FEATURED STOCK ARTICLE : Homebuilder Halted Slide Near Prior Low and 50-Day Average - 9/8/2020 |
View all notes |
Set NEW NOTE alert |
Company Profile |
SEC
News |
Chart |
Request a new note
C
A
S
I |
NOW
-
NYSE
Servicenow Inc
Computer Sftwr-Enterprse
|
$456.01
|
-17.95
-3.79% |
$479.44
|
1,482,565
87.21% of 50 DAV
50 DAV is 1,700,000
|
$501.82
-9.13%
|
8/20/2020
|
$453.34
|
PP = $454.79
|
|
MB = $477.53
|
Most Recent Note - 9/16/2020 6:16:01 PM
Y - Reversed into the red today and closed near the session low. Showed resilience recently after briefly undercutting the prior high ($454) and testing support at its 50 DMA line ($444). Fundamentals remain strong. More damaging losses may raise concerns and trigger a technical sell signal.
>>> FEATURED STOCK ARTICLE : Tested Support at 50-Day Moving Average Line - 9/14/2020 |
View all notes |
Set NEW NOTE alert |
Company Profile |
SEC
News |
Chart |
Request a new note
C
A
S
I |
|
|
|
THESE ARE NOT BUY RECOMMENDATIONS!
Comments contained in the body of this report are technical
opinions only. The material herein has been obtained
from sources believed to be reliable and accurate, however,
its accuracy and completeness cannot be guaranteed.
This site is not an investment advisor, hence it does
not endorse or recommend any securities or other investments.
Any recommendation contained in this report may not
be suitable for all investors and it is not to be deemed
an offer or solicitation on our part with respect to
the purchase or sale of any securities. All trademarks,
service marks and trade names appearing in this report
are the property of their respective owners, and are
likewise used for identification purposes only.
This report is a service available
only to active Paid Premium Members.
You may opt-out of receiving report notifications
at any time. Questions or comments may be submitted
by writing to Premium Membership Services 665 S.E. 10 Street, Suite 201 Deerfield Beach, FL 33441-5634 or by calling 1-800-965-8307
or 954-785-1121.
|
|
|