You are not logged in.
This means you
CAN ONLY VIEW reports that were published prior to Sunday, February 18, 2024.
You
MUST UPGRADE YOUR MEMBERSHIP if you want to see any current reports.
AFTER MARKET UPDATE - THURSDAY, SEPTEMBER 15TH, 2022
Previous After Market Report Next After Market Report >>>
|
|
|
|
DOW |
-173.27 |
30,961.82 |
-0.56% |
|
Volume |
990,975,530 |
-1% |
|
Volume |
4,797,137,200 |
-2% |
|
NASDAQ |
-167.32 |
11,552.36 |
-1.43% |
|
Advancers |
867 |
28% |
|
Advancers |
1,838 |
43% |
|
S&P 500 |
-44.66 |
3,901.35 |
-1.13% |
|
Decliners |
2,209 |
72% |
|
Decliners |
2,472 |
57% |
|
Russell 2000 |
-13.23 |
1,825.23 |
-0.72% |
|
52 Wk Highs |
18 |
|
|
52 Wk Highs |
25 |
|
|
S&P 600 |
+2.02 |
1,164.01 |
+0.17% |
|
52 Wk Lows |
176 |
|
|
52 Wk Lows |
270 |
|
|
Deterioration has the market uptrend under pressure (M criteria) and having the overall look of a more serious correction. A caution flag has been raised by the technical damage in the major indices coupled with a shrinking list of stocks hitting new highs.
|
 |
Major Indices Slump Again While Lacking Leadership
Kenneth J. Gruneisen - Passed the CAN SLIM® Master's Exam
The Dow fell 173 points, while the Nasdaq Composite shed 1.4% amid weakness in growth-related shares. The S&P 500 slipped 1.1%. The volume totals reported were lighter than the prior session on the NYSE and on the Nasdaq exchange. Breadth was negative as decliners led advancers by a 3-2 margin on the Nasdaq exchange and 4-3 on the NYSE. Leadership remained thin as there were 5 high-ranked companies from the Leaders List that hit new 52-week highs and were listed on the BreakOuts Page, matching the total of 5 on the prior session. New 52-week lows outnumbered new 52-week highs on both the NYSE and the Nasdaq exchange. The market uptrend is now under pressure (M criteria). Any sustainable rally requires a healthy crop of leading stocks hitting new highs.
Chart courtesy of www.stockcharts.com%20on%20Tuesday.%20Yesterday,%20the%20broad%20benchmark%20eclipsed%20the%204,300%20level%20for%20the%20first%20time%20since%20late%20April.%20The%20Nasdaq%20Composite%20fell%201.3%%20amid%20weakness%20in%20mega-cap%20tech%20shares.%20The%20volume%20totals%20reported%20were%20mixed,%20lighter%20than%20the%20prior%20session%20on%20the%20NYSE%20and%20higher%20on%20the%20Nasdaq%20exchange.%20Decliners%20led%20advancers%20by%20a%204-1%20margin%20on%20the%20NYSE%20ad%20by%20a%203-1%20margin%20on%20the%20Nasdaq%20exchange.%20There%20were%2017%20high-ranked%20companies%20from%20the%20Leaders%20List%20that%20hit%20new%2052-week%20highs%20and%20were%20listed%20on%20the%20BreakOuts%20Page,%20down%20from%20the%20total%20of%2045%20on%20the%20prior%20session.%20New%2052-week%20highs%20outnumbered%20new%2052-week%20lows%20on%20the%20NYSE,%20but%20new%20lows%20outnumbered%20new%20highs%20on%20the%20Nasdaq%20exchange.%20The%20market%20is%20in%20a%20confirmed%20uptrend%20(M%20criteria).%20Any%20sustainable%20rally%20requires%20a%20healthy%20crop%20of%20leading%20stocks%20hitting%20new%20highs,%20so%20the%20recent%20improvement%20in%20leadership%20was%20a%20reassuring%20sign.) 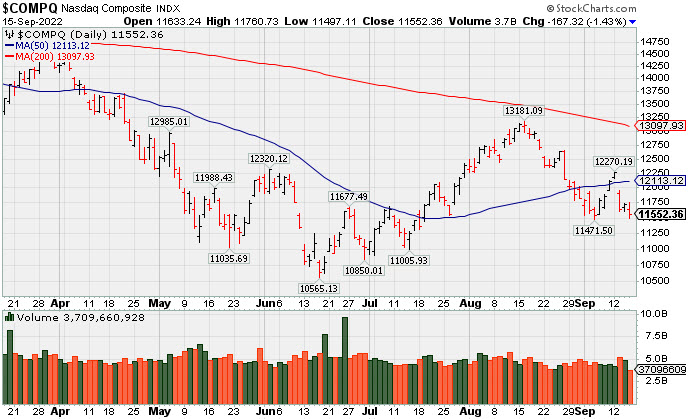 PICTURED: The Nasdaq Composite Index met resistance near its 50-day moving average (DMA) line and slumped back toward the June low.
U.S. equities finished lower in choppy trading Thursday as investors assessed today’s mixed economic data. Nine of 11 sectors of the S&P 500 ended in negative territory, with Health Care and Financials bucking the downtrend.
On the data front, weekly initial jobless claims came in lower than expected to its lowest level since late May. Separately, the Philadelphia Federal Reserve’s (Fed) business outlook deteriorated further in September, with the reading slipping into negative territory. Meanwhile, U.S. retail sales unexpectedly notched a 0.3% monthly gain in August, climbing from last month’s downwardly revised 0.4% decline. Elsewhere on the data front, import prices beat estimates in August, though still posted a decline of 1% month-over-month. September’s Empire manufacturing survey came in at -1.5, while industrial production posted a 0.2% monthly decline for August.
Treasuries weakened, with the yield on the benchmark 10-year note up four basis points (0.04%) to 3.45%. The yield on the more Fed-sensitive two-year note added seven basis points (0.07%) to 3.86%, its highest since 2007. Yields rose amid increased probability the Fed will implement a 75-basis point (0.75%) rate hike at their upcoming policy meeting. In commodities, West Texas Intermediate (WTI) crude fell 3.6% to $85.31/barrel amid concerns over global demand and a stronger dollar. Gold fell to its lowest level since April 2020 as market participants looked towards next week’s Fed meeting. |
 Kenneth J. Gruneisen started out as a licensed stockbroker in August 1987, a couple of months prior to the historic stock market crash that took the Dow Jones Industrial Average down -22.6% in a single day. He has published daily fact-based fundamental and technical analysis on high-ranked stocks online for two decades. Through FACTBASEDINVESTING.COM, Kenneth provides educational articles, news, market commentary, and other information regarding proven investment systems that work in good times and bad.
Comments contained in the body of this report are technical opinions only and are not necessarily those of Gruneisen Growth Corp. The material herein has been obtained from sources believed to be reliable and accurate, however, its accuracy and completeness cannot be guaranteed. Our firm, employees, and customers may effect transactions, including transactions contrary to any recommendation herein, or have positions in the securities mentioned herein or options with respect thereto. Any recommendation contained in this report may not be suitable for all investors and it is not to be deemed an offer or solicitation on our part with respect to the purchase or sale of any securities. |
|
 |
Financials and Biotech Index Rose; Commodity-Linked Groups Fell
Kenneth J. Gruneisen - Passed the CAN SLIM® Master's Exam
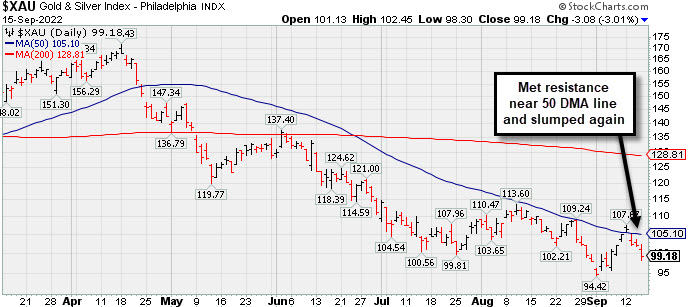
The Bank Index ($BKX +1.37%) rose and outpaced the Broker/Dealer Index ($XBD +0.30%), meanwhile the Retail Index ($RLX -0.16%) ended slightly in the red. The Semiconductor Index ($SOX -1.62%) and Networking Index ($NWX -2.30%) both lost ground while the Biotech Index ($BTK +0.77%) posted a modest gain. Commodity-linked groups were standout decliners on Thursday as the Gold & Silver Index ($XAU -3.01%), Oil Services Index ($OSX -2.82%), and Integrated Oil Index ($XOI -2.88%) suffered large losses.
PICTURED: The Gold & Silver Index ($XAU -3.01%) recently met resistance near its 50-day moving average (DMA) line and slumped again.
| Oil Services |
$OSX |
68.93 |
-2.00 |
-2.82% |
+30.74% |
| Integrated Oil |
$XOI |
1,624.67 |
-48.14 |
-2.88% |
+37.89% |
| Semiconductor |
$SOX |
2,549.54 |
-41.97 |
-1.62% |
-35.39% |
| Networking |
$NWX |
784.77 |
-18.47 |
-2.30% |
-19.19% |
| Broker/Dealer |
$XBD |
446.59 |
+1.35 |
+0.30% |
-8.27% |
| Retail |
$RLX |
3,224.86 |
-5.14 |
-0.16% |
-23.70% |
| Gold & Silver |
$XAU |
99.18 |
-3.08 |
-3.01% |
-25.12% |
| Bank |
$BKX |
107.72 |
+1.46 |
+1.37% |
-18.53% |
| Biotech |
$BTK |
4,799.58 |
+36.69 |
+0.77% |
-13.03% |
|
|
|
 |
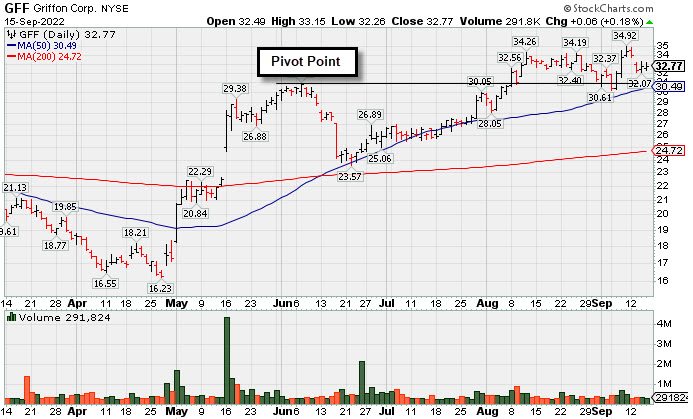
Griffon Near All-Time High Making Limited Progress
Kenneth J. Gruneisen - Passed the CAN SLIM® Master's Exam
Griffon Corporation (GFF +$0.06 or +0.18% to $32.77) has held its ground after a 9/13/22 gap down, retreating from its all-time high. Its color code was changed to yellow after pulling back below its "max buy" level. Prior lows and its 50-day moving average (DMA) line define important near-term support in the $30 area.
GFF has not made much meaningful progress since highlighted in yellow with pivot point cited based on its 6/07/22 high plus 10 cents in the 8/08/22 mid-day report (read here). It was last shown in greater detail on 8/25/22 with an annotated graph under the headline, "Best Ever Close With Gain on Lighter Volume". Fresh signs of institutional buying demand, gains backed by heavier volume, would be a reassuring sign.
GFF has a 99 Earnings Per Share Rating. It reported Jun '22 quarterly earnings +215% on +31% sales revenues versus the year ago period, its 3rd strong quarterly comparison above the +25% minimum guideline (C criteria). Annual earnings (A criteria) growth has been strong and steady.
The company has only 57 million shares outstanding (S criteria) which can contribute to greater volatility in the event of institutional buying or selling. The number of top-dated funds owning its shares rose from 331 in Mar '22 to 350 in Jun '22. Its current Up/Down Volume Ratio of 1.1 is an unbiased indication its shares have been under slight accumulation over the past 50 days.
|
|
|
Color Codes Explained :
Y - Better candidates highlighted by our
staff of experts.
G - Previously featured
in past reports as yellow but may no longer be buyable under the
guidelines.
***Last / Change / Volume data in this table is the closing quote data***
Symbol/Exchange
Company Name
Industry Group |
PRICE |
CHANGE
(%Change) |
Day High |
Volume
(% DAV)
(% 50 day avg vol) |
52 Wk Hi
% From Hi |
Featured
Date |
Price
Featured |
Pivot Featured |
|
Max Buy |
 CI
-
NYSE
CI
-
NYSE
Cigna Corp
Medical-Managed Care
|
$289.96
|
+5.88
2.07% |
$292.15
|
2,368,960
120.68% of 50 DAV
50 DAV is 1,963,000
|
$296.29
-2.14%
|
7/7/2022
|
$276.55
|
PP = $273.68
|
|
MB = $287.36
|
 Most Recent Note - 9/15/2022 5:45:51 PM
G - Consolidating above its 50 DMA line ($282) while perched near its all-time high hit this week. Reported earnings for the Jun '22 quarter rose +19% on +5% sales revenues versus the year ago period, breaking a streak of 3 quarterly earnings increases above the +25% minimum guideline (C criteria), raising fundamental concerns.
>>> FEATURED STOCK ARTICLE : Cigna Hovering Near High Despite Earnings Under +25% Minimum - 8/26/2022 |
View all notes |
Set NEW NOTE alert |
Company Profile |
SEC
News |
Chart |
Request a new note
C
A
S
I |
ESQ
-
NASDAQ
Esquire Financial Holdings
Finance-Commercial Loans
|
$38.79
|
+0.30
0.78% |
$39.81
|
21,448
80.03% of 50 DAV
50 DAV is 26,800
|
$41.68
-6.93%
|
7/26/2022
|
$37.74
|
PP = $39.19
|
|
MB = $41.15
|
Most Recent Note - 9/12/2022 4:51:32 PM
Y - Posted a 4th consecutive gain today after recently finding support near its 50 DMA line ($36.89). Confirming gains above the pivot point backed by at least +40% above average volume would be a reassuring sign of fresh institutional buying.
>>> FEATURED STOCK ARTICLE : Testing 50-Day Moving Average With 5th Straight Loss - 9/1/2022 |
View all notes |
Set NEW NOTE alert |
Company Profile |
SEC
News |
Chart |
Request a new note
C
A
S
I |
GPK
-
NYSE
Graphic Packaging Hldg
CONSUMER NON-DURABLES - Packaging and Containers
|
$22.72
|
+0.02
0.09% |
$22.91
|
1,672,298
60.94% of 50 DAV
50 DAV is 2,744,000
|
$24.07
-5.61%
|
7/26/2022
|
$22.63
|
PP = $23.09
|
|
MB = $24.24
|
Most Recent Note - 9/13/2022 6:00:59 PM
Y - Pulled back quietly today after wedging to a new 52-week high with the prior gain lacking great volume conviction. Near-term support to watch is at its 50 DMA line ($22.25).
>>> FEATURED STOCK ARTICLE : Recently Slipped Below Pivot Point Testing 50-Day Average - 9/6/2022 |
View all notes |
Set NEW NOTE alert |
Company Profile |
SEC
News |
Chart |
Request a new note
C
A
S
I |
CSL
-
NYSE
Carlisle Cos Inc
Diversified Operations
|
$301.23
|
-1.47
-0.49% |
$305.01
|
357,539
75.75% of 50 DAV
50 DAV is 472,000
|
$318.71
-5.48%
|
7/28/2022
|
$282.31
|
PP = $275.23
|
|
MB = $288.99
|
Most Recent Note - 9/14/2022 8:55:19 PM
G - Consolidating near its all-time high. Its prior low $291 defines near term support to watch above its 50 DMA line ($289). See the latest FSU analysis for more details and a new annotated graph.
>>> FEATURED STOCK ARTICLE : Consolidating Near High Well Above 50-Day Moving Average - 9/14/2022 |
View all notes |
Set NEW NOTE alert |
Company Profile |
SEC
News |
Chart |
Request a new note
C
A
S
I |
ENPH
-
NASDAQ
Enphase Energy Inc
Energy-Solar
|
$312.18
|
-8.44
-2.63% |
$322.95
|
3,816,755
105.87% of 50 DAV
50 DAV is 3,605,000
|
$324.84
-3.90%
|
7/28/2022
|
$276.66
|
PP = $282.55
|
|
MB = $296.68
|
Most Recent Note - 9/14/2022 8:36:56 PM
G - Posted a solid gain today for a best-ever close. Held its ground near its all-time high after a volume-driven breakout gain on 9/07/22 following a brief consolidation. Recent lows in the $271-272 area define initial support above its 50 DMA line ($267). Fundamentals remain strong.
>>> FEATURED STOCK ARTICLE : High-Ranked Solar Energy Firm Hovering Near All-Time High - 9/13/2022 |
View all notes |
Set NEW NOTE alert |
Company Profile |
SEC
News |
Chart |
Request a new note
C
A
S
I |
Symbol/Exchange
Company Name
Industry Group |
PRICE |
CHANGE
(%Change) |
Day High |
Volume
(% DAV)
(% 50 day avg vol) |
52 Wk Hi
% From Hi |
Featured
Date |
Price
Featured |
Pivot Featured |
|
Max Buy |
PWR
-
NYSE
Quanta Services Inc
MATERIALS and CONSTRUCTION - General Contractors
|
$138.88
|
-3.49
-2.45% |
$142.10
|
1,621,293
159.11% of 50 DAV
50 DAV is 1,019,000
|
$149.33
-7.00%
|
7/28/2022
|
$141.83
|
PP = $140.14
|
|
MB = $147.15
|
Most Recent Note - 9/13/2022 6:03:02 PM
Y - Confirming volume-driven gains for new highs would be a reassuring sign of fresh institutional buying demand. It is quietly consolidating above its 50 DMA line ($137.78) which defines important near-term support to watch. Fundamentals remain strong.
>>> FEATURED STOCK ARTICLE : Consolidating Near Prior Highs and Above 50-Day Moving Average - 9/7/2022 |
View all notes |
Set NEW NOTE alert |
Company Profile |
SEC
News |
Chart |
Request a new note
C
A
S
I |
GFF
-
NYSE
Griffon Corporation
MATERIALS and CONSTRUCTION - General Building Materials
|
$32.77
|
+0.06
0.18% |
$33.16
|
288,467
76.11% of 50 DAV
50 DAV is 379,000
|
$34.92
-6.16%
|
8/8/2022
|
$32.46
|
PP = $31.12
|
|
MB = $32.68
|
Most Recent Note - 9/15/2022 6:02:22 PM
Y - Held its ground since a 9/13/22 gap down retreating from its all-time high. Its 50 DMA line ($30.54) and prior low define near-term support in the $30 area.
>>> FEATURED STOCK ARTICLE : Griffon Near All-Time High Making Limited Progress - 9/15/2022 |
View all notes |
Set NEW NOTE alert |
Company Profile |
SEC
News |
Chart |
Request a new note
C
A
S
I |
CLH
-
NYSE
Clean Harbors Inc
Pollution Control
|
$120.31
|
-0.26
-0.22% |
$121.56
|
466,452
138.41% of 50 DAV
50 DAV is 337,000
|
$124.49
-3.36%
|
8/10/2022
|
$111.78
|
PP = $115.10
|
|
MB = $120.86
|
Most Recent Note - 9/14/2022 12:34:41 PM
G - Perched near its all-time high following volume-driven gains. Prior high in the $115 area defines important near-term support to watch. No resistance remains due to overhead supply. Fundamentals remain strong.
>>> FEATURED STOCK ARTICLE : Quietly Consolidating Below "Max Buy" Level After Breakout - 8/29/2022 |
View all notes |
Set NEW NOTE alert |
Company Profile |
SEC
News |
Chart |
Request a new note
C
A
S
I |
CASY
-
NASDAQ
Caseys General Stores
RETAIL - Super/Mini Markets
|
$214.66
|
-0.16
-0.07% |
$216.07
|
213,538
82.45% of 50 DAV
50 DAV is 259,000
|
$223.90
-4.13%
|
9/8/2022
|
$217.81
|
PP = $222.40
|
|
MB = $233.52
|
Most Recent Note - 9/13/2022 6:08:26 PM
Y - Ended near the low end of its intra-day range with a 2nd consecutive loss after failing to close above the pivot point and clinch a proper technical buy signal. Fundamentals remain strong.
>>> FEATURED STOCK ARTICLE : Casey's is Perched Within Close Range of All-Time High - 9/9/2022 |
View all notes |
Set NEW NOTE alert |
Company Profile |
SEC
News |
Chart |
Request a new note
C
A
S
I |
CPRX
-
NASDAQ
Catalyst Pharma Inc
Medical-Biomed/Biotech
|
$13.62
|
-1.90
-12.24% |
$15.33
|
8,976,017
270.52% of 50 DAV
50 DAV is 3,318,000
|
$17.22
-20.91%
|
9/8/2022
|
$15.14
|
PP = $15.17
|
|
MB = $15.93
|
Most Recent Note - 9/15/2022 6:04:30 PM
G - Abruptly retreated today, quickly erasing recent gains and slumping back below the pivot point raising concerns. Highlighted in yellow with pivot point cited based on its 8/23/22 high plus 10 cents in the 9/08/22 mid-day report. Reported Jun '22 quarterly earnings +75% on +46% sales revenues versus the year ago period, its 3rd consecutive quarterly comparison above the +25% minimum earnings guideline (C criteria). Annual earnings (A criteria) growth has been strong since turning profitable in FY '19.
>>> FEATURED STOCK ARTICLE : Hit a New High After a 4-Week Tight Pattern of Closes - 9/8/2022 |
View all notes |
Set NEW NOTE alert |
Company Profile |
SEC
News |
Chart |
Request a new note
C
A
S
I |
Symbol/Exchange
Company Name
Industry Group |
PRICE |
CHANGE
(%Change) |
Day High |
Volume
(% DAV)
(% 50 day avg vol) |
52 Wk Hi
% From Hi |
Featured
Date |
Price
Featured |
Pivot Featured |
|
Max Buy |
CCRN
-
NASDAQ
Cross Country Healthcare
DIVERSIFIED SERVICES - Staffing and Outsourcing Service
|
$29.29
|
+0.54
1.88% |
$30.39
|
1,138,110
129.04% of 50 DAV
50 DAV is 882,000
|
$30.51
-4.00%
|
9/9/2022
|
$27.32
|
PP = $30.61
|
|
MB = $32.14
|
Most Recent Note - 9/15/2022 12:44:02 PM
Y - Today's gain follows a big volume-driven gain while challenging prior highs in the $30 area. It has been consolidating above its 50 DMA line ($25.35) which defines important support to watch. Recently reported insider buying is a reassuring sign. Highlighted in yellow with pivot point cited based on its 7/21/22 high plus 10 cents in the 9/09/22 mid-day report and noted - "Subsequent gains above the pivot point backed by at least +40% above average volume may trigger a technical buy signal."
>>> FEATURED STOCK ARTICLE : Positive Reversal While Consolidating Above 50-Day Moving Average - 9/12/2022 |
View all notes |
Set NEW NOTE alert |
Company Profile |
SEC
News |
Chart |
Request a new note
C
A
S
I |
|
|
|
THESE ARE NOT BUY RECOMMENDATIONS!
Comments contained in the body of this report are technical
opinions only. The material herein has been obtained
from sources believed to be reliable and accurate, however,
its accuracy and completeness cannot be guaranteed.
This site is not an investment advisor, hence it does
not endorse or recommend any securities or other investments.
Any recommendation contained in this report may not
be suitable for all investors and it is not to be deemed
an offer or solicitation on our part with respect to
the purchase or sale of any securities. All trademarks,
service marks and trade names appearing in this report
are the property of their respective owners, and are
likewise used for identification purposes only.
This report is a service available
only to active Paid Premium Members.
You may opt-out of receiving report notifications
at any time. Questions or comments may be submitted
by writing to Premium Membership Services 665 S.E. 10 Street, Suite 201 Deerfield Beach, FL 33441-5634 or by calling 1-800-965-8307
or 954-785-1121.
|
|
|