You are not logged in.
This means you
CAN ONLY VIEW reports that were published prior to Saturday, February 24, 2024.
You
MUST UPGRADE YOUR MEMBERSHIP if you want to see any current reports.
AFTER MARKET UPDATE - TUESDAY, SEPTEMBER 15TH, 2020
Previous After Market Report Next After Market Report >>>
|
|
|
|
DOW |
+2.27 |
27,995.60 |
+0.01% |
|
Volume |
843,790,388 |
-2% |
|
Volume |
3,750,567,700 |
+2% |
|
NASDAQ |
+133.83 |
11,190.48 |
+1.21% |
|
Advancers |
1,621 |
55% |
|
Advancers |
1,816 |
54% |
|
S&P 500 |
+17.66 |
3,401.20 |
+0.52% |
|
Decliners |
1,351 |
45% |
|
Decliners |
1,527 |
46% |
|
Russell 2000 |
+1.18 |
1,538.15 |
+0.08% |
|
52 Wk Highs |
100 |
|
|
52 Wk Highs |
84 |
|
|
S&P 600 |
-0.36 |
87.74 |
-0.41% |
|
52 Wk Lows |
10 |
|
|
52 Wk Lows |
20 |
|
|
 |
Tech-Heavy Nasdaq Composite Index Outpaces its Peers Again
Kenneth J. Gruneisen - Passed the CAN SLIM® Master's Exam
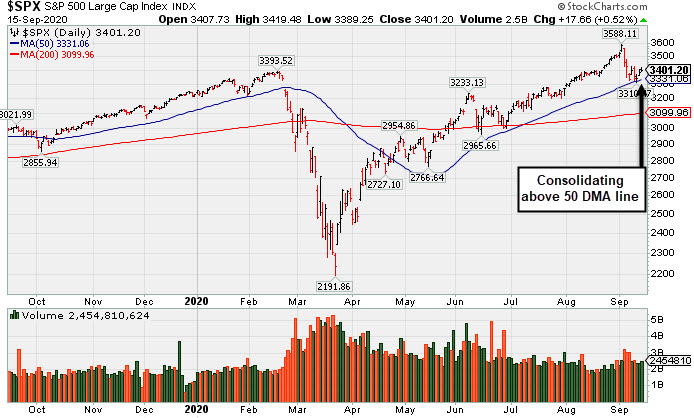
The S&P 500 rose 0.5%, while the Tech-heavy Nasdaq Composite advanced 1.2%. The Dow pared a 200-point gain to end just 2 points higher. The reported volume totals were mixed, lighter than the prior session total on the NYSE and higher on the Nasdaq exchange. Breadth was slightly positive as advancers led decliners by an 8-7 margin on the NYSE and 6-5 on the Nasdaq exchange. Leadership improved as 32 high-ranked companies from the Leaders List hit new 52-week highs and were listed on the BreakOuts Page, versus the total of 21 on the prior session. New 52-week highs totals expanded and easily outnumbered shrinking new 52-week lows on the NYSE and on the Nasdaq exchange. The major indices have seen their uptrend recently come under pressure (M criteria). Any sustainable rally requires a healthy crop of new leaders, so recent improvement in the new highs totals has been a reassuring sign.
PICTURED: The S&P 500 Index halted its slide at its 50-day moving average (DMA) line after a spurt of losses marked by higher volume.
Stocks ended higher on Tuesday, with all three major averages building on Monday's rally. Early in the trading session, economic updates out of China boosted sentiment after reports showing industrial output in the world’s second largest economy advanced the most in eight months in August, while retail sales rose for the first time this year, returning to pre-coronavirus levels. On the domestic data front, U.S. industrial production increased 0.4% last month, slowing from July’s upwardly revised 3.5% pace. Separately, the empire manufacturing survey revealed manufacturing activity in the New York State region improved more than expected this month. Treasuries were little changed as the Fed kicked off their two-day policy meeting. The yield on the 10-year note added one basis point to 0.68%. In commodities, WTI crude rose 2.8% to $38.29/barrel despite a monthly report from the IEA forecasting lower consumption growth this year.
Eight of 11 S&P 500 sectors advanced with the Communication Services group pacing the gains. Financials lagged the most with JP Morgan Chase & Co (JPM -3.11%) down after following rivals in trimming net interest income estimates for 2020. In corporate news, Apple (AAPL +0.16%) reversed early session gains despite unveiling a series of subscription bundles and a new virtual fitness service during its virtual product launch. In earnings, NextEra (NEE +4.89%) rose following a boost to its forward guidance and an announced stock split. Lennar (LEN -3.92%) fell after the homebuilder said the average sale price of homes would likely decline during its fiscal fourth quarter. |
 Kenneth J. Gruneisen started out as a licensed stockbroker in August 1987, a couple of months prior to the historic stock market crash that took the Dow Jones Industrial Average down -22.6% in a single day. He has published daily fact-based fundamental and technical analysis on high-ranked stocks online for two decades. Through FACTBASEDINVESTING.COM, Kenneth provides educational articles, news, market commentary, and other information regarding proven investment systems that work in good times and bad.
Comments contained in the body of this report are technical opinions only and are not necessarily those of Gruneisen Growth Corp. The material herein has been obtained from sources believed to be reliable and accurate, however, its accuracy and completeness cannot be guaranteed. Our firm, employees, and customers may effect transactions, including transactions contrary to any recommendation herein, or have positions in the securities mentioned herein or options with respect thereto. Any recommendation contained in this report may not be suitable for all investors and it is not to be deemed an offer or solicitation on our part with respect to the purchase or sale of any securities. |
|
 |
Retail, Tech Sector, and Oil Services Index Rose
Kenneth J. Gruneisen - Passed the CAN SLIM® Master's Exam
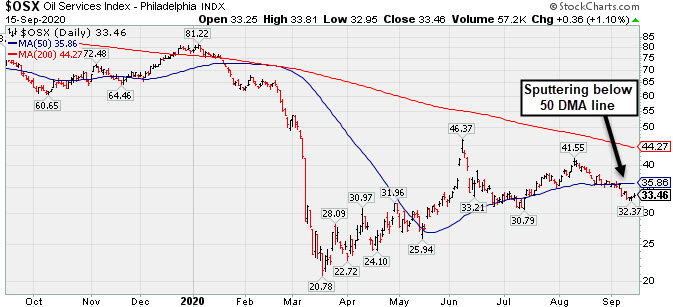
The Retail Index ($RLX +1.43%) posed a solid gain but financials created a drag on the major indices as the Broker/Dealer Index ($XBD -1.38%) and Bank Index ($BKX -2.11%) both fell. The tech sector had a positive bias as the Semiconductor Index ($SOX +1.73%) led the way while the Biotech Index ($BTK +0.73%) and Networking Index ($NWX +0.45%) each posted a smaller gain. Energy-linked groups were mixed as the Oil Services Index ($OSX +1.10%) rose but the Integrated Oil Index ($XOI -0.81%) fell, meanwhile the Gold & Silver Index ($XAU -0.14%) finished flat.
Chart courtesy of www.stockcharts.comPICTURED: The Oil Services Index ($OSX +1.10%) is again sputtering below its 50-day moving average (DMA) line.
| Oil Services |
$OSX |
33.46 |
+0.36 |
+1.10% |
-57.26% |
| Integrated Oil |
$XOI |
654.35 |
-5.37 |
-0.81% |
-48.50% |
| Semiconductor |
$SOX |
2,219.59 |
+37.84 |
+1.73% |
+20.00% |
| Networking |
$NWX |
543.75 |
+2.46 |
+0.45% |
-6.80% |
| Broker/Dealer |
$XBD |
283.38 |
-3.95 |
-1.38% |
-2.41% |
| Retail |
$RLX |
3,430.39 |
+48.37 |
+1.43% |
+40.06% |
| Gold & Silver |
$XAU |
156.18 |
-0.21 |
-0.14% |
+46.07% |
| Bank |
$BKX |
76.10 |
-1.64 |
-2.11% |
-32.87% |
| Biotech |
$BTK |
5,394.84 |
+38.98 |
+0.73% |
+6.46% |
|
|
|
 |
Found Support Above 50 DMA Line After Negating Recent Breakout
Kenneth J. Gruneisen - Passed the CAN SLIM® Master's Exam
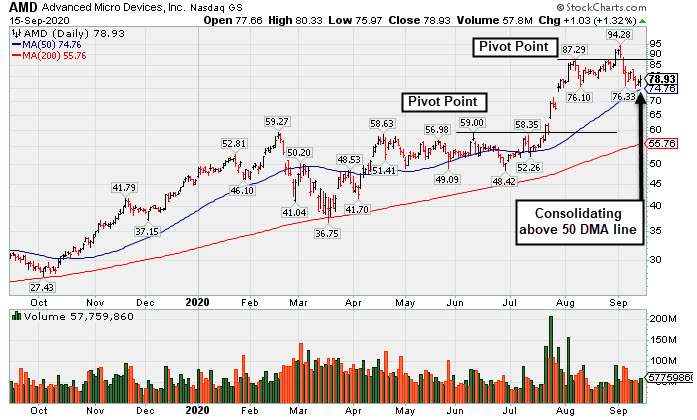
Advanced Micro Devices (AMD +$1.03 or +1.32% to $78.93) posted a 2nd consecutive gain today with lighter than average volume, consolidating above its 50-day moving average (DMA) line ($74.76). It negated the latest breakout from an advanced "3-weeks tight" base and undercut recent lows in the $76 area last week raising concerns while slumping toward its 50-day moving average (DMA) line. More damaging losses leading to a 50 DMA line violation may trigger a worrisome technical sell signal. Subsequent gains back above the pivot point may help its outlook improve.
Fundamentals remain strong. Bullish action came after it reported earnings +125% on +26% sales revenues for the Jun '20 quarter versus the year ago period. The 4 latest quarterly comparisons through Jun '20 showed very strong earnings increases well above the +25% minimum guideline (C criteria) with strong underlying sales revenues growth versus the year ago periods. Annual earnings growth (A criteria) has been very strong after losses in FY '15 and '16. it has a highest possible 99 Earnings Per Share Rating.
AMD hails from the Electronics - Semiconductor Fabless industry which has a Group Relative Strength Rating of 87 (L criteria). It has a large supply of 1.17 billion shares outstanding (S criteria), which makes it less likely to be a quick sprinter. However, the number of top-rated funds owning its shares rose from 1,669 in Jun '19 to 2,152 in Jun '20, a reassuring sign concerning the I criteria. Its current Up/Down Volume Ratio of 1.2 is an unbiased indication its shares have been under accumulation over the past 50 days. It has a Timeliness Rating of A, a Sponsorship Rating of B, and an Accumulation/Distribution rating of B+.
|
|
|
Color Codes Explained :
Y - Better candidates highlighted by our
staff of experts.
G - Previously featured
in past reports as yellow but may no longer be buyable under the
guidelines.
***Last / Change / Volume data in this table is the closing quote data***
Symbol/Exchange
Company Name
Industry Group |
PRICE |
CHANGE
(%Change) |
Day High |
Volume
(% DAV)
(% 50 day avg vol) |
52 Wk Hi
% From Hi |
Featured
Date |
Price
Featured |
Pivot Featured |
|
Max Buy |
 ADBE
-
NASDAQ
ADBE
-
NASDAQ
Adobe Inc
COMPUTER SOFTWARE and SERVICES - Application Software
|
$497.67
|
+11.76
2.42% |
$499.69
|
5,165,206
184.47% of 50 DAV
50 DAV is 2,800,000
|
$536.88
-7.30%
|
9/10/2020
|
$488.46
|
PP = $536.88
|
|
MB = $563.72
|
 Most Recent Note - 9/15/2020 5:10:47 PM
Y - Posted a 2nd consecutive gain today with above average volume. Encountered distributional pressure and had a "negative reversal on 9/10/20. Since finding support at its 10 week-moving average (WMA), a valid secondary buy point exists up to 5% above the latest high. Subsequent losses violating its 50 DMA line ($463) may trigger a technical sell signal. Disciplined investors always limit losses by selling any stock that falls more than 7-8% from their purchase price. Reported Aug '20 quarterly earnings +25% on +14% sales revenues versus the year ago period. Volume and volatility often increase near earnings news. This well-known Computer Software - Desktop firm has produced 4 consecutive quarterly earnings increases above the +25% minimum guideline (C criteria). Annual earnings history (A criteria) has been strong and steady.
>>> FEATURED STOCK ARTICLE : Adobe Found Support Following Recent Breakout - 9/10/2020 |
View all notes |
Set NEW NOTE alert |
Company Profile |
SEC
News |
Chart |
Request a new note
C
A
S
I |
CRL
-
NYSE
Charles River Labs Intl
DRUGS - Biotechnology
|
$225.30
|
+5.29
2.40% |
$228.86
|
392,015
119.52% of 50 DAV
50 DAV is 328,000
|
$221.97
1.50%
|
7/15/2020
|
$192.66
|
PP = $189.95
|
|
MB = $199.45
|
Most Recent Note - 9/15/2020 5:13:03 PM
G - Hit a new all-time high with today's 5th consecutive gain clearing previously stubborn resistance in the $221 area. Found prompt support at its 50 DMA line ($206.77) after volume-driven losses. More damaging losses would raise greater concerns and trigger a technical sell signal. Recently reported Jun '20 quarterly earnings -3% on +4% sales revenues, below the +25% minimum guideline (C criteria), but better than expected while the company also raised its guidance.
>>> FEATURED STOCK ARTICLE : Found Prompt Support at 50-Day Moving Average Line - 9/11/2020 |
View all notes |
Set NEW NOTE alert |
Company Profile |
SEC
News |
Chart |
Request a new note
C
A
S
I |
AMD
-
NASDAQ
Advanced Micro Devices
ELECTRONICS - Semiconductor - Broad Line
|
$78.93
|
+1.03
1.32% |
$80.33
|
57,742,241
88.51% of 50 DAV
50 DAV is 65,238,000
|
$94.28
-16.28%
|
8/31/2020
|
$90.42
|
PP = $87.39
|
|
MB = $91.76
|
Most Recent Note - 9/15/2020 5:11:53 PM
Y - Posted a 2nd consecutive gain today with lighter than average volume. Undercut recent lows in the $76 area last week raising concerns while slumping toward its 50 DMA line ($74.76). More damaging losses leading to a 50 DMA line violation may trigger a worrisome technical sell signal. Fundamentals remain strong. See the latest FSU analysis for more details and a new annotated graph.
>>> FEATURED STOCK ARTICLE : Found Support Above 50 DMA Line After Negating Recent Breakout - 9/15/2020 |
View all notes |
Set NEW NOTE alert |
Company Profile |
SEC
News |
Chart |
Request a new note
C
A
S
I |
TREX
-
NYSE
Trex Company Inc
MATERIALS and CONSTRUCTION - General Building Materials
|
$69.88
|
-0.07
-0.10% |
$73.00
|
671,815
54.62% of 50 DAV
50 DAV is 1,230,000
|
$78.32
-10.78%
|
6/26/2020
|
$109.05
|
PP = $132.94
|
|
MB = $139.59
|
Most Recent Note - 9/14/2020 5:44:45 PM
G - Rebounded above its 50 DMA line ($139) line with today's big gain on average volume helping its outlook improve. The recent low ($131.20 on 9/08/20) defines the next important support level to watch. Fundamentals remain strong.
>>> FEATURED STOCK ARTICLE : Fall Below "Max Buy" Level Also Undercut 50-Day Moving Average - 9/4/2020 |
View all notes |
Set NEW NOTE alert |
Company Profile |
SEC
News |
Chart |
Request a new note
C
A
S
I |
NFLX
-
NASDAQ
Netflix Inc
SPECIALTY RETAIL - Music and Video Stores
|
$495.99
|
+19.73
4.14% |
$497.47
|
5,276,967
66.58% of 50 DAV
50 DAV is 7,926,000
|
$575.37
-13.80%
|
9/1/2020
|
$547.45
|
PP = $575.47
|
|
MB = $604.24
|
Most Recent Note - 9/15/2020 5:16:05 PM
G - Rebounded near its 50 DMA line ($501.66) with lighter volume behind today's gain. Subsequent gains back above the 50 DMA line are needed for its outlook to improve. Prior low ($466.55 on 8/11/20) defines the next important chart support level where a violation would raise serious concerns and trigger a more worrisome technical sell signal.
>>> FEATURED STOCK ARTICLE : Pulling Back After Best Ever Close on Tuesday - 9/3/2020 |
View all notes |
Set NEW NOTE alert |
Company Profile |
SEC
News |
Chart |
Request a new note
C
A
S
I |
Symbol/Exchange
Company Name
Industry Group |
PRICE |
CHANGE
(%Change) |
Day High |
Volume
(% DAV)
(% 50 day avg vol) |
52 Wk Hi
% From Hi |
Featured
Date |
Price
Featured |
Pivot Featured |
|
Max Buy |
LGIH
-
NASDAQ
L G I Homes Inc
Bldg-Resident/Comml
|
$110.74
|
-1.75
-1.56% |
$115.73
|
178,536
55.79% of 50 DAV
50 DAV is 320,000
|
$123.94
-10.65%
|
7/7/2020
|
$99.19
|
PP = $95.82
|
|
MB = $100.61
|
Most Recent Note - 9/15/2020 5:14:01 PM
G - Quietly slumped to a close below its 50 DMA line ($111.82) with today's loss on light volume. More damaging losses below the 50 DMA line and recent lows would raise greater concerns and trigger technical sell signals. Reported Jun '20 quarterly earnings +21% on +4% sales revenues, breaking a streak of 4 comparisons above the +25% minimum guideline (C criteria).
>>> FEATURED STOCK ARTICLE : Homebuilder Halted Slide Near Prior Low and 50-Day Average - 9/8/2020 |
View all notes |
Set NEW NOTE alert |
Company Profile |
SEC
News |
Chart |
Request a new note
C
A
S
I |
NOW
-
NYSE
Servicenow Inc
Computer Sftwr-Enterprse
|
$473.96
|
+15.90
3.47% |
$474.32
|
1,096,591
64.02% of 50 DAV
50 DAV is 1,713,000
|
$501.82
-5.55%
|
8/20/2020
|
$453.34
|
PP = $454.79
|
|
MB = $477.53
|
Most Recent Note - 9/15/2020 5:17:34 PM
Y - Posted a 2nd consecutive gain today with below average volume, showing resilience after briefly undercutting the prior high ($454) and testing support at its 50 DMA line ($442). Fundamentals remain strong. More damaging losses may raise concerns and trigger a technical sell signal. See the latest FSU analysis for more details and an annotated graph.
>>> FEATURED STOCK ARTICLE : Tested Support at 50-Day Moving Average Line - 9/14/2020 |
View all notes |
Set NEW NOTE alert |
Company Profile |
SEC
News |
Chart |
Request a new note
C
A
S
I |
|
|
|
THESE ARE NOT BUY RECOMMENDATIONS!
Comments contained in the body of this report are technical
opinions only. The material herein has been obtained
from sources believed to be reliable and accurate, however,
its accuracy and completeness cannot be guaranteed.
This site is not an investment advisor, hence it does
not endorse or recommend any securities or other investments.
Any recommendation contained in this report may not
be suitable for all investors and it is not to be deemed
an offer or solicitation on our part with respect to
the purchase or sale of any securities. All trademarks,
service marks and trade names appearing in this report
are the property of their respective owners, and are
likewise used for identification purposes only.
This report is a service available
only to active Paid Premium Members.
You may opt-out of receiving report notifications
at any time. Questions or comments may be submitted
by writing to Premium Membership Services 665 S.E. 10 Street, Suite 201 Deerfield Beach, FL 33441-5634 or by calling 1-800-965-8307
or 954-785-1121.
|
|
|