You are not logged in.
This means you
CAN ONLY VIEW reports that were published prior to Sunday, February 25, 2024.
You
MUST UPGRADE YOUR MEMBERSHIP if you want to see any current reports.
AFTER MARKET UPDATE - MONDAY, SEPTEMBER 14TH, 2020
Previous After Market Report Next After Market Report >>>
|
|
|
|
DOW |
+327.69 |
27,993.33 |
+1.18% |
|
Volume |
859,978,549 |
+4% |
|
Volume |
3,694,956,500 |
+3% |
|
NASDAQ |
+206.77 |
11,060.32 |
+1.91% |
|
Advancers |
2,415 |
81% |
|
Advancers |
2,564 |
78% |
|
S&P 500 |
+42.57 |
3,383.54 |
+1.27% |
|
Decliners |
571 |
19% |
|
Decliners |
724 |
22% |
|
Russell 2000 |
+39.70 |
1,536.97 |
+2.65% |
|
52 Wk Highs |
60 |
|
|
52 Wk Highs |
56 |
|
|
S&P 600 |
+15.17 |
877.10 |
+1.76% |
|
52 Wk Lows |
12 |
|
|
52 Wk Lows |
25 |
|
|
 |
Major Indices Rose With Better Leadership and Higher Volume
Kenneth J. Gruneisen - Passed the CAN SLIM® Master's Exam
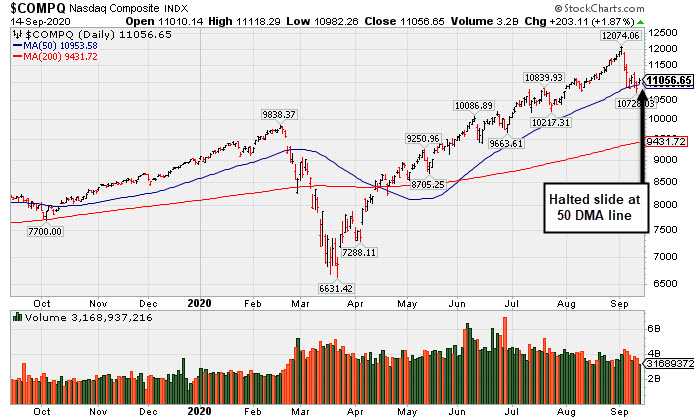
The Dow climbed 327 points, while the S&P 500 advanced 1.3%, on the heels of its first back-to-back weekly decline since May. The Nasdaq Composite jumped 1.9%, rebounding from its worst week since the pandemic-induced rout in March. Small caps also outperformed, with the Russell 2000 rising 2.7%, its best day in two months. The reported volume totals were higher than the prior session totals on the NYSE and on the Nasdaq exchange, an encouraging indication of a pickup in buying demand from the institutional crowd. Breadth was clearly positive as advancers led decliners by a 4-1 margin on the NYSE and more than 3-1 on the Nasdaq exchange. Leadership improved as 21 high-ranked companies from the Leaders List hit new 52-week highs and were listed on the BreakOuts Page, versus the total of 6 on the prior session. New 52-week highs totals expanded and easily outnumbered shrinking new 52-week lows on the NYSE and on the Nasdaq exchange. The major indices have seen their uptrend recently come under pressure (M criteria). Any sustainable rally requires a healthy crop of new leaders, so it remains very important to see more improvement in the new highs totals.
PICTURED: The Nasdaq Composite Index halted its slide at its 50-day moving average (DMA) line after a spurt of losses marked by higher volume.
Stocks finished firmly higher on Monday, as a flurry of M&A activity and positive coronavirus vaccine developments bolstered investor sentiment. All 11 S&P 500 sectors closed in positive territory, with the Information Technology group up more than 2%. In M&A news, Oracle (ORCL +4.32%) rose after winning the bid for the U.S. operations of TikTok, with the deal reportedly being structured as a partnership with Chinese parent ByteDance. NVIDIA (NVDA +5.82%) rose on news the semiconductor maker would purchase U.K.-based chip designer Arm from SoftBank (SFTBY +7.89%) for roughly $40 billion. Biotech company, Immunomedics, (IMMU +97.99%) saw its share price nearly double after agreeing to be purchased by Gilead Sciences (GILD +1.16%) for $21 billion.
In other corporate news, shares of AstraZeneca (AZN +0.54%) edged higher after resuming clinical trials of its COVID-19 vaccine in the U.K. following a brief pause last week caused by the unexplained illness of a participant. Meanwhile, Pfizer (PFE +2.61%) and BioNTech (BNTX +3.62%) proposed expanding the trial of its experimental coronavirus vaccine, while Pfizer’s CEO was optimistic a vaccine could be introduced before the end of the year.
Treasuries were little changed ahead of this week’s Federal Reserve policy meeting, with the yield on the 10-year note steady at 0.67%. In commodities, WTI crude ended slightly lower at $37.31/barrel, while COMEX gold gained 1% to $1,958.40/ounce. |
 Kenneth J. Gruneisen started out as a licensed stockbroker in August 1987, a couple of months prior to the historic stock market crash that took the Dow Jones Industrial Average down -22.6% in a single day. He has published daily fact-based fundamental and technical analysis on high-ranked stocks online for two decades. Through FACTBASEDINVESTING.COM, Kenneth provides educational articles, news, market commentary, and other information regarding proven investment systems that work in good times and bad.
Comments contained in the body of this report are technical opinions only and are not necessarily those of Gruneisen Growth Corp. The material herein has been obtained from sources believed to be reliable and accurate, however, its accuracy and completeness cannot be guaranteed. Our firm, employees, and customers may effect transactions, including transactions contrary to any recommendation herein, or have positions in the securities mentioned herein or options with respect thereto. Any recommendation contained in this report may not be suitable for all investors and it is not to be deemed an offer or solicitation on our part with respect to the purchase or sale of any securities. |
|
 |
Financial, Tech, and Commodity-Linked Groups Posted Solid Gains
Kenneth J. Gruneisen - Passed the CAN SLIM® Master's Exam
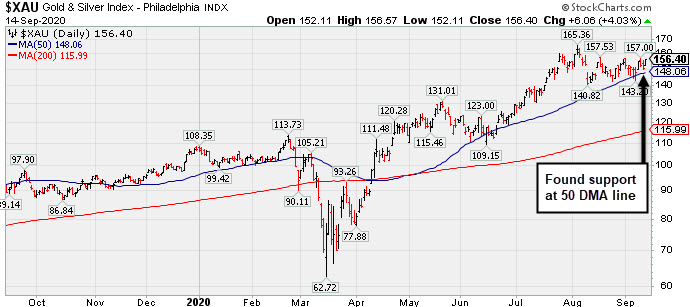
The Broker/Dealer Index ($XBD +1.42%) and Bank Index ($BKX +1.83%) both outpaced the Retail Index ($RLX +0.33%) on Monday. The tech sector was led higher by the Biotech Index ($BTK +3.96%) while the Semiconductor Index ($SOX +2.15%) and Networking Index ($NWX +1.27%) also notched gains. The Gold & Silver Index ($XAU +4.03%) posted a standout gain while the Oil Services Index ($OSX +1.10%) and Integrated Oil Index ($XOI +0.62%) posted smaller gains.
PICTURED: The Gold & Silver Index ($XAU +4.03%) posted a solid gain making its a standout on Monday. Its 50-day moving average (DMA) line has acted as support.
| Oil Services |
$OSX |
33.12 |
+0.36 |
+1.10% |
-57.70% |
| Integrated Oil |
$XOI |
659.72 |
+4.04 |
+0.62% |
-48.08% |
| Semiconductor |
$SOX |
2,182.28 |
+45.90 |
+2.15% |
+17.99% |
| Networking |
$NWX |
541.29 |
+6.79 |
+1.27% |
-7.22% |
| Broker/Dealer |
$XBD |
287.34 |
+4.02 |
+1.42% |
-1.05% |
| Retail |
$RLX |
3,382.02 |
+11.10 |
+0.33% |
+38.08% |
| Gold & Silver |
$XAU |
156.40 |
+6.06 |
+4.03% |
+46.27% |
| Bank |
$BKX |
77.73 |
+1.40 |
+1.83% |
-31.43% |
| Biotech |
$BTK |
5,355.85 |
+204.19 |
+3.96% |
+5.69% |
|
|
|
 |
Tested Support at 50-Day Moving Average Line
Kenneth J. Gruneisen - Passed the CAN SLIM® Master's Exam
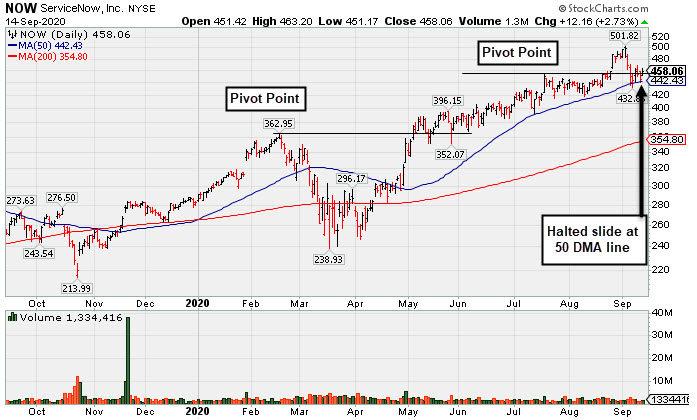
ServiceNow Inc (NOW +$12.16 or +2.73% to $458.06) found prompt support after briefly undercutting the prior high ($454) and testing support at its 50-day moving average (DMA) line ($442.42). More damaging losses may raise concerns and trigger a technical sell signal.
Fundamentals remain strong. Recently it reported Jun '20 quarterly earnings +73% on +28% sales revenues versus the year ago period. Results have been routinely above the +25% minimum earnings guideline (C criteria). It has an Earnings Per Share Rating of 99. The Computer Software - Enterprise group has a Group Relative Strength Rating of 92, a reassuring sign concerning the L criteria. NOW has a new CEO as of 1/01/20.
NOW has traded up as much as +46.28% since first highlighted in yellow in the 4/30/20 mid-day report with a pivot point based on its 2/19/20 high plus 10 cents (read here). It was last shown in this FSU section on 8/28/20 with an annotated graph under the headline, "Quiet Gain to New High for Computer Software Firm". The number of top-rated funds owning its shares rose from 1,030 in Jun '17 to 2.285 in Jun '20, a reassuring sign concerning the I criteria. It has a Timeliness Rating of A and a Sponsorship Rating of A. Its current Up/Down Volume Ratio of 1.0 is an unbiased indication its shares have been neutral concerning accumulation/distribution over the past 50 days. |
|
|
Color Codes Explained :
Y - Better candidates highlighted by our
staff of experts.
G - Previously featured
in past reports as yellow but may no longer be buyable under the
guidelines.
***Last / Change / Volume data in this table is the closing quote data***
Symbol/Exchange
Company Name
Industry Group |
PRICE |
CHANGE
(%Change) |
Day High |
Volume
(% DAV)
(% 50 day avg vol) |
52 Wk Hi
% From Hi |
Featured
Date |
Price
Featured |
Pivot Featured |
|
Max Buy |
 ADBE
-
NASDAQ
ADBE
-
NASDAQ
Adobe Inc
COMPUTER SOFTWARE and SERVICES - Application Software
|
$485.91
|
+14.56
3.09% |
$490.44
|
4,058,426
147.04% of 50 DAV
50 DAV is 2,760,000
|
$536.88
-9.49%
|
9/10/2020
|
$488.46
|
PP = $536.88
|
|
MB = $563.72
|
 Most Recent Note - 9/14/2020 12:13:52 PM
Y - Posting a gain today after a spurt of volume-driven losses. Encountered distributional pressure and had a "negative reversal on 9/10/20. Since finding support at its 10 week-moving average (WMA), a valid secondary buy point exists up to 5% above the latest high. Subsequent losses violating its 50 DMA line ($462.54) may trigger a technical sell signal. Disciplined investors always limit losses by selling any stock that falls more than 7-8% from their purchase price. Due to report Aug '20 quarterly results on 9/15/20. Volume and volatility often increase near earnings news. This well-known Computer Software - Desktop firm reported May '20 quarterly earnings +34% on +14% sales revenues, its 3rd consecutive quarterly earnings increase above the +25% minimum guideline (C criteria). Annual earnings history (A criteria) has been strong and steady. See the latest FSU analysis for more details and an annotated graph.
>>> FEATURED STOCK ARTICLE : Adobe Found Support Following Recent Breakout - 9/10/2020 |
View all notes |
Set NEW NOTE alert |
Company Profile |
SEC
News |
Chart |
Request a new note
C
A
S
I |
CRL
-
NYSE
Charles River Labs Intl
DRUGS - Biotechnology
|
$220.01
|
+2.50
1.15% |
$221.39
|
271,352
81.24% of 50 DAV
50 DAV is 334,000
|
$221.97
-0.88%
|
7/15/2020
|
$192.66
|
PP = $189.95
|
|
MB = $199.45
|
Most Recent Note - 9/14/2020 5:47:37 PM
G - Showed resilience last week and with today's 4th consecutive gain it challenged previously stubborn resistance in the $221 area. Found prompt support at its 50 DMA line ($206) after volume-driven losses. More damaging losses would raise greater concerns and trigger a technical sell signal. Recently reported Jun '20 quarterly earnings -3% on +4% sales revenues, below the +25% minimum guideline (C criteria), but better than expected while the company also raised its guidance.
>>> FEATURED STOCK ARTICLE : Found Prompt Support at 50-Day Moving Average Line - 9/11/2020 |
View all notes |
Set NEW NOTE alert |
Company Profile |
SEC
News |
Chart |
Request a new note
C
A
S
I |
AMD
-
NASDAQ
Advanced Micro Devices
ELECTRONICS - Semiconductor - Broad Line
|
$77.90
|
+1.56
2.04% |
$78.82
|
47,328,170
72.96% of 50 DAV
50 DAV is 64,871,000
|
$94.28
-17.37%
|
8/31/2020
|
$90.42
|
PP = $87.39
|
|
MB = $91.76
|
Most Recent Note - 9/14/2020 5:46:10 PM
Y - Posted a gain today with lighter volume. Undercut recent lows in the $76 area last week raising concerns while slumping toward its 50 DMA line ($74.25). More damaging losses leading to a 50 DMA line violation may trigger a worrisome technical sell signal. Fundamentals remain strong.
>>> FEATURED STOCK ARTICLE : Perched at All-Time High After Another Bullish Breakout - 9/2/2020 |
View all notes |
Set NEW NOTE alert |
Company Profile |
SEC
News |
Chart |
Request a new note
C
A
S
I |
TREX
-
NYSE
Trex Company Inc
MATERIALS and CONSTRUCTION - General Building Materials
|
$139.90
|
+5.58
4.15% |
$140.16
|
637,948
103.73% of 50 DAV
50 DAV is 615,000
|
$156.63
-10.68%
|
6/26/2020
|
$109.05
|
PP = $132.94
|
|
MB = $139.59
|
Most Recent Note - 9/14/2020 5:44:45 PM
G - Rebounded above its 50 DMA line ($139) line with today's big gain on average volume helping its outlook improve. The recent low ($131.20 on 9/08/20) defines the next important support level to watch. Fundamentals remain strong.
>>> FEATURED STOCK ARTICLE : Fall Below "Max Buy" Level Also Undercut 50-Day Moving Average - 9/4/2020 |
View all notes |
Set NEW NOTE alert |
Company Profile |
SEC
News |
Chart |
Request a new note
C
A
S
I |
NFLX
-
NASDAQ
Netflix Inc
SPECIALTY RETAIL - Music and Video Stores
|
$476.26
|
-5.77
-1.20% |
$488.99
|
7,235,292
91.52% of 50 DAV
50 DAV is 7,906,000
|
$575.37
-17.23%
|
9/1/2020
|
$547.45
|
PP = $575.47
|
|
MB = $604.24
|
Most Recent Note - 9/14/2020 5:43:21 PM
G - Slumped further below its 50 DMA line ($501) with today's loss. Prior low ($466.55 on 8/11/20) defines the next important chart support level where more damaging losses would raise serious concerns and trigger a more worrisome technical sell signal. A prompt rebound above the 50 DMA line is needed for its outlook to improve.
>>> FEATURED STOCK ARTICLE : Pulling Back After Best Ever Close on Tuesday - 9/3/2020 |
View all notes |
Set NEW NOTE alert |
Company Profile |
SEC
News |
Chart |
Request a new note
C
A
S
I |
Symbol/Exchange
Company Name
Industry Group |
PRICE |
CHANGE
(%Change) |
Day High |
Volume
(% DAV)
(% 50 day avg vol) |
52 Wk Hi
% From Hi |
Featured
Date |
Price
Featured |
Pivot Featured |
|
Max Buy |
LGIH
-
NASDAQ
L G I Homes Inc
Bldg-Resident/Comml
|
$112.49
|
-0.04
-0.04% |
$115.41
|
205,514
64.02% of 50 DAV
50 DAV is 321,000
|
$123.94
-9.24%
|
7/7/2020
|
$99.19
|
PP = $95.82
|
|
MB = $100.61
|
Most Recent Note - 9/14/2020 5:40:40 PM
G - Consolidating near its 50 DMA line ($111.45). More damaging losses below the 50 DMA line and recent lows would raise greater concerns and trigger technical sell signals. Reported Jun '20 quarterly earnings +21% on +4% sales revenues, breaking a streak of 4 comparisons above the +25% minimum guideline (C criteria).
>>> FEATURED STOCK ARTICLE : Homebuilder Halted Slide Near Prior Low and 50-Day Average - 9/8/2020 |
View all notes |
Set NEW NOTE alert |
Company Profile |
SEC
News |
Chart |
Request a new note
C
A
S
I |
NOW
-
NYSE
Servicenow Inc
Computer Sftwr-Enterprse
|
$458.06
|
+12.16
2.73% |
$463.20
|
1,334,416
77.94% of 50 DAV
50 DAV is 1,712,000
|
$501.82
-8.72%
|
8/20/2020
|
$453.34
|
PP = $454.79
|
|
MB = $477.53
|
Most Recent Note - 9/14/2020 5:38:57 PM
Y - Showing resilience after briefly undercutting the prior high ($454) and testing support at its 50 DMA line ($442). Fundamentals remain strong. More damaging losses may raise concerns and trigger a technical sell signal. See the latest FSU analysis for more details and a new annotated graph.
>>> FEATURED STOCK ARTICLE : Tested Support at 50-Day Moving Average Line - 9/14/2020 |
View all notes |
Set NEW NOTE alert |
Company Profile |
SEC
News |
Chart |
Request a new note
C
A
S
I |
|
|
|
THESE ARE NOT BUY RECOMMENDATIONS!
Comments contained in the body of this report are technical
opinions only. The material herein has been obtained
from sources believed to be reliable and accurate, however,
its accuracy and completeness cannot be guaranteed.
This site is not an investment advisor, hence it does
not endorse or recommend any securities or other investments.
Any recommendation contained in this report may not
be suitable for all investors and it is not to be deemed
an offer or solicitation on our part with respect to
the purchase or sale of any securities. All trademarks,
service marks and trade names appearing in this report
are the property of their respective owners, and are
likewise used for identification purposes only.
This report is a service available
only to active Paid Premium Members.
You may opt-out of receiving report notifications
at any time. Questions or comments may be submitted
by writing to Premium Membership Services 665 S.E. 10 Street, Suite 201 Deerfield Beach, FL 33441-5634 or by calling 1-800-965-8307
or 954-785-1121.
|
|
|