You are not logged in.
This means you
CAN ONLY VIEW reports that were published prior to Sunday, February 25, 2024.
You
MUST UPGRADE YOUR MEMBERSHIP if you want to see any current reports.
AFTER MARKET UPDATE - FRIDAY, SEPTEMBER 11TH, 2020
Previous After Market Report Next After Market Report >>>
|
|
|
|
DOW |
+131.06 |
27,665.64 |
+0.48% |
|
Volume |
826,689,817 |
-9% |
|
Volume |
3,587,580,600 |
-6% |
|
NASDAQ |
-62.19 |
10,857.40 |
-0.57% |
|
Advancers |
1,371 |
47% |
|
Advancers |
1,335 |
41% |
|
S&P 500 |
+1.78 |
3,340.97 |
+0.05% |
|
Decliners |
1,531 |
53% |
|
Decliners |
1,899 |
59% |
|
Russell 2000 |
-10.48 |
1,497.27 |
-0.70% |
|
52 Wk Highs |
32 |
|
|
52 Wk Highs |
36 |
|
|
S&P 600 |
-5.60 |
861.93 |
-0.65% |
|
52 Wk Lows |
24 |
|
|
52 Wk Lows |
39 |
|
|
The market's rally has clearly come under pressure while leadership has abruptly contracted, as noted in bold in recent commentaries. More damaging losses may prompt investors to reduce market exposure and raise cash if the recent volatility has not already forced disciplined investors to do so.
|
 |
Lighter Volume Totals as Leadership Gets Even Thinner
Kenneth J. Gruneisen - Passed the CAN SLIM® Master's Exam
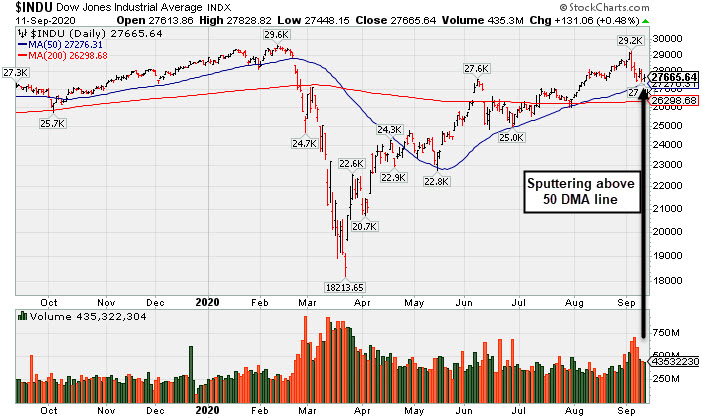
The Dow added 131 points to trim its weekly loss to 1.7%. The S&P 500 eked out a gain of less than 0.1%, still capping its first back-to-back weekly decline since May (-2.5%). The Nasdaq Composite fell 0.6%, closing in correction territory, as it remains 10% below its September 2 all-time high. Friday's reported volume totals were lighter than the prior session totals on the NYSE and on the Nasdaq exchange, an encouraging indication of less serious selling pressure from the institutional crowd. Breadth was slightly negative as decliners led advancers by an 8-7 margin on the NYSE and 3-2 on the Nasdaq exchange. Leadership thinned as only 6 high-ranked companies from the Leaders List hit new 52-week highs and were listed on the BreakOuts Page, versus the total of 12 on the prior session. New 52-week highs totals outnumbered new 52-week lows on the NYSE but new lows outnumbered new highs on the Nasdaq exchange for the 4th time in the past 6 sessions. The major indices have seen their uptrend recently come under pressure (M criteria). Any sustainable rally requires a healthy crop of new leaders, so it will be very important to see substantial improvement in the new highs totals soon.
PICTURED: The Dow Jones Industrial Average has pulled back after challenging its February high and it is sputtering just above its 50-day moving average (DMA) line after a spurt of losses marked by higher volume.
U.S. equities finished mixed on Friday, as Wall Street closed out a volatile week. The Tech-heavy Nasdaq Composite index shed 4.1% for the week, its worst such stretch since the pandemic-induced rout in March. Despite the recent weakness in Tech-focused shares, the Nasdaq Composite remains 21% higher year-to-date. The Nasdaq 100 posted a 4.6% slide for the week, with the mega-cap gauge having notched daily moves of at least 1% during every trading session this month.
Seven of 11 S&P 500 sectors ended in positive territory, with Technology losing the most. Shares of Apple (AAPL -1.31%), Microsoft (MSFT -0.65%) , and Amazon (AMZN -1.85%) extended last week’s downturn, shedding between 4.8% and 7.5% for the week. In earnings, Oracle (ORCL -0.58%) posted stronger-than-forecasted results that included upbeat forward guidance, but the software giant had an ugly "negative reversal" for a loss on heavy volume after starting the session gapping up for a record high.
On the data front, consumer prices advanced for the third-straight month in August, with the headline CPI figure coming in at 0.4%. Core CPI (excluding food and energy) rose 1.7% year-over-year, slightly ahead of July’s 1.6% pace. Treasuries strengthened, with the yield on the 10-year note down one basis point to 0.67%. In commodities, WTI crude edged higher, but still posted a second consecutive weekly decline. |
 Kenneth J. Gruneisen started out as a licensed stockbroker in August 1987, a couple of months prior to the historic stock market crash that took the Dow Jones Industrial Average down -22.6% in a single day. He has published daily fact-based fundamental and technical analysis on high-ranked stocks online for two decades. Through FACTBASEDINVESTING.COM, Kenneth provides educational articles, news, market commentary, and other information regarding proven investment systems that work in good times and bad.
Comments contained in the body of this report are technical opinions only and are not necessarily those of Gruneisen Growth Corp. The material herein has been obtained from sources believed to be reliable and accurate, however, its accuracy and completeness cannot be guaranteed. Our firm, employees, and customers may effect transactions, including transactions contrary to any recommendation herein, or have positions in the securities mentioned herein or options with respect thereto. Any recommendation contained in this report may not be suitable for all investors and it is not to be deemed an offer or solicitation on our part with respect to the purchase or sale of any securities. |
|
 |
Bank, Networking, Biotech, and Integrated Oil Indexes Rose
Kenneth J. Gruneisen - Passed the CAN SLIM® Master's Exam
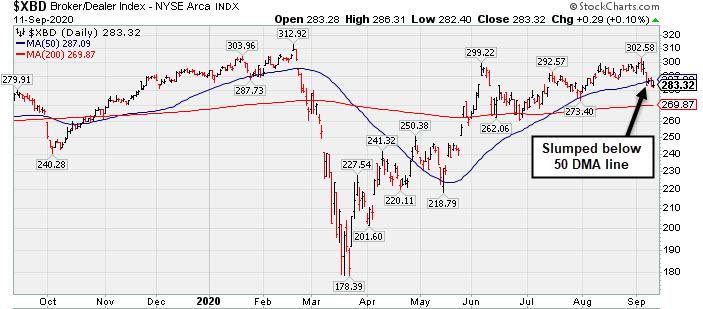
The Bank Index ($BKX +1.39%) rose but the Broker/Dealer Index ($XBD +0.10%) was little changed and the Retail Index ($RLX -0.75%) created a drag on the major indices. The Networking Index ($NWX +1.02%) and Biotech Index ($BTK +0.45%) posted small gains while the Semiconductor Index ($SOX -0.07%) finished flat. Commodity-linked groups were mixed as the Gold & Silver Index ($XAU -1.32%) fell while the Oil Services Index ($OSX -0.02%) finished flat and the Integrated Oil Index ($XOI +0.82%) rose.
PICTURED: The Broker/Dealer Index ($XBD +0.10%) has slumped below its 50-day moving average (DMA) line which previously acted as support.
| Oil Services |
$OSX |
32.74 |
-0.01 |
-0.02% |
-58.18% |
| Integrated Oil |
$XOI |
655.67 |
+5.33 |
+0.82% |
-48.39% |
| Semiconductor |
$SOX |
2,136.37 |
-1.41 |
-0.07% |
+15.50% |
| Networking |
$NWX |
534.50 |
+5.39 |
+1.02% |
-8.38% |
| Broker/Dealer |
$XBD |
283.32 |
+0.29 |
+0.10% |
-2.43% |
| Retail |
$RLX |
3,370.92 |
-25.38 |
-0.75% |
+37.63% |
| Gold & Silver |
$XAU |
150.34 |
-2.01 |
-1.32% |
+40.61% |
| Bank |
$BKX |
76.34 |
+1.05 |
+1.39% |
-32.66% |
| Biotech |
$BTK |
5,151.56 |
+23.07 |
+0.45% |
+1.66% |
|
|
|
 |
Found Prompt Support at 50-Day Moving Average Line
Kenneth J. Gruneisen - Passed the CAN SLIM® Master's Exam
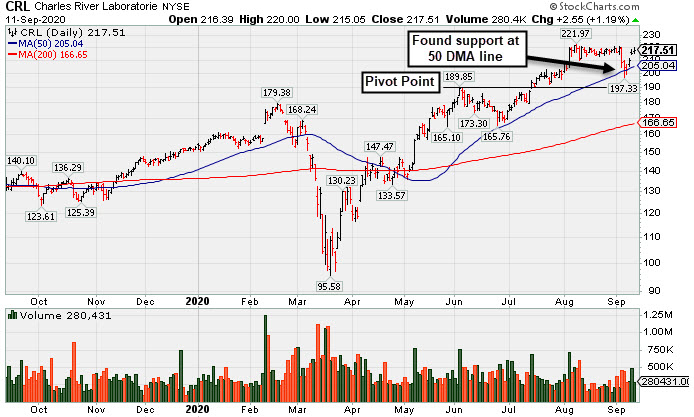
Charles River Labs Intl (CRL +$2.55 or +1.19% to $217.51) showed resilience this week and rebounded near its all-time high with 3 consecutive gains. It found prompt support at its 50-day moving average (DMA) line ($205.04) after a spurt of volume-driven losses. Subsequent losses leading to a violation of the 50 DMA line and prior low ($197.33 on 9.04/20) may raise greater concerns and trigger technical sell signals.
Recently it raised fundamental concerns after it reported Jun '20 quarterly earnings -3% on +4% sales revenues, below the +25% minimum guideline (C criteria), but the results were better than expected and the company also raised its guidance. It now has a 92 Earnings Per Share Rating, down from 96 prior to the report. The 2 prior quarterly earnings increases were above the +25% minimum guideline (C criteria) of the fact-based investment system. Annual earnings (A criteria) history has been strong and steady.
It hails from the Medical - Research Equipment/Services industry group which has an 74 Group Relative Strength Rating (L criteria). The number of top-rated funds owning its shares rose from 681 in Dec '19 to 755 in Jun '20, and its Up/Down Volume Ratio is 1.3, an unbiased indication its shares have been under accumulation over the past 50 days. There is a small number of only 49.7 million shares (S criteria) outstanding, which can contribute to greater price volatility in the event of institutional buying or selling.
|
|
|
Color Codes Explained :
Y - Better candidates highlighted by our
staff of experts.
G - Previously featured
in past reports as yellow but may no longer be buyable under the
guidelines.
***Last / Change / Volume data in this table is the closing quote data***
Symbol/Exchange
Company Name
Industry Group |
PRICE |
CHANGE
(%Change) |
Day High |
Volume
(% DAV)
(% 50 day avg vol) |
52 Wk Hi
% From Hi |
Featured
Date |
Price
Featured |
Pivot Featured |
|
Max Buy |
 ADBE
-
NASDAQ
ADBE
-
NASDAQ
Adobe Inc
COMPUTER SOFTWARE and SERVICES - Application Software
|
$471.35
|
-4.91
-1.03% |
$489.41
|
4,291,300
157.54% of 50 DAV
50 DAV is 2,724,000
|
$536.88
-12.21%
|
9/10/2020
|
$488.46
|
PP = $536.88
|
|
MB = $563.72
|
 Most Recent Note - 9/11/2020 12:01:44 PM
Y - Pulling back after today's early gain. Encountered distributional pressure and had a "negative reversal on the prior session with above average volume. Since finding support at its 10 week-moving average (WMA), a valid secondary buy point exists up to 5% above the latest high. Subsequent losses violating its 50 DMA line ($461.77) may trigger a technical sell signal. Disciplined investors always limit losses by selling any stock that falls more than 7-8% from their purchase price. Due to report Aug '20 quarterly results on 9/15/20. Volume and volatility often increase near earnings news. This well-known Computer Software - Desktop firm reported May '20 quarterly earnings +34% on +14% sales revenues, its 3rd consecutive quarterly earnings increase above the +25% minimum guideline (C criteria). Annual earnings history (A criteria) has been strong and steady. See the latest FSU analysis for more details and an annotated graph.
>>> FEATURED STOCK ARTICLE : Adobe Found Support Following Recent Breakout - 9/10/2020 |
View all notes |
Set NEW NOTE alert |
Company Profile |
SEC
News |
Chart |
Request a new note
C
A
S
I |
CRL
-
NYSE
Charles River Labs Intl
DRUGS - Biotechnology
|
$217.51
|
+2.55
1.19% |
$220.00
|
280,431
83.71% of 50 DAV
50 DAV is 335,000
|
$221.97
-2.01%
|
7/15/2020
|
$192.66
|
PP = $189.95
|
|
MB = $199.45
|
Most Recent Note - 9/11/2020 4:52:23 PM
G - Showed resilience this week with 3 consecutive gains challenging previously stubborn resistance in the $221 area. Found prompt support at its 50 DMA line ($205) after volume-driven losses. More damaging losses would raise greater concerns and trigger a technical sell signal. Recently reported Jun '20 quarterly earnings -3% on +4% sales revenues, below the +25% minimum guideline (C criteria), but better than expected while the company also raised its guidance. See the latest FSU analysis for more details and a new annotated graph.
>>> FEATURED STOCK ARTICLE : Found Prompt Support at 50-Day Moving Average Line - 9/11/2020 |
View all notes |
Set NEW NOTE alert |
Company Profile |
SEC
News |
Chart |
Request a new note
C
A
S
I |
EBS
-
NYSE
Emergent Biosolutions
DRUGS - Biotechnology
|
$98.08
|
-0.92
-0.93% |
$104.32
|
906,825
92.91% of 50 DAV
50 DAV is 976,000
|
$137.61
-28.73%
|
7/7/2020
|
$89.47
|
PP = $93.68
|
|
MB = $98.36
|
Most Recent Note - 9/11/2020 5:04:22 PM
Still slumping after violating its prior high $107.16 on 7/20/20) and its 50 DMA line ($109.81) during a spurt of 14 losses over the span of 16 sessions. A rebound above its 50 DMA line is needed for its outlook to improve. Fundamentals remain strong. It is now -28.7% off its all-time high and will be dropped from the Featured Stocks list tonight.
>>> FEATURED STOCK ARTICLE : Recently Sputtering Below 50-Day Moving Average - 9/9/2020 |
View all notes |
Set NEW NOTE alert |
Company Profile |
SEC
News |
Chart |
Request a new note
C
A
S
I |
AMD
-
NASDAQ
Advanced Micro Devices
ELECTRONICS - Semiconductor - Broad Line
|
$76.34
|
-2.64
-3.34% |
$79.99
|
54,455,635
84.53% of 50 DAV
50 DAV is 64,423,000
|
$94.28
-19.03%
|
8/31/2020
|
$90.42
|
PP = $87.39
|
|
MB = $91.76
|
Most Recent Note - 9/11/2020 4:57:55 PM
Y - Undercut recent lows in the $76 area with today's loss raising concerns while slumping toward its 50 DMA line ($73.74). More damaging losses leading to a 50 DMA line violation may trigger a worrisome technical sell signal. Fundamentals remain strong.
>>> FEATURED STOCK ARTICLE : Perched at All-Time High After Another Bullish Breakout - 9/2/2020 |
View all notes |
Set NEW NOTE alert |
Company Profile |
SEC
News |
Chart |
Request a new note
C
A
S
I |
TREX
-
NYSE
Trex Company Inc
MATERIALS and CONSTRUCTION - General Building Materials
|
$134.32
|
-3.37
-2.45% |
$139.04
|
480,371
76.98% of 50 DAV
50 DAV is 624,000
|
$156.63
-14.24%
|
6/26/2020
|
$109.05
|
PP = $132.94
|
|
MB = $139.59
|
Most Recent Note - 9/11/2020 5:01:22 PM
G - Violated its 50 DMA line ($138.76) line with losses after gains lacking great volume conviction, again raising concerns. Only a prompt rebound would help its outlook improve. The recent low ($131.20 on 9/08/20) defines the next important support level to watch. Fundamentals remain strong.
>>> FEATURED STOCK ARTICLE : Fall Below "Max Buy" Level Also Undercut 50-Day Moving Average - 9/4/2020 |
View all notes |
Set NEW NOTE alert |
Company Profile |
SEC
News |
Chart |
Request a new note
C
A
S
I |
Symbol/Exchange
Company Name
Industry Group |
PRICE |
CHANGE
(%Change) |
Day High |
Volume
(% DAV)
(% 50 day avg vol) |
52 Wk Hi
% From Hi |
Featured
Date |
Price
Featured |
Pivot Featured |
|
Max Buy |
NFLX
-
NASDAQ
Netflix Inc
SPECIALTY RETAIL - Music and Video Stores
|
$482.03
|
+1.36
0.28% |
$493.73
|
5,009,124
62.62% of 50 DAV
50 DAV is 7,999,000
|
$575.37
-16.22%
|
9/1/2020
|
$547.45
|
PP = $575.47
|
|
MB = $604.24
|
Most Recent Note - 9/10/2020 3:41:35 PM
G - Color code is changed to green while violating its 50 DMA line ($501.73) with today's 6th consecutive loss with near average or lighter volume raising concerns and triggering a technical sell signal. A prompt rebound above the 50 DMA line is needed for its outlook to improve.
>>> FEATURED STOCK ARTICLE : Pulling Back After Best Ever Close on Tuesday - 9/3/2020 |
View all notes |
Set NEW NOTE alert |
Company Profile |
SEC
News |
Chart |
Request a new note
C
A
S
I |
LGIH
-
NASDAQ
L G I Homes Inc
Bldg-Resident/Comml
|
$112.53
|
+0.93
0.83% |
$114.42
|
201,258
62.70% of 50 DAV
50 DAV is 321,000
|
$123.94
-9.21%
|
7/7/2020
|
$99.19
|
PP = $95.82
|
|
MB = $100.61
|
Most Recent Note - 9/9/2020 4:58:09 PM
G - Retreated from its 52-week high but halted its near its 50 DMA line ($109.97) and posted 2 consecutive gains on lighter volume. More damaging losses would raise greater concerns. Reported Jun '20 quarterly earnings +21% on +4% sales revenues, breaking a streak of 4 comparisons above the +25% minimum guideline (C criteria).
>>> FEATURED STOCK ARTICLE : Homebuilder Halted Slide Near Prior Low and 50-Day Average - 9/8/2020 |
View all notes |
Set NEW NOTE alert |
Company Profile |
SEC
News |
Chart |
Request a new note
C
A
S
I |
NOW
-
NYSE
Servicenow Inc
Computer Sftwr-Enterprse
|
$445.90
|
-7.08
-1.56% |
$458.49
|
893,085
51.62% of 50 DAV
50 DAV is 1,730,000
|
$501.82
-11.14%
|
8/20/2020
|
$453.34
|
PP = $454.79
|
|
MB = $477.53
|
Most Recent Note - 9/9/2020 6:06:16 PM
Y - Rebounded today after briefly undercutting the prior high ($454) and testing support at its 50 DMA line ($440). Fundamentals remain strong. More damaging losses may raise concerns and trigger a technical sell signal.
>>> FEATURED STOCK ARTICLE : Quiet Gain to New High for Computer Software Firm - 8/28/2020 |
View all notes |
Set NEW NOTE alert |
Company Profile |
SEC
News |
Chart |
Request a new note
C
A
S
I |
DOCU
-
NASDAQ
Docusign Inc
Computer Sftwr-Enterprse
|
$197.94
|
-8.01
-3.89% |
$208.66
|
8,068,919
126.59% of 50 DAV
50 DAV is 6,374,000
|
$290.23
-31.80%
|
6/10/2020
|
$149.73
|
PP = $152.10
|
|
MB = $159.71
|
Most Recent Note - 9/11/2020 4:55:25 PM
Slumped below its 50 DMA line ($208) with today's loss backed by +27% above average volume. Only a prompt rebound above the 50 DMA line would help its outlook improve. It is now -31.8% off its all-time high and will be dropped from the Featured Stocks list tonight. The prior low ($189.12 on 8/12/20) defines the next important near-term support to watch.
>>> FEATURED STOCK ARTICLE : Perched Near All-Time High After Finding Support Above 50 DMA - 8/31/2020 |
View all notes |
Set NEW NOTE alert |
Company Profile |
SEC
News |
Chart |
Request a new note
C
A
S
I |
|
|
|
THESE ARE NOT BUY RECOMMENDATIONS!
Comments contained in the body of this report are technical
opinions only. The material herein has been obtained
from sources believed to be reliable and accurate, however,
its accuracy and completeness cannot be guaranteed.
This site is not an investment advisor, hence it does
not endorse or recommend any securities or other investments.
Any recommendation contained in this report may not
be suitable for all investors and it is not to be deemed
an offer or solicitation on our part with respect to
the purchase or sale of any securities. All trademarks,
service marks and trade names appearing in this report
are the property of their respective owners, and are
likewise used for identification purposes only.
This report is a service available
only to active Paid Premium Members.
You may opt-out of receiving report notifications
at any time. Questions or comments may be submitted
by writing to Premium Membership Services 665 S.E. 10 Street, Suite 201 Deerfield Beach, FL 33441-5634 or by calling 1-800-965-8307
or 954-785-1121.
|
|
|