You are not logged in.
This means you
CAN ONLY VIEW reports that were published prior to Saturday, February 17, 2024.
You
MUST UPGRADE YOUR MEMBERSHIP if you want to see any current reports.
AFTER MARKET UPDATE - TUESDAY, SEPTEMBER 10TH, 2019
Previous After Market Report Next After Market Report >>>
|
|
|
|
DOW |
+73.92 |
26,909.43 |
+0.28% |
|
Volume |
938,221,960 |
+5% |
|
Volume |
2,338,073,570 |
+9% |
|
NASDAQ |
-3.28 |
8,084.16 |
-0.04% |
|
Advancers |
1,643 |
58% |
|
Advancers |
1,975 |
65% |
|
S&P 500 |
+0.96 |
2,979.39 |
+0.03% |
|
Decliners |
1,174 |
42% |
|
Decliners |
1,081 |
35% |
|
Russell 2000 |
+18.76 |
1,542.99 |
+1.23% |
|
52 Wk Highs |
82 |
|
|
52 Wk Highs |
48 |
|
|
S&P 600 |
+11.52 |
954.91 |
+1.22% |
|
52 Wk Lows |
10 |
|
|
52 Wk Lows |
42 |
|
|
 |
Major Indices Sputtered With Less Leadership
Kenneth J. Gruneisen - Passed the CAN SLIM® Master's Exam
The Dow extended its winning streak to five days, erasing early session losses to close up 73 points. The S&P 500 ended the session just above the flat line, while the Nasdaq Composite was down less than 0.1%. Volume totals reported were higher than the prior session totals on the NYSE and on the Nasdaq exchange. Breadth was positive as advancers led decliners by a 4-3 margin on the NYSE and nearly 2-1 on the Nasdaq exchange. Leadership thinned as there were 26 high-ranked companies from the Leaders List hit new 52-week highs and were listed on the BreakOuts Page, versus the total of 46 on the prior session. And again, new 52-week highs totals contracted, yet new highs still outnumbered new 52-week lows totals on the NYSE and on the Nasdaq exchange. Concerning the M criteria of the fact-based investment system, investors have a green light to make carefully selected new buying efforts. The Featured Stocks Page provides the most timely analysis on high-ranked leaders. Charts used courtesy of www.stockcharts.com
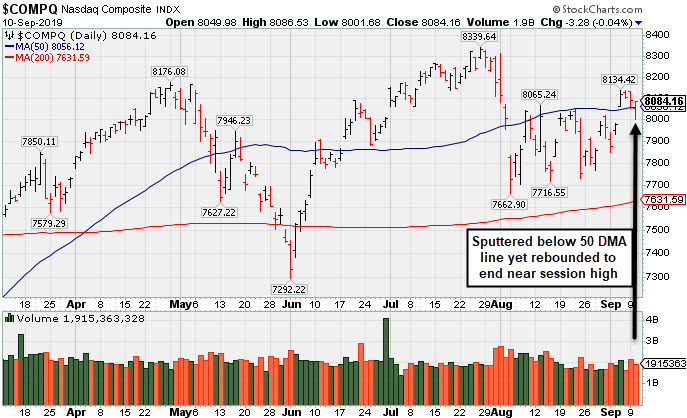
PICTURED: The Nasdaq Composite Index sputtered below its 50-day moving average (DMA) line yet rebounded to end near the session high. It is perched -3.14% off its record high hit on 7/26/19.
Stocks finished mixed Tuesday, as investors digested corporate updates and economic releases. Six of 11 S&P 500 sectors closed in positive territory, with Industrials and Energy stocks advancing more than 1%. Technology and Consumer Discretionary shares lagged. In corporate news, Ford Motor (F -1.26%) fell after Moody’s Investors Service downgraded the company’s credit rating into junk territory, citing profit margin and cash flow concerns. Netflix (NFLX -2.16%) fell after Apple (AAPL +1.18%) unveiled its competing subscription TV service.
On the data front, a gauge of small business optimism fell to a five-month low in August. Separately, the Jobs Openings and Labor Turnover Survey (JOLTS) showed job openings decreased for the second consecutive month in July. Treasuries extended their recent slump amid improved risk sentiment, with the yield on the benchmark 10-year note surging 10 basis points to 1.73%, the highest level in at least four weeks. This followed moves in Germany’s sovereign debt, with the yield on the nation’s 30-year bund briefly climbing into positive territory amid heightened expectations of fiscal stimulus from Europe’s largest economy. WTI crude erased earlier gains to finish down 0.8% to $57.40/barrel.
Market participants also awaited further central bank updates, with the European Central Bank widely anticipated to cut its benchmark interest rate Thursday, while the U.S. Federal Reserve is set to meet next week.
|
 Kenneth J. Gruneisen started out as a licensed stockbroker in August 1987, a couple of months prior to the historic stock market crash that took the Dow Jones Industrial Average down -22.6% in a single day. He has published daily fact-based fundamental and technical analysis on high-ranked stocks online for two decades. Through FACTBASEDINVESTING.COM, Kenneth provides educational articles, news, market commentary, and other information regarding proven investment systems that work in good times and bad.
Comments contained in the body of this report are technical opinions only and are not necessarily those of Gruneisen Growth Corp. The material herein has been obtained from sources believed to be reliable and accurate, however, its accuracy and completeness cannot be guaranteed. Our firm, employees, and customers may effect transactions, including transactions contrary to any recommendation herein, or have positions in the securities mentioned herein or options with respect thereto. Any recommendation contained in this report may not be suitable for all investors and it is not to be deemed an offer or solicitation on our part with respect to the purchase or sale of any securities. |
|
 |
Financial, Tech, and Energy-Linked Groups Rose
Kenneth J. Gruneisen - Passed the CAN SLIM® Master's Exam
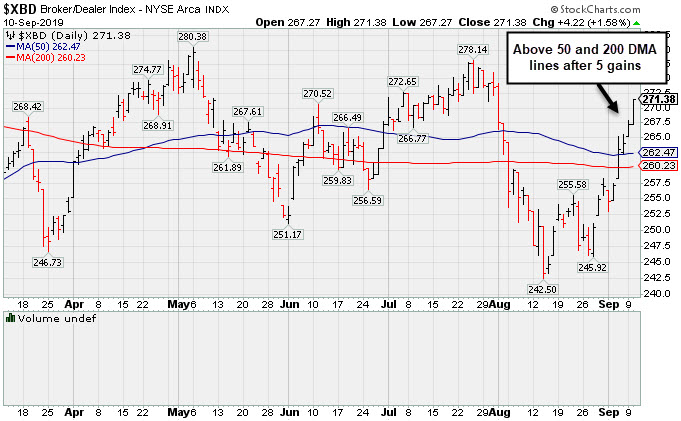
The Bank Index ($BKX +1.70%) and the Broker/Dealer Index ($XBD +1.58%) both posted gains while the Retail Index ($RLX -0.01%) finished flat. The tech sector had a positive bias as the Biotech Index ($BTK +1.76%) and the Networking Index ($NWX +1.14%) both outpaced the Semiconductor Index ($SOX +0.43%). Commodity-linked groups were mixed as the Oil Services Index ($OSX +1.21%) and the Integrated Oil Index ($XOI +1.49%) rose, but the Gold & Silver Index ($XAU -0.36%) edged lower making it a standout decliner for the fourth consecutive session.
PICTURED: The Broker/Dealer Index ($XBD +1.58%) rebounded further above its 50-day and 200-day moving average (DMA) lines with a 5th consecutive gain. It has rallied impressively from recent low, posting 8 gains in the span of 9 sessions.
| Oil Services |
$OSX |
71.78 |
+0.87 |
+1.23% |
-10.94% |
| Integrated Oil |
$XOI |
1,227.35 |
+18.06 |
+1.49% |
+5.89% |
| Semiconductor |
$SOX |
1,583.15 |
+6.76 |
+0.43% |
+37.05% |
| Networking |
$NWX |
565.06 |
+6.34 |
+1.14% |
+15.63% |
| Broker/Dealer |
$XBD |
271.38 |
+4.22 |
+1.58% |
+14.34% |
| Retail |
$RLX |
2,414.22 |
-0.26 |
-0.01% |
+23.72% |
| Gold & Silver |
$XAU |
91.76 |
-0.33 |
-0.36% |
+29.86% |
| Bank |
$BKX |
99.67 |
+1.66 |
+1.69% |
+16.18% |
| Biotech |
$BTK |
4,393.37 |
+76.00 |
+1.76% |
+4.09% |
|
|
|
 |
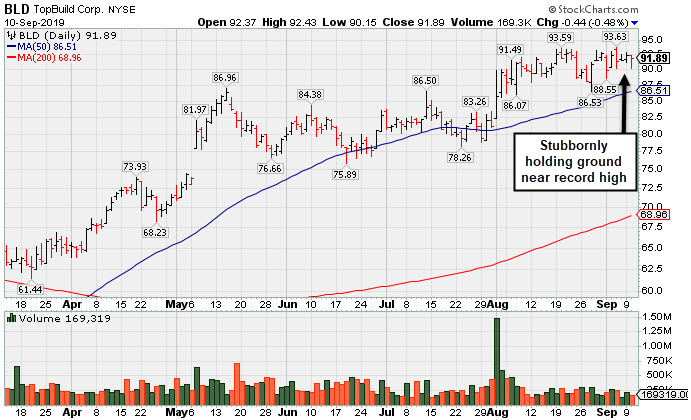
Holding Ground Stubbornly in Tight Range Near Record High
Kenneth J. Gruneisen - Passed the CAN SLIM® Master's Exam
Topbuild Corp (BLD -$0.44 or -0.48% to $91.89) is still perched within close striking distance of its all-time high. Earnings rose +39% on +9% sales revenues for the Jun '19 quarter versus the year ago period. Prior highs in the $86 area and its 50-day moving average (DMA) line ($86.51) coincide defining important support to watch on pullbacks.
It reported earnings +39% on +9% sales revenues for the Jun '19 quarter versus the year ago period, continuing its strong earnings track record of quarterly earnings increases above the +25% minimum guideline (C criteria). It has a 99 Earnings Per Share Rating, as its annual earnings (A criteria) history has also been strong and steady since turning profitable in FY '14.
The number of top-rated funds owning its shares rose from 383 in Dec '18 to 425 in Jun '19. Its current Up/Down Volume Ratio of 1.6 is an unbiased indication its shares have been under accumulation over the past 50 days. It has a Timeliness Rating of A and a Sponsorship Rating of C.
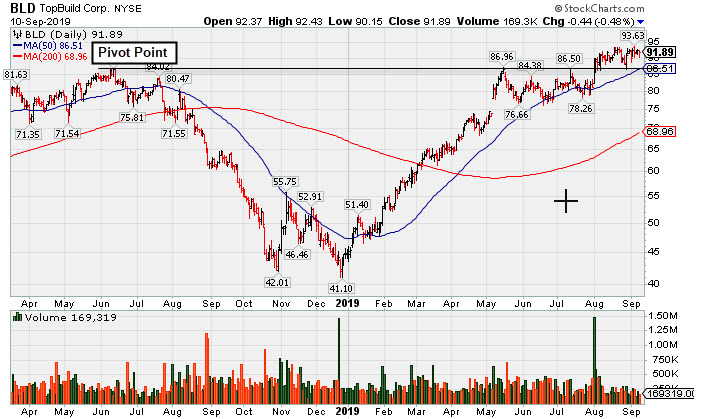
The annotated graphs below show how it has recently been wedging higher and stubbornly holding its ground in a tight range. The second graph shows a longer (18-month) term view which illustrates its previous breakout.
|
|
|
Color Codes Explained :
Y - Better candidates highlighted by our
staff of experts.
G - Previously featured
in past reports as yellow but may no longer be buyable under the
guidelines.
***Last / Change / Volume data in this table is the closing quote data***
Symbol/Exchange
Company Name
Industry Group |
PRICE |
CHANGE
(%Change) |
Day High |
Volume
(% DAV)
(% 50 day avg vol) |
52 Wk Hi
% From Hi |
Featured
Date |
Price
Featured |
Pivot Featured |
|
Max Buy |
 EPAM
-
NYSE
EPAM
-
NYSE
Epam Systems Inc
COMPUTER SOFTWARE and SERVICES - Information Technology Service
|
$176.13
|
-17.35
-8.97% |
$191.70
|
614,613
153.27% of 50 DAV
50 DAV is 401,000
|
$201.00
-12.37%
|
5/9/2019
|
$169.25
|
PP = $180.55
|
|
MB = $189.58
|
 Most Recent Note - 9/10/2019 10:17:44 AM
G - Violated its 50 DMA line ($189.87) with a big loss today triggering a technical sell signal. The prior low ($175.33 on 8/07/19) defines the next important support level. Reported earnings +27% on +24% sales revenues for the Jun '19 quarter.
>>> FEATURED STOCK ARTICLE : Volume Light During Brief Consolidation Above 50-Day Average - 8/29/2019 |
View all notes |
Set NEW NOTE alert |
Company Profile |
SEC
News |
Chart |
Request a new note
C
A
S
I |
AUDC
-
NASDAQ
Audiocodes Ltd
ELECTRONICS - Scientific and Technical Instrum
|
$16.91
|
-0.30
-1.74% |
$17.24
|
120,103
69.02% of 50 DAV
50 DAV is 174,000
|
$19.74
-14.34%
|
7/15/2019
|
$17.10
|
PP = $17.54
|
|
MB = $18.42
|
Most Recent Note - 9/10/2019 11:01:55 AM
G - Color code is changed to green while sputtering below its 50 DMA line ($17.39). The recent low ($16.51 on 8/14/19) defines important support where more damaging losses would raise concerns and trigger technical sell signals. Reported earnings +57% on +14% sales revenues for the Jun '19 quarter, continuing its strong earnings track record.
>>> FEATURED STOCK ARTICLE : Volume Cooling While Consolidating Above Support Levels - 8/30/2019 |
View all notes |
Set NEW NOTE alert |
Company Profile |
SEC
News |
Chart |
Request a new note
C
A
S
I |
LHCG
-
NASDAQ
L H C Group Inc
HEALTH SERVICES - Home Health Care
|
$118.38
|
+1.06
0.90% |
$119.57
|
197,887
90.36% of 50 DAV
50 DAV is 219,000
|
$129.37
-8.50%
|
7/1/2019
|
$110.94
|
PP = $122.20
|
|
MB = $128.31
|
Most Recent Note - 9/9/2019 3:36:02 PM
G - Undercut the prior low ($116.67 on 8/13/19) raising more serious concerns and triggering a worrisome technical sell signal. Slumping back below its 50 DMA line ($121.45) which has acted as resistance.
>>> FEATURED STOCK ARTICLE : Sputtering Below 50-Day Average and Below Pivot Point - 8/20/2019 |
View all notes |
Set NEW NOTE alert |
Company Profile |
SEC
News |
Chart |
Request a new note
C
A
S
I |
CHDN
-
NASDAQ
Churchill Downs Inc
LEISURE - Gaming Activities
|
$122.68
|
-1.99
-1.60% |
$124.10
|
266,284
117.82% of 50 DAV
50 DAV is 226,000
|
$132.73
-7.57%
|
7/22/2019
|
$118.45
|
PP = $118.89
|
|
MB = $124.83
|
Most Recent Note - 9/10/2019 11:00:18 AM
Y - Consolidating above its 50 DMA line ($120). Below that important short-term average, the prior low ($113.88 on 8/05/19) defines the next support level. Jun '19 earnings +10% on +26% sales revenues versus the year ago period were below the +25% minimum earnings guideline (C criteria), noted recently raising fundamental concerns.
>>> FEATURED STOCK ARTICLE : Found Support After Making Limited Progress - 9/4/2019 |
View all notes |
Set NEW NOTE alert |
Company Profile |
SEC
News |
Chart |
Request a new note
C
A
S
I |
LULU
-
NASDAQ
Lululemon Athletica
MANUFACTURING - Textile Manufacturing
|
$193.26
|
-1.13
-0.58% |
$194.29
|
2,535,391
143.49% of 50 DAV
50 DAV is 1,767,000
|
$204.44
-5.47%
|
9/6/2019
|
$201.25
|
PP = $194.35
|
|
MB = $204.07
|
Most Recent Note - 9/9/2019 12:48:39 PM
Y - Retreating from its all-time high with today's loss following 3 consecutive volume-driven gains. Gapped up on the prior session triggering a technical buy signal after reporting earnings +35% on +22% sales revenues for the Jul '19 quarter. Prior high ($194.25) defines initial support to watch above its 50 DMA line ($184.71).
>>> FEATURED STOCK ARTICLE : Sank Below 50-Day Average Toward Prior Lows With High Volume - 9/3/2019 |
View all notes |
Set NEW NOTE alert |
Company Profile |
SEC
News |
Chart |
Request a new note
C
A
S
I |
Symbol/Exchange
Company Name
Industry Group |
PRICE |
CHANGE
(%Change) |
Day High |
Volume
(% DAV)
(% 50 day avg vol) |
52 Wk Hi
% From Hi |
Featured
Date |
Price
Featured |
Pivot Featured |
|
Max Buy |
CPRT
-
NASDAQ
Copart Inc
SPECIALTY RETAIL - Auto Dealerships
|
$80.96
|
-1.33
-1.62% |
$82.03
|
1,531,096
122.98% of 50 DAV
50 DAV is 1,245,000
|
$83.55
-3.10%
|
9/5/2019
|
$79.13
|
PP = $79.84
|
|
MB = $83.83
|
Most Recent Note - 9/10/2019 5:44:13 PM
Y - Pulled back with lighter (near average) volume today following 4 consecutive volume-driven gains. The big volume-driven gain above the pivot point on 9/05/19 clinched a technical buy signal. Fundamentals are strong.
>>> FEATURED STOCK ARTICLE : Heavy Volume Behind Breakout Gain After Earnings Report - 9/5/2019 |
View all notes |
Set NEW NOTE alert |
Company Profile |
SEC
News |
Chart |
Request a new note
C
A
S
I |
PAYC
-
NYSE
Paycom Software Inc
COMPUTER SOFTWARE and SERVICES - Application Software
|
$211.32
|
-17.40
-7.61% |
$225.00
|
1,727,129
292.24% of 50 DAV
50 DAV is 591,000
|
$259.71
-18.63%
|
8/20/2019
|
$246.97
|
PP = $246.95
|
|
MB = $259.30
|
Most Recent Note - 9/10/2019 10:15:45 AM
G - Gapped down today and traded below its 8/05/19 low ($216.55) raising more concerns. Volume was heavy behind a big loss violating its 50 DMA line ($240) on the prior session triggering a technical sell signal. Only a prompt rebound above the 50 DMA line would help its outlook improve.
>>> FEATURED STOCK ARTICLE : Recently Wedged Higher Without Great Volume Conviction - 8/26/2019 |
View all notes |
Set NEW NOTE alert |
Company Profile |
SEC
News |
Chart |
Request a new note
C
A
S
I |
BLD
-
NYSE
Topbuild Corp
Bldg-Constr Prds/Misc
|
$91.89
|
-0.44
-0.48% |
$92.43
|
169,319
59.62% of 50 DAV
50 DAV is 284,000
|
$93.63
-1.86%
|
5/17/2019
|
$82.19
|
PP = $87.31
|
|
MB = $91.68
|
Most Recent Note - 9/10/2019 5:40:26 PM
G - Quietly perched within close striking distance of its all-time high. stubbornly holding its ground in a tight range. Earnings rose +39% on +9% sales revenues for the Jun '19 quarter versus the year ago period. Prior highs in the $86 area and its 50 DMA line ($86.50) coincide defining important support to watch on pullbacks. See the latest FSU analysis for more details and a new annotated graph.
>>> FEATURED STOCK ARTICLE : Holding Ground Stubbornly in Tight Range Near Record High - 9/10/2019 |
View all notes |
Set NEW NOTE alert |
Company Profile |
SEC
News |
Chart |
Request a new note
C
A
S
I |
PAGS
-
NYSE
Pagseguro Digital Cl A
Finance-CrdtCard/PmtPr
|
$43.87
|
-3.17
-6.74% |
$46.54
|
3,230,323
149.14% of 50 DAV
50 DAV is 2,166,000
|
$53.43
-17.89%
|
6/25/2019
|
$37.69
|
PP = $40.07
|
|
MB = $42.07
|
Most Recent Note - 9/10/2019 10:12:46 AM
G - Violated its 50 DMA line ($46.43) with weak action this morning following a big loss on the prior session. The prior low ($42.00 on 8/05/19) defines the next important chart support level. A prompt rebound above the 50 DMA line is needed for its outlook to improve. Reported earnings +35% on +39% sales revenues for the quarter ended June 30,2019 versus the year ago period.
>>> FEATURED STOCK ARTICLE : Brazil-Based Digital Payments Firm Perched at All-Time High - 8/22/2019 |
View all notes |
Set NEW NOTE alert |
Company Profile |
SEC
News |
Chart |
Request a new note
C
A
S
I |
|
|
|
THESE ARE NOT BUY RECOMMENDATIONS!
Comments contained in the body of this report are technical
opinions only. The material herein has been obtained
from sources believed to be reliable and accurate, however,
its accuracy and completeness cannot be guaranteed.
This site is not an investment advisor, hence it does
not endorse or recommend any securities or other investments.
Any recommendation contained in this report may not
be suitable for all investors and it is not to be deemed
an offer or solicitation on our part with respect to
the purchase or sale of any securities. All trademarks,
service marks and trade names appearing in this report
are the property of their respective owners, and are
likewise used for identification purposes only.
This report is a service available
only to active Paid Premium Members.
You may opt-out of receiving report notifications
at any time. Questions or comments may be submitted
by writing to Premium Membership Services 665 S.E. 10 Street, Suite 201 Deerfield Beach, FL 33441-5634 or by calling 1-800-965-8307
or 954-785-1121.
|
|
|