You are not logged in.
This means you
CAN ONLY VIEW reports that were published prior to Saturday, February 24, 2024.
You
MUST UPGRADE YOUR MEMBERSHIP if you want to see any current reports.
AFTER MARKET UPDATE - WEDNESDAY, SEPTEMBER 9TH, 2020
Previous After Market Report Next After Market Report >>>
|
|
|
|
DOW |
+439.58 |
27,940.47 |
+1.60% |
|
Volume |
867,166,604 |
-15% |
|
Volume |
3,513,614,500 |
-9% |
|
NASDAQ |
+294.99 |
11,142.68 |
+2.72% |
|
Advancers |
2,188 |
74% |
|
Advancers |
2,264 |
68% |
|
S&P 500 |
+67.12 |
3,398.96 |
+2.01% |
|
Decliners |
768 |
26% |
|
Decliners |
1,053 |
32% |
|
Russell 2000 |
+21.89 |
1,526.48 |
+1.45% |
|
52 Wk Highs |
37 |
|
|
52 Wk Highs |
52 |
|
|
S&P 600 |
+8.79 |
879.29 |
+1.01% |
|
52 Wk Lows |
16 |
|
|
52 Wk Lows |
26 |
|
|
 |
Major Indices Rose With Lighter Volume Totals Behind Gains
Kenneth J. Gruneisen - Passed the CAN SLIM® Master's Exam
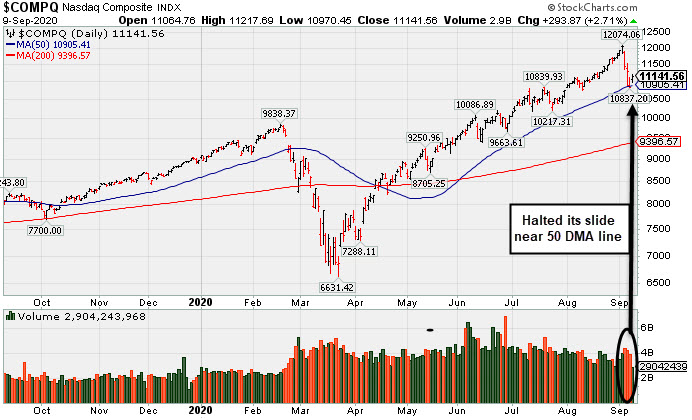
The Dow climbed 439 points, while the S&P 500 advanced 2%, bouncing back from its first three-session decline since early June. The Nasdaq Composite was up 2.7%, while the Nasdaq 100 surged 3%, its best one-day performance since April, as investors appeared to “buy the dip” in Tech and other mega-cap shares. The reported volume totals were lighter than the prior session totals on the NYSE and on the Nasdaq exchange, revealing lackluster buying demand from the institutional crowd. Breadth was positive as advancers led decliners by a 3-1 margin on the NYSE and more than 2-1 on the Nasdaq exchange. Leadership improved as 13 high-ranked companies from the Leaders List hit new 52-week highs and were listed on the BreakOuts Page, up from the total of 7 on the prior session. New 52-week highs totals improved and outnumbered new 52-week lows on both the NYSE and the Nasdaq exchange. The major indices have seen their uptrend recently come under pressure (M criteria). Any sustainable rally requires a healthy crop of new leaders, so it remains very important to see substantial improvement in the new highs totals.
PICTURED: The Nasdaq Composite Index halted its slide near its 50-day moving average (DMA) line.
Stock finished higher on Wednesday, with Wall Street rebounding from a three-day slump that dragged the Nasdaq Composite into correction territory. Through Tuesday’s close, the Tech-heavy index had fallen more than 10% from its record level notched last Wednesday.
All 11 S&P 500 sectors ended in positive territory with Technology stocks jumping 3.4%. Microsoft (MSFT +4.26%) and Apple (AAPL +3.99%) made sharp reversals from the last three trading sessions, during which the two technology titans shed a combined $500 billion in market cap. In corporate news, AstraZeneca (AZN -1.96%) after the drugmaker paused global trials of its experimental coronavirus vaccine due to the unexplained illness of one of the study’s participants. Meanwhile, other COVID-19 vaccine developers benefitted from the news, with BioNTech (BNTX +4.16%) and Moderna (MRNA +4.64%) each advancing. Elsewhere, Tiffany & Co. (TIF -6.44%) fell after France’s LVMH Moet Henessey (LVMUY +0.26%) took steps to back out of its $16 billion acquisition of the U.S. luxury jeweler.
On the data front, the Job Openings and Labor Turnover Survey (JOLTS) showed 6.6 million job openings at the end of July. Treasuries declined, with the yield on the 10-year note up one basis point to 0.69%. In commodities, WTI crude finished 3.5% higher at $38.05/barrel, recouping some of Tuesday’s sell-off of nearly 8%. |
 Kenneth J. Gruneisen started out as a licensed stockbroker in August 1987, a couple of months prior to the historic stock market crash that took the Dow Jones Industrial Average down -22.6% in a single day. He has published daily fact-based fundamental and technical analysis on high-ranked stocks online for two decades. Through FACTBASEDINVESTING.COM, Kenneth provides educational articles, news, market commentary, and other information regarding proven investment systems that work in good times and bad.
Comments contained in the body of this report are technical opinions only and are not necessarily those of Gruneisen Growth Corp. The material herein has been obtained from sources believed to be reliable and accurate, however, its accuracy and completeness cannot be guaranteed. Our firm, employees, and customers may effect transactions, including transactions contrary to any recommendation herein, or have positions in the securities mentioned herein or options with respect thereto. Any recommendation contained in this report may not be suitable for all investors and it is not to be deemed an offer or solicitation on our part with respect to the purchase or sale of any securities. |
|
 |
Gold & Silver, Retail, and Semiconductor Indexes Led Group Gainers
Kenneth J. Gruneisen - Passed the CAN SLIM® Master's Exam
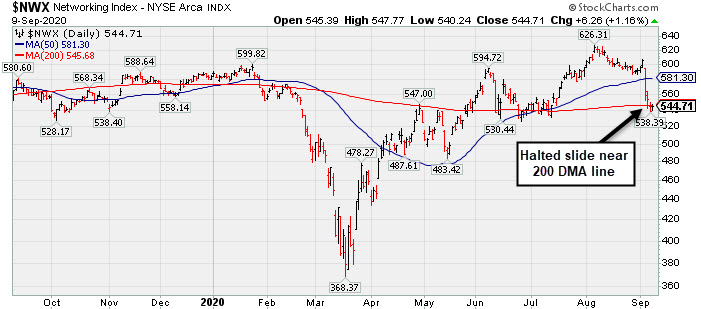
The Retail Index ($RLX +2.96%) helped underpin the major indices' advance while the Broker/Dealer Index ($XBD +1.04%) posted a smaller gain and the Bank Index ($BKX +0.13%) also inched higher. The Semiconductor Index ($SOX +2.86%), Biotech Index ($BTK +1.46%), and Networking Index ($NWX +1.16%) posted unanimous gains. Commodity-linked groups had a positive bias as the Gold & Silver Index ($XAU +4.60%) outpaced the Oil Services Index ($OSX +1.47%) and the Integrated Oil Index ($XOI +0.83%).
PICTURED: The Networking Index ($NWX +1.16%) halted its slide near its 200 DMA line.
| Oil Services |
$OSX |
34.00 |
+0.49 |
+1.47% |
-56.57% |
| Integrated Oil |
$XOI |
678.57 |
+5.57 |
+0.83% |
-46.59% |
| Semiconductor |
$SOX |
2,168.94 |
+60.32 |
+2.86% |
+17.26% |
| Networking |
$NWX |
544.71 |
+6.26 |
+1.16% |
-6.63% |
| Broker/Dealer |
$XBD |
286.78 |
+2.95 |
+1.04% |
-1.24% |
| Retail |
$RLX |
3,475.74 |
+99.93 |
+2.96% |
+41.91% |
| Gold & Silver |
$XAU |
154.80 |
+6.81 |
+4.60% |
+44.78% |
| Bank |
$BKX |
76.56 |
+0.10 |
+0.13% |
-32.46% |
| Biotech |
$BTK |
5,230.24 |
+75.08 |
+1.46% |
+3.21% |
|
|
|
 |
Recently Sputtering Below 50-Day Moving Average
Kenneth J. Gruneisen - Passed the CAN SLIM® Master's Exam
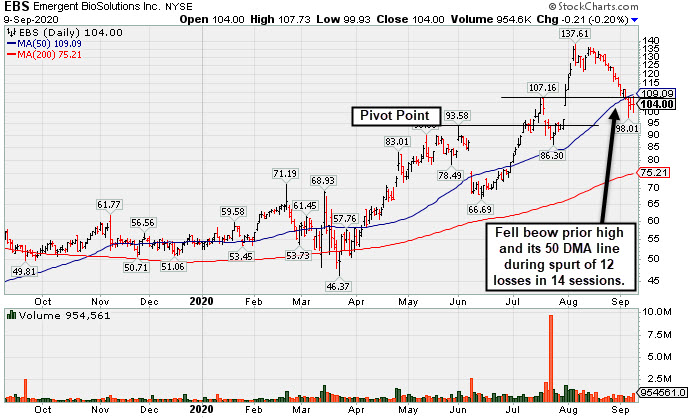
Emergent Biosolutions (EBS -$0.21 or -0.20% to $104.00) violated its prior high $107.16 on 7/20/20) and its 50-day moving average (DMA) line ($109) during a spurt of 12 losses over the span of 14 sessions. A rebound above its 50 DMA line is needed for its outlook to improve. Fundamentals remain strong after it reported Jun '20 quarterly earnings +890% on +62% sales revenue for the Jun '20 quarter versus the year ago period.
The company is in the Medical - Biomed/Biotech industry group group rank fell from 39th to 70th out of the 197 industry groups (L criteria) since last shown in this FSU section on 8/21/20 with an annotated graph under the headline, "High Ranked Biomed Leader is Extended From Prior Base". It currently has a 94 Earnings Per Share Rating, putting it in the top 10% of all publicly traded companies based on its earnings history. It has shown very strong quarterly comparisons versus the year ago periods. Annual earnings history (A criteria) has been strong since a downturn in FY '16.
It has a small supply (S criteria) of only 45.5 million shares in the publicly traded float which can contribute to greater price volatility in the event of institutional buying or selling. The number of top-rated funds owning its shares rose from 453 in Sep '19 to 539 in Jun '20, and its current Up/Down Volume Ratio of 0.8 is an unbiased indication its shares have been under distributional pressure over the past 50 days. It has a B Timeliness rating and a B- Accumulation/Distribution rating. |
|
|
Color Codes Explained :
Y - Better candidates highlighted by our
staff of experts.
G - Previously featured
in past reports as yellow but may no longer be buyable under the
guidelines.
***Last / Change / Volume data in this table is the closing quote data***
Symbol/Exchange
Company Name
Industry Group |
PRICE |
CHANGE
(%Change) |
Day High |
Volume
(% DAV)
(% 50 day avg vol) |
52 Wk Hi
% From Hi |
Featured
Date |
Price
Featured |
Pivot Featured |
|
Max Buy |
 CRL
-
NYSE
CRL
-
NYSE
Charles River Labs Intl
DRUGS - Biotechnology
|
$209.89
|
+6.94
3.42% |
$211.20
|
293,198
87.00% of 50 DAV
50 DAV is 337,000
|
$221.97
-5.44%
|
7/15/2020
|
$192.66
|
PP = $189.95
|
|
MB = $199.45
|
 Most Recent Note - 9/9/2020 5:06:43 PM
G - Volume was lighter behind today's gain. Found prompt support at its 50 DMA line ($203) after volume-driven losses. More damaging losses leading to a 50 DMA violation would trigger a technical sell signal. Recently reported Jun '20 quarterly earnings -3% on +4% sales revenues, below the +25% minimum guideline (C criteria), but better than expected while the company also raised its guidance.
>>> FEATURED STOCK ARTICLE : Volume Totals Cooling While Hovering in Tight Range Near Record High - 8/25/2020 |
View all notes |
Set NEW NOTE alert |
Company Profile |
SEC
News |
Chart |
Request a new note
C
A
S
I |
EBS
-
NYSE
Emergent Biosolutions
DRUGS - Biotechnology
|
$104.00
|
-0.21
-0.20% |
$107.73
|
944,107
97.33% of 50 DAV
50 DAV is 970,000
|
$137.61
-24.42%
|
7/7/2020
|
$89.47
|
PP = $93.68
|
|
MB = $98.36
|
Most Recent Note - 9/9/2020 5:51:59 PM
G - Violated its prior high $107.16 on 7/20/20) and its 50 DMA line ($109) during a spurt of 12 losses over the span of 14 sessions. A rebound above its 50 DMA line is needed for its outlook to improve. Fundamentals remain strong. See the latest FSU analysis for more details and a new annotated graph.
>>> FEATURED STOCK ARTICLE : High Ranked Biomed Leader is Extended From Prior Base - 8/21/2020 |
View all notes |
Set NEW NOTE alert |
Company Profile |
SEC
News |
Chart |
Request a new note
C
A
S
I |
AMD
-
NASDAQ
Advanced Micro Devices
ELECTRONICS - Semiconductor - Broad Line
|
$81.91
|
+3.22
4.09% |
$82.44
|
53,940,847
84.08% of 50 DAV
50 DAV is 64,153,000
|
$94.28
-13.12%
|
8/31/2020
|
$90.42
|
PP = $87.39
|
|
MB = $91.76
|
Most Recent Note - 9/9/2020 5:04:17 PM
Y - Posted a gain today with below average volume after 4 consecutive losses while abruptly pulling back from its all-time high. Completely negated the recent breakout from an advanced "3-weeks tight" base. The recent low ($76.10 on 8/11/20) defines near-term support above its 50 DMA line ($72.74). Fundamentals remain strong.
>>> FEATURED STOCK ARTICLE : Perched at All-Time High After Another Bullish Breakout - 9/2/2020 |
View all notes |
Set NEW NOTE alert |
Company Profile |
SEC
News |
Chart |
Request a new note
C
A
S
I |
TREX
-
NYSE
Trex Company Inc
MATERIALS and CONSTRUCTION - General Building Materials
|
$141.21
|
+2.89
2.09% |
$143.25
|
493,688
77.99% of 50 DAV
50 DAV is 633,000
|
$156.63
-9.84%
|
6/26/2020
|
$109.05
|
PP = $132.94
|
|
MB = $139.59
|
Most Recent Note - 9/9/2020 6:08:32 PM
G - Color code is changed to green after rebounding above its "max buy" level. Found prompt support near its 50 DMA line ($138.42) line helping its outlook improve. Fundamentals remain strong.
>>> FEATURED STOCK ARTICLE : Fall Below "Max Buy" Level Also Undercut 50-Day Moving Average - 9/4/2020 |
View all notes |
Set NEW NOTE alert |
Company Profile |
SEC
News |
Chart |
Request a new note
C
A
S
I |
NFLX
-
NASDAQ
Netflix Inc
SPECIALTY RETAIL - Music and Video Stores
|
$500.19
|
-6.83
-1.35% |
$520.00
|
6,709,267
84.73% of 50 DAV
50 DAV is 7,918,000
|
$575.37
-13.07%
|
9/1/2020
|
$547.45
|
PP = $575.47
|
|
MB = $604.24
|
Most Recent Note - 9/9/2020 6:03:25 PM
Y - Testing near its 50 DMA line ($501) with today's 5th consecutive loss with near average or lighter volume. More damaging losses may raise concerns and trigger a technical sell signal. A new pivot point was cited based on its 7/13/20 high plus 10 cents. Subsequent volume-driven gains above the pivot point may trigger a new (or add-on) technical buy signal.
>>> FEATURED STOCK ARTICLE : Pulling Back After Best Ever Close on Tuesday - 9/3/2020 |
View all notes |
Set NEW NOTE alert |
Company Profile |
SEC
News |
Chart |
Request a new note
C
A
S
I |
Symbol/Exchange
Company Name
Industry Group |
PRICE |
CHANGE
(%Change) |
Day High |
Volume
(% DAV)
(% 50 day avg vol) |
52 Wk Hi
% From Hi |
Featured
Date |
Price
Featured |
Pivot Featured |
|
Max Buy |
LGIH
-
NASDAQ
L G I Homes Inc
Bldg-Resident/Comml
|
$114.44
|
+6.17
5.70% |
$115.45
|
246,036
76.65% of 50 DAV
50 DAV is 321,000
|
$123.94
-7.66%
|
7/7/2020
|
$99.19
|
PP = $95.82
|
|
MB = $100.61
|
Most Recent Note - 9/9/2020 4:58:09 PM
G - Retreated from its 52-week high but halted its near its 50 DMA line ($109.97) and posted 2 consecutive gains on lighter volume. More damaging losses would raise greater concerns. Reported Jun '20 quarterly earnings +21% on +4% sales revenues, breaking a streak of 4 comparisons above the +25% minimum guideline (C criteria).
>>> FEATURED STOCK ARTICLE : Homebuilder Halted Slide Near Prior Low and 50-Day Average - 9/8/2020 |
View all notes |
Set NEW NOTE alert |
Company Profile |
SEC
News |
Chart |
Request a new note
C
A
S
I |
NOW
-
NYSE
Servicenow Inc
Computer Sftwr-Enterprse
|
$458.20
|
+15.06
3.40% |
$462.86
|
1,756,372
101.29% of 50 DAV
50 DAV is 1,734,000
|
$501.82
-8.69%
|
8/20/2020
|
$453.34
|
PP = $454.79
|
|
MB = $477.53
|
Most Recent Note - 9/9/2020 6:06:16 PM
Y - Rebounded today after briefly undercutting the prior high ($454) and testing support at its 50 DMA line ($440). Fundamentals remain strong. More damaging losses may raise concerns and trigger a technical sell signal.
>>> FEATURED STOCK ARTICLE : Quiet Gain to New High for Computer Software Firm - 8/28/2020 |
View all notes |
Set NEW NOTE alert |
Company Profile |
SEC
News |
Chart |
Request a new note
C
A
S
I |
DOCU
-
NASDAQ
Docusign Inc
Computer Sftwr-Enterprse
|
$211.79
|
+6.16
3.00% |
$216.25
|
11,176,644
180.27% of 50 DAV
50 DAV is 6,200,000
|
$290.23
-27.03%
|
6/10/2020
|
$149.73
|
PP = $152.10
|
|
MB = $159.71
|
Most Recent Note - 9/9/2020 5:08:22 PM
G - Halted its slide today near its 50 DMA line ($207) after suffering 4 consecutive volume-driven losses while abruptly retreating from its all-time high. The prior low ($189.12 on 8/12/20) defines the next important near-term support to watch.
>>> FEATURED STOCK ARTICLE : Perched Near All-Time High After Finding Support Above 50 DMA - 8/31/2020 |
View all notes |
Set NEW NOTE alert |
Company Profile |
SEC
News |
Chart |
Request a new note
C
A
S
I |
PING
-
NYSE
Ping Identity Holdings Corp
Computer Sftwr-Security
|
$32.28
|
+1.39
4.50% |
$32.79
|
959,809
77.86% of 50 DAV
50 DAV is 1,232,700
|
$37.80
-14.60%
|
6/1/2020
|
$29.24
|
PP = $29.90
|
|
MB = $31.40
|
Most Recent Note - 9/9/2020 5:02:18 PM
Posted a gain today with below average volume. Violated its 50 DMA line ($33.52) during a streak of 4 consecutive losses raising concerns and triggering a technical sell signal. Sputtering in recent weeks after it reported Jun '20 quarterly earnings -27% on -6% sales revenues versus the year ago period, below the +25% minimum earnings guideline, raising fundamental concerns, and its Earnings Per Share rating has slumped to 42, well below the 80 minimum guideline. Completed Secondary Offerings on 7/09/20 and 5/15/20. It will be dropped from the Featured Stocks list tonight.
>>> FEATURED STOCK ARTICLE : Found Support Near 50 DMA Line But Latest Earnings Were Sub Par - 8/26/2020 |
View all notes |
Set NEW NOTE alert |
Company Profile |
SEC
News |
Chart |
Request a new note
C
A
S
I |
|
|
|
THESE ARE NOT BUY RECOMMENDATIONS!
Comments contained in the body of this report are technical
opinions only. The material herein has been obtained
from sources believed to be reliable and accurate, however,
its accuracy and completeness cannot be guaranteed.
This site is not an investment advisor, hence it does
not endorse or recommend any securities or other investments.
Any recommendation contained in this report may not
be suitable for all investors and it is not to be deemed
an offer or solicitation on our part with respect to
the purchase or sale of any securities. All trademarks,
service marks and trade names appearing in this report
are the property of their respective owners, and are
likewise used for identification purposes only.
This report is a service available
only to active Paid Premium Members.
You may opt-out of receiving report notifications
at any time. Questions or comments may be submitted
by writing to Premium Membership Services 665 S.E. 10 Street, Suite 201 Deerfield Beach, FL 33441-5634 or by calling 1-800-965-8307
or 954-785-1121.
|
|
|