You are not logged in.
This means you
CAN ONLY VIEW reports that were published prior to Sunday, February 25, 2024.
You
MUST UPGRADE YOUR MEMBERSHIP if you want to see any current reports.
AFTER MARKET UPDATE - MONDAY, SEPTEMBER 9TH, 2019
Previous After Market Report Next After Market Report >>>
|
|
|
|
DOW |
+38.05 |
26,835.51 |
+0.14% |
|
Volume |
890,546,540 |
+21% |
|
Volume |
2,139,709,560 |
+15% |
|
NASDAQ |
-15.63 |
8,087.44 |
-0.19% |
|
Advancers |
1,771 |
62% |
|
Advancers |
1,872 |
61% |
|
S&P 500 |
-0.28 |
2,978.43 |
-0.01% |
|
Decliners |
1,084 |
38% |
|
Decliners |
1,204 |
39% |
|
Russell 2000 |
+19.06 |
1,524.23 |
+1.27% |
|
52 Wk Highs |
118 |
|
|
52 Wk Highs |
74 |
|
|
S&P 600 |
+13.28 |
943.39 |
+1.43% |
|
52 Wk Lows |
16 |
|
|
52 Wk Lows |
59 |
|
|
 |
Major Indices Ended Mixed While Leadership Thinned
Kenneth J. Gruneisen - Passed the CAN SLIM® Master's Exam
The S&P 500 slipped less than 0.1%, ending a three-session winning streak. The Dow climbed 38 points, with its four-day rally its best stretch of gains since July. The Nasdaq Composite declined 0.2%. Volume totals reported were higher than the prior session totals on the NYSE and on the Nasdaq exchange. Breadth was positive as advancers led decliners by a 3-2 margin on the NYSE, and on the Nasdaq exchange. There were 46 high-ranked companies from the Leaders List hit new 52-week highs and were listed on the BreakOuts Page, versus the total of 77 on the prior session. Again, new 52-week highs totals contracted, yet new highs still outnumbered new 52-week lows totals on the NYSE and on the Nasdaq exchange. Concerning the M criteria of the fact-based investment system, investors have a green light to make carefully selected new buying efforts. The Featured Stocks Page provides the most timely analysis on high-ranked leaders. Charts used courtesy of www.stockcharts.com
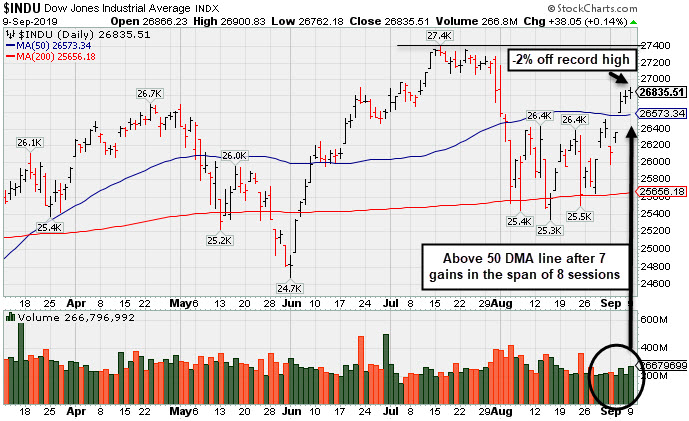
PICTURED: The Dow Jones Industrial Average is perched -2% off its record high hit on 7/16/19. It rebounded above its 50-day moving average (DMA) line during a streak of 7 gains in the span of 8 sessions.
Stocks finished mixed Monday. Positive trade developments from last week and hopes of central bank stimulus helped support risk sentiment, sending U.S. Treasury yields advancing to the highest levels in three weeks. The yield on the 10-year note spiked eight basis points to 1.63%.
On the data front, consumer credit increased to $23.3 billion in July, the fastest pace in nearly two years. In commodities, WTI crude climbed 2.4% to $57.85/barrel on expectations of further OPEC supply cuts.
Six of 11 S&P 500 sectors closed in negative territory. Health Care shares led decliners after some Wall Street analysts warned of the potential influx of drug pricing headlines as Congress returns from August’s recess. The more traditionally defensive Utilities and Real Estate groups also underperformed, while Financials rallied more than 1.5% amid a jump in Treasury yields.
In corporate news, AT&T (T +1.5%) rose after activist investor Elliott Management disclosed a $3.2 billion dollar stake in the wireless carrier and outlined a plan to boost shareholder value.
The U.S. and China plan to meet for high level talks in October. Meanwhile, market participants widely anticipate another interest rate cut next week after Fed Chair Jerome Powell reiterated policymakers’ intention to “act as appropriate” to sustain the current economic expansion during a speech Friday.
|
 Kenneth J. Gruneisen started out as a licensed stockbroker in August 1987, a couple of months prior to the historic stock market crash that took the Dow Jones Industrial Average down -22.6% in a single day. He has published daily fact-based fundamental and technical analysis on high-ranked stocks online for two decades. Through FACTBASEDINVESTING.COM, Kenneth provides educational articles, news, market commentary, and other information regarding proven investment systems that work in good times and bad.
Comments contained in the body of this report are technical opinions only and are not necessarily those of Gruneisen Growth Corp. The material herein has been obtained from sources believed to be reliable and accurate, however, its accuracy and completeness cannot be guaranteed. Our firm, employees, and customers may effect transactions, including transactions contrary to any recommendation herein, or have positions in the securities mentioned herein or options with respect thereto. Any recommendation contained in this report may not be suitable for all investors and it is not to be deemed an offer or solicitation on our part with respect to the purchase or sale of any securities. |
|
 |
Financial and Energy-Linked Groups Led Gainers
Kenneth J. Gruneisen - Passed the CAN SLIM® Master's Exam
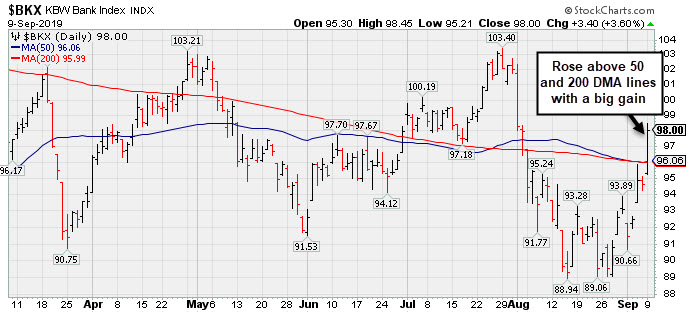
The Bank Index ($BKX +3.60%) outpaced the Broker/Dealer Index ($XBD +1.16%) with gains. The Retail Index ($RLX +0.26%) sputtered in and out of the red and struggled to finish the session with only a small gain. The tech sector was mixed as the Networking Index ($NWX -0.46%) fell while the Semiconductor Index ($SOX +0.51%) and the Biotech Index ($BTK +1.08%) both rose. Commodity-linked groups were mixed as the Oil Services Index ($OSX +6.50%) was a standout gainer and the Integrated Oil Index ($XOI +1.51%) also rose, but the Gold & Silver Index ($XAU -2.31%) was a standout decliner for the third consecutive session.
PICTURED: The Bank Index ($BKX +3.60%) has rallied impressively from recent lows, and Monday's gain helped it rebound above its 50-day and 200-day moving average (DMA) lines.
| Oil Services |
$OSX |
70.91 |
+4.33 |
+6.50% |
-12.02% |
| Integrated Oil |
$XOI |
1,209.29 |
+18.02 |
+1.51% |
+4.33% |
| Semiconductor |
$SOX |
1,576.39 |
+8.05 |
+0.51% |
+36.46% |
| Networking |
$NWX |
558.72 |
-2.58 |
-0.46% |
+14.34% |
| Broker/Dealer |
$XBD |
267.16 |
+3.07 |
+1.16% |
+12.57% |
| Retail |
$RLX |
2,414.48 |
+6.26 |
+0.26% |
+23.73% |
| Gold & Silver |
$XAU |
92.09 |
-2.17 |
-2.30% |
+30.33% |
| Bank |
$BKX |
98.01 |
+3.41 |
+3.60% |
+14.24% |
| Biotech |
$BTK |
4,317.36 |
+45.95 |
+1.08% |
+2.29% |
|
|
|
 |
Distributional Action Weighs on Prior Leader
Kenneth J. Gruneisen - Passed the CAN SLIM® Master's Exam
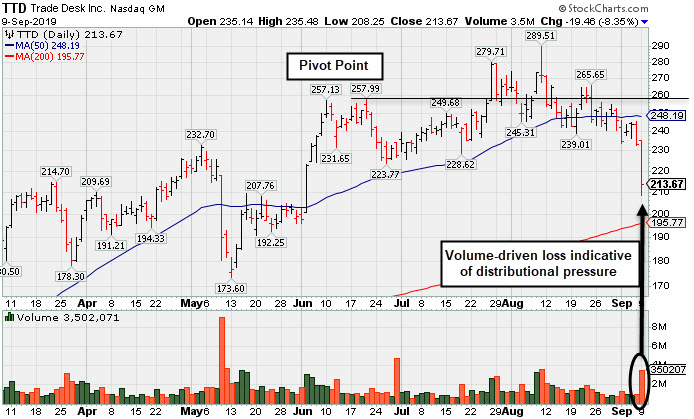
The Trade Desk Inc Cl A (TTD $213.67 -$19.46 -8.35%) slumped further below its 50-day moving average (DMA) line ($248) and below the recent low ($239.01 on 8/21/19) with today's volume-driven loss after damaging losses last week triggered technical sell signals. It will be dropped from the Featured Stocks list tonight. A rebound above the 50 DMA line is needed to help its outlook improve.
Fundamentals remain strong after it recently it reported Jun '19 quarterly earnings +58% on +42% sales revenues. Seven of the past 8 quarterly comparisons were well above the +25% minimum guideline (C criteria). Its annual earnings (A criteria) history has been strong, and it has a highest possible 99 Earnings Per Share Rating.
The high-ranked Comml Svcs-Advertising firm was last shown in this FSU section on 9/06/19 with an annotated graph under the headline, "Negated Breakout and Slumped Below Noted Support". The number of top-rated funds owning its shares rose from 280 in Mar '18 to 559 in Jun '19, a reassuring sign concerning the I criteria. Its current Up/Down Volume Ratio of 1.0 is an unbiased indication its shares have been neutral concerning accumulation/distribution over the past 50 days. It has a Timeliness Rating of B and a Sponsorship Rating of B. There are only 45.0 million shares outstanding (S criteria) which can contribute to greater volatility in the event of institutional buying or selling.
Charts courtesy of www.stockcharts.com
 |
|
|
Color Codes Explained :
Y - Better candidates highlighted by our
staff of experts.
G - Previously featured
in past reports as yellow but may no longer be buyable under the
guidelines.
***Last / Change / Volume data in this table is the closing quote data***
Symbol/Exchange
Company Name
Industry Group |
PRICE |
CHANGE
(%Change) |
Day High |
Volume
(% DAV)
(% 50 day avg vol) |
52 Wk Hi
% From Hi |
Featured
Date |
Price
Featured |
Pivot Featured |
|
Max Buy |
 EPAM
-
NYSE
EPAM
-
NYSE
Epam Systems Inc
COMPUTER SOFTWARE and SERVICES - Information Technology Service
|
$193.48
|
+0.59
0.31% |
$195.22
|
419,540
105.68% of 50 DAV
50 DAV is 397,000
|
$201.00
-3.74%
|
5/9/2019
|
$169.25
|
PP = $180.55
|
|
MB = $189.58
|
Most Recent Note - 9/4/2019 1:14:32 PM
G - Faces some resistance due to overhead supply up to the $201 level. Quietly consolidating near its 50 DMA line ($188.31) which defines support above the recent low ($175.33 on 8/07/19). Reported earnings +27% on +24% sales revenues for the Jun '19 quarter. See the latest FSU analysis for more details and an annotated graph.
>>> FEATURED STOCK ARTICLE : Volume Light During Brief Consolidation Above 50-Day Average - 8/29/2019 |
View all notes |
Set NEW NOTE alert |
Company Profile |
SEC
News |
Chart |
Request a new note
C
A
S
I |
AUDC
-
NASDAQ
Audiocodes Ltd
ELECTRONICS - Scientific and Technical Instrum
|
$17.21
|
-0.25
-1.43% |
$17.37
|
118,730
68.63% of 50 DAV
50 DAV is 173,000
|
$19.74
-12.82%
|
7/15/2019
|
$17.10
|
PP = $17.54
|
|
MB = $18.42
|
Most Recent Note - 9/5/2019 12:54:41 PM
Y - Consolidating near important support defined by its 50 DMA line ($17.27) and recent low ($16.51 on 8/14/19). More damaging losses would raise concerns and trigger technical sell signals. Reported earnings +57% on +14% sales revenues for the Jun '19 quarter, continuing its strong earnings track record.
>>> FEATURED STOCK ARTICLE : Volume Cooling While Consolidating Above Support Levels - 8/30/2019 |
View all notes |
Set NEW NOTE alert |
Company Profile |
SEC
News |
Chart |
Request a new note
C
A
S
I |
LHCG
-
NASDAQ
L H C Group Inc
HEALTH SERVICES - Home Health Care
|
$117.32
|
-5.07
-4.14% |
$122.85
|
250,410
114.87% of 50 DAV
50 DAV is 218,000
|
$129.37
-9.31%
|
7/1/2019
|
$110.94
|
PP = $122.20
|
|
MB = $128.31
|
 Most Recent Note - 9/9/2019 3:36:02 PM
G - Undercut the prior low ($116.67 on 8/13/19) raising more serious concerns and triggering a worrisome technical sell signal. Slumping back below its 50 DMA line ($121.45) which has acted as resistance.
>>> FEATURED STOCK ARTICLE : Sputtering Below 50-Day Average and Below Pivot Point - 8/20/2019 |
View all notes |
Set NEW NOTE alert |
Company Profile |
SEC
News |
Chart |
Request a new note
C
A
S
I |
CHDN
-
NASDAQ
Churchill Downs Inc
LEISURE - Gaming Activities
|
$124.67
|
-0.33
-0.26% |
$125.49
|
204,614
90.54% of 50 DAV
50 DAV is 226,000
|
$132.73
-6.07%
|
7/22/2019
|
$118.45
|
PP = $118.89
|
|
MB = $124.83
|
Most Recent Note - 9/4/2019 5:37:23 PM
Y - Its 50 DMA line ($119) and prior low ($113.88 on 8/05/19) define important near-term support to watch. Jun '19 earnings +10% on +26% sales revenues versus the year ago period were below the +25% minimum earnings guideline (C criteria), noted recently raising fundamental concerns. See the latest FSU analysis for more details and a new annotated graph.
>>> FEATURED STOCK ARTICLE : Found Support After Making Limited Progress - 9/4/2019 |
View all notes |
Set NEW NOTE alert |
Company Profile |
SEC
News |
Chart |
Request a new note
C
A
S
I |
LULU
-
NASDAQ
Lululemon Athletica
MANUFACTURING - Textile Manufacturing
|
$194.39
|
-8.75
-4.31% |
$203.76
|
3,825,542
222.80% of 50 DAV
50 DAV is 1,717,000
|
$204.44
-4.92%
|
9/6/2019
|
$201.25
|
PP = $194.35
|
|
MB = $204.07
|
Most Recent Note - 9/9/2019 12:48:39 PM
Y - Retreating from its all-time high with today's loss following 3 consecutive volume-driven gains. Gapped up on the prior session triggering a technical buy signal after reporting earnings +35% on +22% sales revenues for the Jul '19 quarter. Prior high ($194.25) defines initial support to watch above its 50 DMA line ($184.71).
>>> FEATURED STOCK ARTICLE : Sank Below 50-Day Average Toward Prior Lows With High Volume - 9/3/2019 |
View all notes |
Set NEW NOTE alert |
Company Profile |
SEC
News |
Chart |
Request a new note
C
A
S
I |
Symbol/Exchange
Company Name
Industry Group |
PRICE |
CHANGE
(%Change) |
Day High |
Volume
(% DAV)
(% 50 day avg vol) |
52 Wk Hi
% From Hi |
Featured
Date |
Price
Featured |
Pivot Featured |
|
Max Buy |
CPRT
-
NASDAQ
Copart Inc
SPECIALTY RETAIL - Auto Dealerships
|
$82.29
|
+0.91
1.12% |
$83.55
|
2,314,777
190.99% of 50 DAV
50 DAV is 1,212,000
|
$82.32
-0.04%
|
9/5/2019
|
$79.13
|
PP = $79.84
|
|
MB = $83.83
|
Most Recent Note - 9/6/2019 12:04:21 PM
Y - Hit a new high today. Finished strong on the prior session after highlighted in yellow with pivot point cited based on its 7/26/19 high plus 10 cents. The big volume-driven gain above the pivot point clinched a technical buy signal. Reported earnings +43% on +21% sales revenues for the Jul '19 quarter. Three of the past 4 quarterly earnings increases were above the +25% minimum guideline (C criteria) and its sales revenues growth rate has accelerated. Annual earnings (A criteria) history has been strong and steady since a downturn in FY '13. See the latest FSU analysis for more details and an annotated graph.
>>> FEATURED STOCK ARTICLE : Heavy Volume Behind Breakout Gain After Earnings Report - 9/5/2019 |
View all notes |
Set NEW NOTE alert |
Company Profile |
SEC
News |
Chart |
Request a new note
C
A
S
I |
VEEV
-
NYSE
Veeva Systems Inc Cl A
Computer Sftwr-Medical
|
$144.51
|
-12.82
-8.15% |
$158.34
|
3,395,768
252.66% of 50 DAV
50 DAV is 1,344,000
|
$176.90
-18.31%
|
5/30/2019
|
$154.32
|
PP = $145.80
|
|
MB = $153.09
|
Most Recent Note - 9/9/2019 3:27:53 PM
Sinking further below its 50 DMA line ($164.30) and below the prior low ($153.21 on 8/05/19) with today's big volume-driven loss triggering technical sell signals. It will be dropped from the Featured Stocks list tonight. A convincing rebound is needed for its outlook to improve. The 50 DMA line has acted as resistance. Reported earnings +41% on +27% for the Jul '19 quarter continuing its strong earnings track record.
>>> FEATURED STOCK ARTICLE : Met Resistance After Slumping Below 50-Day Moving Average - 8/23/2019 |
View all notes |
Set NEW NOTE alert |
Company Profile |
SEC
News |
Chart |
Request a new note
C
A
S
I |
PAYC
-
NYSE
Paycom Software Inc
COMPUTER SOFTWARE and SERVICES - Application Software
|
$228.72
|
-20.90
-8.37% |
$250.14
|
1,161,574
200.96% of 50 DAV
50 DAV is 578,000
|
$259.71
-11.93%
|
8/20/2019
|
$246.97
|
PP = $246.95
|
|
MB = $259.30
|
Most Recent Note - 9/9/2019 12:57:18 PM
G - Color code is changed to green. Volume is heavier behind today's big loss violating its 50 DMA line ($240) which raises concerns and triggers a technical sell signal. Only a prompt rebound above the 50 DMA line would help its outlook improve. Recent gains above the pivot point did not have the +40% above average volume necessary to trigger a proper new (or add-on) technical buy signal. The recent low ($216.55 on 8/05/19) defines the next important support level to watch. Fundamentals remain strong.
>>> FEATURED STOCK ARTICLE : Recently Wedged Higher Without Great Volume Conviction - 8/26/2019 |
View all notes |
Set NEW NOTE alert |
Company Profile |
SEC
News |
Chart |
Request a new note
C
A
S
I |
BLD
-
NYSE
Topbuild Corp
Bldg-Constr Prds/Misc
|
$92.33
|
+0.74
0.81% |
$92.92
|
212,575
75.11% of 50 DAV
50 DAV is 283,000
|
$93.63
-1.39%
|
5/17/2019
|
$82.19
|
PP = $87.31
|
|
MB = $91.68
|
Most Recent Note - 9/4/2019 5:39:38 PM
G - Posted a gain today on light volume and it is perched within close striking distance of its all-time high. Earnings rose +39% on +9% sales revenues for the Jun '19 quarter versus the year ago period. Prior highs in the $86 area define initial support to watch above its 50 DMA line ($85.54) on pullbacks.
>>> FEATURED STOCK ARTICLE : Topbuild Has 4 Consecutive Weekly Gains and Stubbornly Held Ground - 8/19/2019 |
View all notes |
Set NEW NOTE alert |
Company Profile |
SEC
News |
Chart |
Request a new note
C
A
S
I |
TEAM
-
NASDAQ
Atlassian Corp Plc Cl A
Comp Sftwr-Spec Enterprs
|
$126.27
|
-5.94
-4.49% |
$134.05
|
3,409,075
261.63% of 50 DAV
50 DAV is 1,303,000
|
$149.80
-15.71%
|
8/27/2019
|
$142.62
|
PP = $149.90
|
|
MB = $157.40
|
Most Recent Note - 9/9/2019 3:30:27 PM
Sinking further below its 50 DMA line with today's 2nd consecutive volume-driven loss. A rebound above the 50 DMA line ($138.13) is needed for its outlook to improve. Last week's losses undercutting the prior low ($130.78 on 7/23/19) triggered a worrisome technical sell signal. Fundamentals remain strong. It will be dropped from the Featured Stocks list tonight.
>>> FEATURED STOCK ARTICLE : Consolidating Near High After Recently Finding Support - 8/21/2019 |
View all notes |
Set NEW NOTE alert |
Company Profile |
SEC
News |
Chart |
Request a new note
C
A
S
I |
Symbol/Exchange
Company Name
Industry Group |
PRICE |
CHANGE
(%Change) |
Day High |
Volume
(% DAV)
(% 50 day avg vol) |
52 Wk Hi
% From Hi |
Featured
Date |
Price
Featured |
Pivot Featured |
|
Max Buy |
TTD
-
NASDAQ
The Trade Desk Inc Cl A
Comml Svcs-Advertising
|
$213.67
|
-19.46
-8.35% |
$235.48
|
3,493,468
245.85% of 50 DAV
50 DAV is 1,421,000
|
$289.51
-26.20%
|
7/18/2019
|
$240.61
|
PP = $258.10
|
|
MB = $271.01
|
Most Recent Note - 9/9/2019 3:34:12 PM
Slumping further below its 50 DMA line ($248) and below the recent low ($239.01 on 8/21/19) with today's volume-driven loss after damaging losses last week triggered technical sell signals. A rebound above the 50 DMA line is needed to help its outlook improve. Reported Jun '19 quarterly earnings +58% on +42% sales revenues. It will be dropped from the Featured Stocks list tonight.
>>> FEATURED STOCK ARTICLE : Distributional Action Weighs on Prior Leader - 9/9/2019 |
View all notes |
Set NEW NOTE alert |
Company Profile |
SEC
News |
Chart |
Request a new note
C
A
S
I |
PAGS
-
NYSE
Pagseguro Digital Cl A
Finance-CrdtCard/PmtPr
|
$47.04
|
-4.63
-8.96% |
$52.00
|
2,533,213
118.76% of 50 DAV
50 DAV is 2,133,000
|
$53.43
-11.96%
|
6/25/2019
|
$37.69
|
PP = $40.07
|
|
MB = $42.07
|
Most Recent Note - 9/9/2019 3:31:49 PM
G - Abruptly retreated today testing its 50 DMA line ($46.28) which defines support above the recent low ($42.00 on 8/05/19). Reported earnings +35% on +39% sales revenues for the quarter ended June 30,2019 versus the year ago period.
>>> FEATURED STOCK ARTICLE : Brazil-Based Digital Payments Firm Perched at All-Time High - 8/22/2019 |
View all notes |
Set NEW NOTE alert |
Company Profile |
SEC
News |
Chart |
Request a new note
C
A
S
I |
|
|
|
THESE ARE NOT BUY RECOMMENDATIONS!
Comments contained in the body of this report are technical
opinions only. The material herein has been obtained
from sources believed to be reliable and accurate, however,
its accuracy and completeness cannot be guaranteed.
This site is not an investment advisor, hence it does
not endorse or recommend any securities or other investments.
Any recommendation contained in this report may not
be suitable for all investors and it is not to be deemed
an offer or solicitation on our part with respect to
the purchase or sale of any securities. All trademarks,
service marks and trade names appearing in this report
are the property of their respective owners, and are
likewise used for identification purposes only.
This report is a service available
only to active Paid Premium Members.
You may opt-out of receiving report notifications
at any time. Questions or comments may be submitted
by writing to Premium Membership Services 665 S.E. 10 Street, Suite 201 Deerfield Beach, FL 33441-5634 or by calling 1-800-965-8307
or 954-785-1121.
|
|
|