You are not logged in.
This means you
CAN ONLY VIEW reports that were published prior to Monday, February 19, 2024.
You
MUST UPGRADE YOUR MEMBERSHIP if you want to see any current reports.
AFTER MARKET UPDATE - TUESDAY, SEPTEMBER 8TH, 2020
Previous After Market Report Next After Market Report >>>
|
|
|
|
DOW |
-632.42 |
27,500.89 |
-2.25% |
|
Volume |
1,017,661,560 |
+6% |
|
Volume |
3,854,064,800 |
-10% |
|
NASDAQ |
-474.23 |
10,838.90 |
-4.19% |
|
Advancers |
635 |
22% |
|
Advancers |
1,067 |
33% |
|
S&P 500 |
-95.12 |
3,331.84 |
-2.78% |
|
Decliners |
2,298 |
78% |
|
Decliners |
2,180 |
67% |
|
Russell 2000 |
-30.71 |
1,504.59 |
-2.00% |
|
52 Wk Highs |
25 |
|
|
52 Wk Highs |
44 |
|
|
S&P 600 |
-21.31 |
870.50 |
-2.39% |
|
52 Wk Lows |
24 |
|
|
52 Wk Lows |
45 |
|
|
 |
Breadth Negative as Major Indices Faced a 3rd Day of Pressure
Kenneth J. Gruneisen - Passed the CAN SLIM® Master's Exam
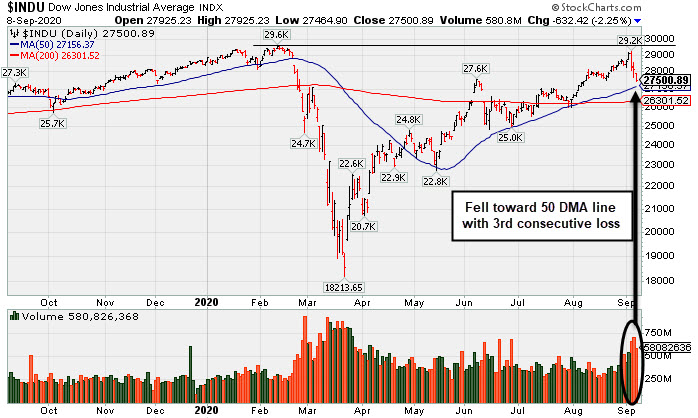
The Dow lost 632 points, while the S&P 500 declined 2.8%, closing at its lowest level since early August. The Nasdaq Composite tumbled 4.1%, and is down more than 10% from its record closing level notched last Wednesday. The reported volume totals were mixed, higher than the prior session total on the NYSE and lighter on the Nasdaq exchange. Breadth was negative as decliners led advancers by almost a 4-1 margin on the NYSE and more than 2-1 on the Nasdaq exchange. Leadership remained thin after contracting abruptly with only 7 high-ranked companies from the Leaders List hitting new 52-week highs and listed on the BreakOuts Page, matching the total on the prior session, down from 102 on Wednesday. New 52-week highs totals contracted and they were evenly matched with new 52-week lows on both the NYSE and the Nasdaq exchange. The major indices have seen their uptrend come under pressure (M criteria) over the past three sessions. Any sustainable rally requires a healthy crop of new leaders, so it will be very important to soon see substantial improvement in the new highs totals.
PICTURED: The Dow Jones Industrial Average suffered a 3rd consecutive volume-driven loss, slumping toward its 50-day moving average after its rally came shy of February's record high.
Stock finished lower for the third consecutive session on Tuesday, as last week’s sell-off in Technology shares deepened. Also, dampening sentiment were simmering tensions between the world’s two largest economies. President Trump suggested that the U.S. could “decouple” from China, pushing to end its economic reliance on Beijing, while also warning American companies against creating jobs overseas. Treasuries strengthened amid demand for perceived safe haven assets with the yield on the 10-year note falling four basis points to 0.68%.
All 11 S&P 500 sectors ended the day in negative territory. Energy stocks underperformed as WTI crude dropped the most since April, with a decline of 7.2% to $36.90/barrel. Oil prices are being dragged lower on increasing worries surrounding demand prospects, as Saudi Arabia slashed its official price for October sales on Monday. Exxon Mobil (XOM -2.30%) fell after a Reuters report speculated on a possible dividend cut as the company faces a $48 billion shortfall through 2021.
Meanwhile, mega-cap shares remained under pressure, with Microsoft (MSFT -5.41%), Apple (AAPL -6.73%), and Amazon (AMZN -4.79%) each declining considerably. In other corporate news, Nikola (NKLA +40.97%) surged while General Motors (GM +7.93%) rallied after announcing a strategic partnership, with GM initiating a $2 billion stake in the electric vehicle maker. Elsewhere, Boeing (BA -5.83%) fell following reports that the Federal Aviation Administration (FAA) was investigating manufacturing issues in the plane maker’s 787 Dreamliner. |
 Kenneth J. Gruneisen started out as a licensed stockbroker in August 1987, a couple of months prior to the historic stock market crash that took the Dow Jones Industrial Average down -22.6% in a single day. He has published daily fact-based fundamental and technical analysis on high-ranked stocks online for two decades. Through FACTBASEDINVESTING.COM, Kenneth provides educational articles, news, market commentary, and other information regarding proven investment systems that work in good times and bad.
Comments contained in the body of this report are technical opinions only and are not necessarily those of Gruneisen Growth Corp. The material herein has been obtained from sources believed to be reliable and accurate, however, its accuracy and completeness cannot be guaranteed. Our firm, employees, and customers may effect transactions, including transactions contrary to any recommendation herein, or have positions in the securities mentioned herein or options with respect thereto. Any recommendation contained in this report may not be suitable for all investors and it is not to be deemed an offer or solicitation on our part with respect to the purchase or sale of any securities. |
|
 |
Financial, Retail, Energy, Tech Indices Suffered Big Losses
Kenneth J. Gruneisen - Passed the CAN SLIM® Master's Exam
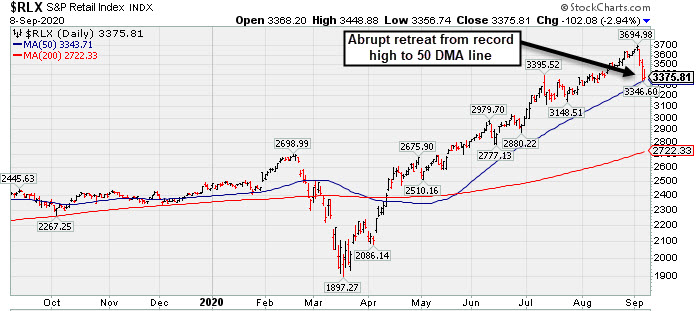
Financial shares weighed on the major indices as the Broker/Dealer Index ($XBD -3.96%) and the Bank Index ($BKX -3.49%) both slumped for big losses. The Retail Index ($RLX -2.94%) also fell. Energy-related shares were also hit with big losses as the Oil Services Index ($OSX -5.75%) and the Integrated Oil Index ($XOI -4.13%) both sank. The Gold & Silver Index ($XAU -1.07%) suffered a smaller loss. Meanwhile, the Semiconductor Index ($SOX -4.73%) led the tech sector's retreat while the Networking Index ($NWX -2.77%) and Biotech Index ($BTK -1.62%) followed with smaller losses.
PICTURED: The Retail Index ($RLX -2.94%) abruptly retreated from its record high with a 3rd consecutive loss testing its 50-day moving average (DMA) line.
| Oil Services |
$OSX |
33.52 |
-2.05 |
-5.75% |
-57.19% |
| Integrated Oil |
$XOI |
672.99 |
-28.98 |
-4.13% |
-47.03% |
| Semiconductor |
$SOX |
2,108.01 |
-104.72 |
-4.73% |
+13.97% |
| Networking |
$NWX |
538.45 |
-15.32 |
-2.77% |
-7.71% |
| Broker/Dealer |
$XBD |
283.84 |
-11.70 |
-3.96% |
-2.25% |
| Retail |
$RLX |
3,375.81 |
-102.08 |
-2.94% |
+37.83% |
| Gold & Silver |
$XAU |
147.98 |
-1.60 |
-1.07% |
+38.41% |
| Bank |
$BKX |
76.47 |
-2.76 |
-3.49% |
-32.55% |
| Biotech |
$BTK |
5,155.16 |
-85.01 |
-1.62% |
+1.73% |
|
|
|
 |
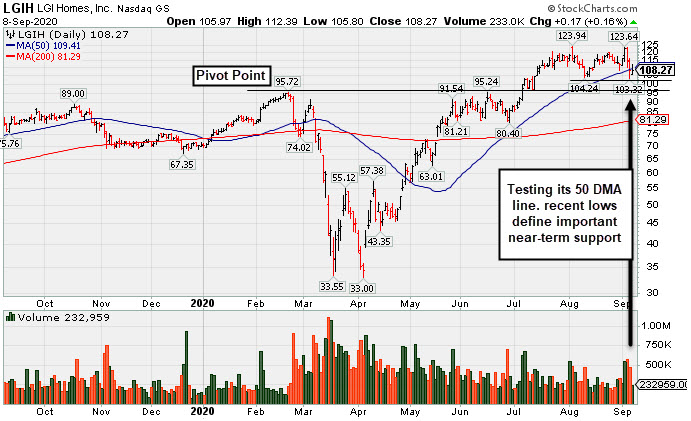
Homebuilder Halted Slide Near Prior Low and 50-Day Average
Kenneth J. Gruneisen - Passed the CAN SLIM® Master's Exam
L G I Homes Inc (LGIH +$0.17 or +0.16% to $108.27) retreated from its 52-week high but halted its slide today near its 50-day moving average (DMA) line ($109.41). More damaging losses would raise greater concerns. Reported Jun '20 quarterly earnings +21% on +4% sales revenues, breaking a streak of 4 comparisons above the +25% minimum guideline (C criteria). LGIH traded up as much as +21.5% since highlighted in yellow with pivot point cited based on its 2/21/20 high plus 10 cents in the 7/07/20 mid-day report (read here). It was last shown in this FSU section on 8/20/20 under the headline, "Leadership in Building - Residential/Commercial Group Improving". It reported Jun '20 quarterly earnings +21% on +4% sales revenues versus the year ago period, breaking a streak of 3 consecutive quarterly comparisons above the +25% minimum earnings guideline (C criteria). Its annual earnings (A criteria) history has been strong. Fundamentals have still been strong enough for it to get a 99 Earnings Per Share Rating, the highest possible rank. The Building - Residential / Commercial Group Relative Strength Rating is now A (66). In recent weeks there has been greater leadership (L criteria) noted in the industry group. It has a small supply (S criteria) of only 22.1 million shares in the public float (S criteria). The number of top-rated funds owning its shares rose from 372 in Dec '19 to 387 in Jun '20, and its current Up/Down Volume Ratio of 1.2 is an unbiased indication its shares have been under accumulation over the past 50 days. It has a Timeliness Rating of A and a Sponsorship Rating of D. LGIH completed its IPO at $11 on 11/07/13. Charts courtesy www.stockcharts.com
 |
|
|
Color Codes Explained :
Y - Better candidates highlighted by our
staff of experts.
G - Previously featured
in past reports as yellow but may no longer be buyable under the
guidelines.
***Last / Change / Volume data in this table is the closing quote data***
Symbol/Exchange
Company Name
Industry Group |
PRICE |
CHANGE
(%Change) |
Day High |
Volume
(% DAV)
(% 50 day avg vol) |
52 Wk Hi
% From Hi |
Featured
Date |
Price
Featured |
Pivot Featured |
|
Max Buy |
 CRL
-
NYSE
CRL
-
NYSE
Charles River Labs Intl
DRUGS - Biotechnology
|
$202.95
|
-1.69
-0.83% |
$206.96
|
260,232
76.31% of 50 DAV
50 DAV is 341,000
|
$221.97
-8.57%
|
7/15/2020
|
$192.66
|
PP = $189.95
|
|
MB = $199.45
|
Most Recent Note - 9/3/2020 6:15:05 PM
G - Volume was higher (near average) behind today's big loss while retreating from its all-time high. The 50 DMA line ($201) defines important near-term support to watch. Recently reported Jun '20 quarterly earnings -3% on +4% sales revenues, below the +25% minimum guideline (C criteria), but better than expected while the company also raised its guidance.
>>> FEATURED STOCK ARTICLE : Volume Totals Cooling While Hovering in Tight Range Near Record High - 8/25/2020 |
View all notes |
Set NEW NOTE alert |
Company Profile |
SEC
News |
Chart |
Request a new note
C
A
S
I |
EBS
-
NYSE
Emergent Biosolutions
DRUGS - Biotechnology
|
$104.21
|
-0.57
-0.54% |
$107.05
|
529,023
54.20% of 50 DAV
50 DAV is 976,000
|
$137.61
-24.27%
|
7/7/2020
|
$89.47
|
PP = $93.68
|
|
MB = $98.36
|
Most Recent Note - 9/3/2020 6:25:24 PM
G - Undercut both its prior high $107.16 on 7/20/20) and its 50 DMA line ($107.37) with today's loss on light volume raising concerns. Fundamentals remain strong.
>>> FEATURED STOCK ARTICLE : High Ranked Biomed Leader is Extended From Prior Base - 8/21/2020 |
View all notes |
Set NEW NOTE alert |
Company Profile |
SEC
News |
Chart |
Request a new note
C
A
S
I |
AMD
-
NASDAQ
Advanced Micro Devices
ELECTRONICS - Semiconductor - Broad Line
|
$78.69
|
-3.32
-4.05% |
$81.88
|
54,673,769
84.94% of 50 DAV
50 DAV is 64,364,000
|
$94.28
-16.54%
|
8/31/2020
|
$90.42
|
PP = $87.39
|
|
MB = $91.76
|
 Most Recent Note - 9/8/2020 5:28:33 PM
Y - Suffered a 4th consecutive loss today. Abruptly pulled back from its all-time high, completely negating the recent breakout from an advanced "3-weeks tight" base. The recent low ($76.10 on 8/11/20) defines near-term support above its 50 DMA line ($72.11). Fundamentals remain strong.
>>> FEATURED STOCK ARTICLE : Perched at All-Time High After Another Bullish Breakout - 9/2/2020 |
View all notes |
Set NEW NOTE alert |
Company Profile |
SEC
News |
Chart |
Request a new note
C
A
S
I |
TREX
-
NYSE
Trex Company Inc
MATERIALS and CONSTRUCTION - General Building Materials
|
$138.32
|
+1.38
1.01% |
$142.19
|
566,786
74.48% of 50 DAV
50 DAV is 761,000
|
$156.63
-11.69%
|
6/26/2020
|
$109.05
|
PP = $132.94
|
|
MB = $139.59
|
Most Recent Note - 9/4/2020 6:07:36 PM
Y - Color code is changed to yellow after retreating below its "max buy" level with today's 3rd consecutive loss backed by below average volume. Violated its 50 DMA line ($137.93) raising concerns, and only a prompt rebound may help its outlook improve. Fundamentals remain strong. See the latest FSU analysis for more details and a new annotated graph.
>>> FEATURED STOCK ARTICLE : Fall Below "Max Buy" Level Also Undercut 50-Day Moving Average - 9/4/2020 |
View all notes |
Set NEW NOTE alert |
Company Profile |
SEC
News |
Chart |
Request a new note
C
A
S
I |
NFLX
-
NASDAQ
Netflix Inc
SPECIALTY RETAIL - Music and Video Stores
|
$507.02
|
-9.03
-1.75% |
$522.00
|
5,513,158
69.41% of 50 DAV
50 DAV is 7,943,000
|
$575.37
-11.88%
|
9/1/2020
|
$547.45
|
PP = $575.47
|
|
MB = $604.24
|
Most Recent Note - 9/3/2020 6:28:34 PM
Y - Pulled back today on +15% above average volume after a best-ever close on Tuesday. A new pivot point was cited based on its 7/13/20 high plus 10 cents. Subsequent volume-driven gains above the pivot point may trigger a new (or add-on) technical buy signal. Found support near its 50 DMA line ($498) on consolidations during its ongoing ascent. Fundamentals remain strong. See the latest FSU analysis for more details and a new annotated graph.
>>> FEATURED STOCK ARTICLE : Pulling Back After Best Ever Close on Tuesday - 9/3/2020 |
View all notes |
Set NEW NOTE alert |
Company Profile |
SEC
News |
Chart |
Request a new note
C
A
S
I |
Symbol/Exchange
Company Name
Industry Group |
PRICE |
CHANGE
(%Change) |
Day High |
Volume
(% DAV)
(% 50 day avg vol) |
52 Wk Hi
% From Hi |
Featured
Date |
Price
Featured |
Pivot Featured |
|
Max Buy |
LGIH
-
NASDAQ
L G I Homes Inc
Bldg-Resident/Comml
|
$108.27
|
+0.17
0.16% |
$112.39
|
232,959
70.59% of 50 DAV
50 DAV is 330,000
|
$123.94
-12.64%
|
7/7/2020
|
$99.19
|
PP = $95.82
|
|
MB = $100.61
|
Most Recent Note - 9/8/2020 5:35:19 PM
G - Retreated from its 52-week high but halted its slide today near its 50 DMA line ($109.41). More damaging losses would raise greater concerns. Reported Jun '20 quarterly earnings +21% on +4% sales revenues, breaking a streak of 4 comparisons above the +25% minimum guideline (C criteria).
>>> FEATURED STOCK ARTICLE : Homebuilder Halted Slide Near Prior Low and 50-Day Average - 9/8/2020 |
View all notes |
Set NEW NOTE alert |
Company Profile |
SEC
News |
Chart |
Request a new note
C
A
S
I |
NOW
-
NYSE
Servicenow Inc
Computer Sftwr-Enterprse
|
$443.14
|
-7.21
-1.60% |
$452.73
|
1,720,274
98.92% of 50 DAV
50 DAV is 1,739,000
|
$501.82
-11.69%
|
8/20/2020
|
$453.34
|
PP = $454.79
|
|
MB = $477.53
|
Most Recent Note - 9/3/2020 6:31:40 PM
Y - Pulled back on higher volume today retreating below its "max buy" level and its color code changed to yellow. The prior high ($454) defines initial support to watch above its 50 DMA line ($436). Fundamentals remain strong.
>>> FEATURED STOCK ARTICLE : Quiet Gain to New High for Computer Software Firm - 8/28/2020 |
View all notes |
Set NEW NOTE alert |
Company Profile |
SEC
News |
Chart |
Request a new note
C
A
S
I |
DOCU
-
NASDAQ
Docusign Inc
Computer Sftwr-Enterprse
|
$205.63
|
-10.63
-4.92% |
$214.14
|
11,523,657
187.74% of 50 DAV
50 DAV is 6,138,000
|
$290.23
-29.15%
|
6/10/2020
|
$149.73
|
PP = $152.10
|
|
MB = $159.71
|
Most Recent Note - 9/8/2020 5:23:28 PM
G - Suffered a 4th consecutive volume-driven loss today, abruptly retreating from its all-time high. Testing its 50 DMA line ($206) while the prior low ($189.12 on 8/12/20) defines the next important near-term support to watch.
>>> FEATURED STOCK ARTICLE : Perched Near All-Time High After Finding Support Above 50 DMA - 8/31/2020 |
View all notes |
Set NEW NOTE alert |
Company Profile |
SEC
News |
Chart |
Request a new note
C
A
S
I |
PING
-
NYSE
Ping Identity Holdings Corp
Computer Sftwr-Security
|
$30.89
|
-0.23
-0.74% |
$31.70
|
896,737
72.83% of 50 DAV
50 DAV is 1,231,300
|
$37.80
-18.28%
|
6/1/2020
|
$29.24
|
PP = $29.90
|
|
MB = $31.40
|
Most Recent Note - 9/3/2020 6:34:03 PM
G - Violated its 50 DMA line ($33.55) with today's big volume-driven loss raising concerns and triggering a technical sell signal. The prior low ($30.50 on 8/13/20) defines the next important support to watch. Sputtering in recent weeks after it reported Jun '20 quarterly earnings -27% on -6% sales revenues versus the year ago period, below the +25% minimum earnings guideline, raising fundamental concerns. Completed Secondary Offerings on 7/09/20 and 5/15/20.
>>> FEATURED STOCK ARTICLE : Found Support Near 50 DMA Line But Latest Earnings Were Sub Par - 8/26/2020 |
View all notes |
Set NEW NOTE alert |
Company Profile |
SEC
News |
Chart |
Request a new note
C
A
S
I |
DT
-
NYSE
Dynatrace Inc
Computer Sftwr-Enterprse
|
$38.59
|
-1.40
-3.50% |
$40.22
|
2,402,128
74.42% of 50 DAV
50 DAV is 3,228,000
|
$48.85
-21.00%
|
9/1/2020
|
$46.37
|
PP = $44.75
|
|
MB = $46.99
|
Most Recent Note - 9/8/2020 5:26:13 PM
Slumped further with today's 4th consecutive loss, failing to rebound after its 50 DMA line ($41.19) violation last week triggered a technical sell signal. Completely negated the recent breakout. Only a prompt rebound above the 50 DMA line would help its outlook improve. It will be dropped from the Featured Stocks list tonight.
>>> FEATURED STOCK ARTICLE : Volume-Driven Gain for New High Triggered Technical Buy Signal - 9/1/2020 |
View all notes |
Set NEW NOTE alert |
Company Profile |
SEC
News |
Chart |
Request a new note
C
A
S
I |
Symbol/Exchange
Company Name
Industry Group |
PRICE |
CHANGE
(%Change) |
Day High |
Volume
(% DAV)
(% 50 day avg vol) |
52 Wk Hi
% From Hi |
Featured
Date |
Price
Featured |
Pivot Featured |
|
Max Buy |
|
|
|
THESE ARE NOT BUY RECOMMENDATIONS!
Comments contained in the body of this report are technical
opinions only. The material herein has been obtained
from sources believed to be reliable and accurate, however,
its accuracy and completeness cannot be guaranteed.
This site is not an investment advisor, hence it does
not endorse or recommend any securities or other investments.
Any recommendation contained in this report may not
be suitable for all investors and it is not to be deemed
an offer or solicitation on our part with respect to
the purchase or sale of any securities. All trademarks,
service marks and trade names appearing in this report
are the property of their respective owners, and are
likewise used for identification purposes only.
This report is a service available
only to active Paid Premium Members.
You may opt-out of receiving report notifications
at any time. Questions or comments may be submitted
by writing to Premium Membership Services 665 S.E. 10 Street, Suite 201 Deerfield Beach, FL 33441-5634 or by calling 1-800-965-8307
or 954-785-1121.
|
|
|