You are not logged in.
This means you
CAN ONLY VIEW reports that were published prior to Monday, February 19, 2024.
You
MUST UPGRADE YOUR MEMBERSHIP if you want to see any current reports.
AFTER MARKET UPDATE - TUESDAY, SEPTEMBER 6TH, 2022
Previous After Market Report Next After Market Report >>>
|
|
|
|
DOW |
-173.14 |
31,145.30 |
-0.55% |
|
Volume |
916,066,658 |
+15% |
|
Volume |
4,595,895,800 |
+8% |
|
NASDAQ |
-85.96 |
11,544.91 |
-0.74% |
|
Advancers |
975 |
32% |
|
Advancers |
1,380 |
33% |
|
S&P 500 |
-16.07 |
3,908.19 |
-0.41% |
|
Decliners |
2,105 |
68% |
|
Decliners |
2,833 |
67% |
|
Russell 2000 |
-17.42 |
1,792.32 |
-0.96% |
|
52 Wk Highs |
17 |
|
|
52 Wk Highs |
35 |
|
|
S&P 600 |
-15.88 |
1,146.00 |
-1.37% |
|
52 Wk Lows |
222 |
|
|
52 Wk Lows |
399 |
|
|
Deterioration has the market uptrend under pressure (M criteria) and having the overall look of a more serious correction. A caution flag has been raised by the technical damage in the major indices coupled with a shrinking list of stocks hitting new highs.
|
 |
Major Averages Show Further Signs of Distributional Pressure
Kenneth J. Gruneisen - Passed the CAN SLIM® Master's Exam
The S&P 500 declined 0.4% after briefly dipping below the 3,900 level. The Nasdaq Composite shed 0.7%, dropping for a seventh straight session in its longest losing streak since November 2016. The Dow lost 173 points. The volume totals reported were higher than the prior session on the NYSE and on the Nasdaq exchange, indicating an increase in institutional selling. Breadth was negative as decliners led advancers by more than a 2-1 margin on the NYSE and on the Nasdaq exchange. There were 0 high-ranked companies from the Leaders List that hit new 52-week highs and were listed on the BreakOuts Page for the 5th consecutive session. New 52-week lows totals expanded and solidly outnumbered new 52-week highs on the NYSE and on the Nasdaq exchange. The market uptrend is now under pressure (M criteria). Any sustainable rally requires a healthy crop of leading stocks hitting new highs.
Chart courtesy of www.stockcharts.com%20on%20Tuesday.%20Yesterday,%20the%20broad%20benchmark%20eclipsed%20the%204,300%20level%20for%20the%20first%20time%20since%20late%20April.%20The%20Nasdaq%20Composite%20fell%201.3%%20amid%20weakness%20in%20mega-cap%20tech%20shares.%20The%20volume%20totals%20reported%20were%20mixed,%20lighter%20than%20the%20prior%20session%20on%20the%20NYSE%20and%20higher%20on%20the%20Nasdaq%20exchange.%20Decliners%20led%20advancers%20by%20a%204-1%20margin%20on%20the%20NYSE%20ad%20by%20a%203-1%20margin%20on%20the%20Nasdaq%20exchange.%20There%20were%2017%20high-ranked%20companies%20from%20the%20Leaders%20List%20that%20hit%20new%2052-week%20highs%20and%20were%20listed%20on%20the%20BreakOuts%20Page,%20down%20from%20the%20total%20of%2045%20on%20the%20prior%20session.%20New%2052-week%20highs%20outnumbered%20new%2052-week%20lows%20on%20the%20NYSE,%20but%20new%20lows%20outnumbered%20new%20highs%20on%20the%20Nasdaq%20exchange.%20The%20market%20is%20in%20a%20confirmed%20uptrend%20(M%20criteria).%20Any%20sustainable%20rally%20requires%20a%20healthy%20crop%20of%20leading%20stocks%20hitting%20new%20highs,%20so%20the%20recent%20improvement%20in%20leadership%20was%20a%20reassuring%20sign.) 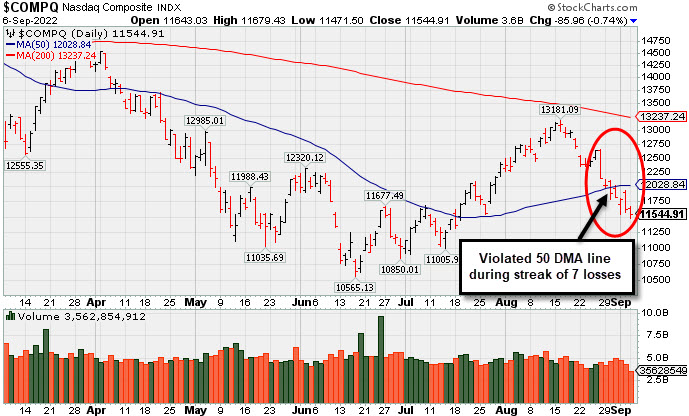 PICTURED: The Nasdaq Composite Index violated its 50-day moving average (DMA) line during a streak of 7 consecutive losses. Its rebound met resistance well below its 200 DMA line.
U.S. equities finished lower in a volatile session on Tuesday despite strong economic data. On the data front, the Institute for Supply Management’s (ISM) services sector index unexpectedly improved to 56.9 in August, the highest level since April as business activity and new orders increased and price pressures eased. The figure follows Friday’s jobs report, which showed the U.S. economy added a greater-than-expected 315,000 non-farm payrolls in August, though the unemployment rate climbed to 3.7%. Today’s ISM figure and the strong jobs report point to a resilient U.S. economy, which may bolster the Federal Reserve’s (Fed) case for continuing to act aggressively in hiking rates in order to tame inflation.
Following the release, Treasuries weakened along the curve. The yield on the 10-year note climbed 15 basis points (0.15%) to 3.34%, its highest level since mid-June. The yield on the more Fed-sensitive two-year note jumped 11 basis points (0.11%) to 3.50%. In commodities, West Texas Intermediate crude snapped a two-day rally, closing down 0.1% to $86.79/barrel as demand concerns outweighed news that the Organization of Petroleum Exporting Countries and its allies (OPEC+) would cut production in October. Seven of 11 S&P 500 sectors ended in negative territory, with Real Estate, Utilities, Industrials and Health Care bucking the downtrend. |
 Kenneth J. Gruneisen started out as a licensed stockbroker in August 1987, a couple of months prior to the historic stock market crash that took the Dow Jones Industrial Average down -22.6% in a single day. He has published daily fact-based fundamental and technical analysis on high-ranked stocks online for two decades. Through FACTBASEDINVESTING.COM, Kenneth provides educational articles, news, market commentary, and other information regarding proven investment systems that work in good times and bad.
Comments contained in the body of this report are technical opinions only and are not necessarily those of Gruneisen Growth Corp. The material herein has been obtained from sources believed to be reliable and accurate, however, its accuracy and completeness cannot be guaranteed. Our firm, employees, and customers may effect transactions, including transactions contrary to any recommendation herein, or have positions in the securities mentioned herein or options with respect thereto. Any recommendation contained in this report may not be suitable for all investors and it is not to be deemed an offer or solicitation on our part with respect to the purchase or sale of any securities. |
|
 |
Retail, Financial, Tech, and Commodity-Linked Groups Fell
Kenneth J. Gruneisen - Passed the CAN SLIM® Master's Exam
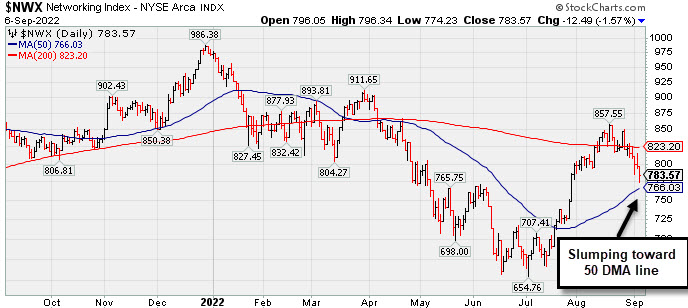
The Retail Index ($RLX -0.93%), Broker/Dealer Index ($XBD -0.93%), and Bank Index ($BKX -0.90%) each lost ground and weighed on the market averages. The tech sector had a negative bias as the Semiconductor Index ($SOX -1.07%), Networking Index ($NWX -1.57%), and Biotech Index ($BTK -1.19%) suffered unanimous losses. The Oil Services Index ($OSX -1.12%), Integrated Oil Index ($XOI -1.02%), and Gold & Silver Index ($XAU -1.01%) each lost ground, rounding out the widely negative session.
PICTURED: The Networking Index ($NWX -1.57%) is slumping back toward its 50-day moving average (DMA) line.
| Oil Services |
$OSX |
68.21 |
-0.77 |
-1.12% |
+29.38% |
| Integrated Oil |
$XOI |
1,626.07 |
-16.84 |
-1.02% |
+38.01% |
| Semiconductor |
$SOX |
2,571.47 |
-27.80 |
-1.07% |
-34.84% |
| Networking |
$NWX |
783.57 |
-12.49 |
-1.57% |
-19.31% |
| Broker/Dealer |
$XBD |
431.73 |
-4.06 |
-0.93% |
-11.32% |
| Retail |
$RLX |
3,213.90 |
-30.13 |
-0.93% |
-23.96% |
| Gold & Silver |
$XAU |
97.08 |
-0.99 |
-1.01% |
-26.70% |
| Bank |
$BKX |
104.03 |
-0.94 |
-0.90% |
-21.32% |
| Biotech |
$BTK |
4,643.48 |
-55.92 |
-1.19% |
-15.86% |
|
|
|
 |
Recently Slipped Below Pivot Point Testing 50-Day Average
Kenneth J. Gruneisen - Passed the CAN SLIM® Master's Exam
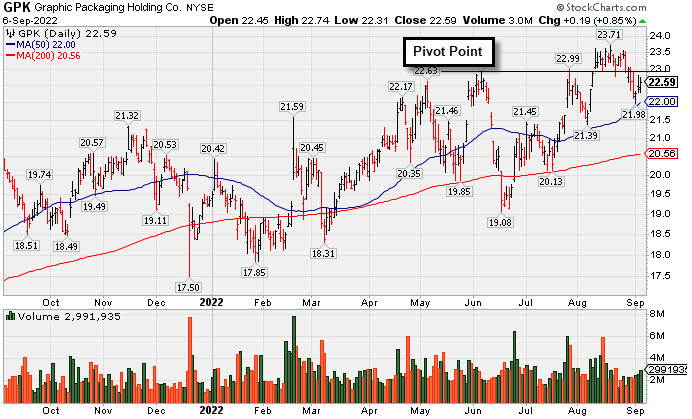
Graphic Packaging Hldg (GPK +$0.19 or +0.85% to $22.59) stalled since its 8/10/22 breakout and slumped back below its pivot point. Now it is consolidating just above its 50-day moving average (DMA) line ($22.00) which defines important near-term support. More damaging losses would raise greater concerns.
GPK has a 98 Earnings Per Share Rating. Earnings rose +108% on +36% sales revenues for the Jun '22 quarter versus the year ago period. Three of the past 4 quarterly comparisons were above the +25% minimum earnings guideline (C criteria). Its annual earnings history has been good since a downturn in FY '16 and '17, meeting the fact-based investment system's fundamental guidelines (A criteria).
The Paper & Paper Products group is ranked 71st on the 197 Industry Groups list and it has a B+ Group Relative Strength Rating (L criteria). The number of top-rated funds owning its shares rose from 596 in Sep '21 to 644 in Jun '22, a reassuring sign concerning the I criteria. Its current Up/Down Volume Ratio of 1.5 is an unbiased indication its shares have been under accumulation over the past 50 days.
|
|
|
Color Codes Explained :
Y - Better candidates highlighted by our
staff of experts.
G - Previously featured
in past reports as yellow but may no longer be buyable under the
guidelines.
***Last / Change / Volume data in this table is the closing quote data***
Symbol/Exchange
Company Name
Industry Group |
PRICE |
CHANGE
(%Change) |
Day High |
Volume
(% DAV)
(% 50 day avg vol) |
52 Wk Hi
% From Hi |
Featured
Date |
Price
Featured |
Pivot Featured |
|
Max Buy |
 CI
-
NYSE
CI
-
NYSE
Cigna Corp
Medical-Managed Care
|
$285.25
|
-1.33
-0.46% |
$290.22
|
1,242,632
64.22% of 50 DAV
50 DAV is 1,935,000
|
$293.96
-2.96%
|
7/7/2022
|
$276.55
|
PP = $273.68
|
|
MB = $287.36
|
 Most Recent Note - 9/6/2022 6:13:46 PM
Y - There was a "negative reversal" today while again closing below its "max buy" level with below average volume on the session. Volume totals have been cooling while still hovering near its all-time high. Reported earnings for the Jun '22 quarter rose +19% on +5% sales revenues versus the year ago period, breaking a streak of 3 quarterly earnings increases above the +25% minimum guideline (C criteria), raising fundamental concerns. Near-term support to watch is at its 50 DMA line ($278.76).
>>> FEATURED STOCK ARTICLE : Cigna Hovering Near High Despite Earnings Under +25% Minimum - 8/26/2022 |
View all notes |
Set NEW NOTE alert |
Company Profile |
SEC
News |
Chart |
Request a new note
C
A
S
I |
AN
-
NYSE
Autonation Inc
SPECIALTY RETAIL - Auto Dealerships
|
$116.24
|
-6.30
-5.14% |
$122.33
|
1,200,406
180.24% of 50 DAV
50 DAV is 666,000
|
$135.57
-14.26%
|
7/20/2022
|
$122.03
|
PP = $126.49
|
|
MB = $132.81
|
Most Recent Note - 9/6/2022 12:42:16 PM
G - Slumping further below prior highs in the $126 area and its color code is changed to green after violating its 50 DMA line ($119.85) with today's 5th consecutive loss triggering a technical sell signal. Reported Jun '22 quarterly earnings +34% on -2% sales revenues versus the year ago period.
>>> FEATURED STOCK ARTICLE : Autonation Stalled After Recent Breakout - 8/30/2022 |
View all notes |
Set NEW NOTE alert |
Company Profile |
SEC
News |
Chart |
Request a new note
C
A
S
I |
ESQ
-
NASDAQ
Esquire Financial Hldgs
Finance-Commercial Loans
|
$36.38
|
-0.21
-0.57% |
$37.37
|
15,215
29.26% of 50 DAV
50 DAV is 52,000
|
$41.68
-12.72%
|
7/26/2022
|
$37.74
|
PP = $39.19
|
|
MB = $41.15
|
Most Recent Note - 9/1/2022 6:44:04 PM
Y - Testing its 50 DMA line ($36.41) with today's 5th consecutive loss on lighter than average volume while slumping below prior resistance in the $39 area. Confirming gains above the pivot point backed by at least +40% above average volume would be a reassuring sign of fresh institutional buying. See the latest FSU analysis for more details and a new annotated graph.
>>> FEATURED STOCK ARTICLE : Testing 50-Day Moving Average With 5th Straight Loss - 9/1/2022 |
View all notes |
Set NEW NOTE alert |
Company Profile |
SEC
News |
Chart |
Request a new note
C
A
S
I |
GPK
-
NYSE
Graphic Packaging Hldg
CONSUMER NON-DURABLES - Packaging and Containers
|
$22.59
|
+0.19
0.85% |
$22.74
|
2,991,935
102.85% of 50 DAV
50 DAV is 2,909,000
|
$23.71
-4.72%
|
7/26/2022
|
$22.63
|
PP = $23.09
|
|
MB = $24.24
|
Most Recent Note - 9/6/2022 6:07:10 PM
Y - Stalled since its 8/10/22 breakout and it slumped back below its pivot point. Consolidating just above its 50 DMA line ($22.00) which defines important near-term support. More damaging losses would raise greater concerns. See the latest FSU analysis for more details and a new annotated graph.
>>> FEATURED STOCK ARTICLE : Recently Slipped Below Pivot Point Testing 50-Day Average - 9/6/2022 |
View all notes |
Set NEW NOTE alert |
Company Profile |
SEC
News |
Chart |
Request a new note
C
A
S
I |
CSL
-
NYSE
Carlisle Cos Inc
Diversified Operations
|
$297.94
|
+1.98
0.67% |
$299.99
|
622,870
133.38% of 50 DAV
50 DAV is 467,000
|
$318.71
-6.52%
|
7/28/2022
|
$282.31
|
PP = $275.23
|
|
MB = $288.99
|
Most Recent Note - 9/2/2022 5:24:05 PM
G - Reversed an early gain and ended the session with a loss and near the session low. It remains extended from the previously noted base. Its 50 DMA line ($280) and prior highs in the $275 area define important near-term support to watch.
>>> FEATURED STOCK ARTICLE : Pulling Back From All-Time High After Volume-Driven Gains - 8/22/2022 |
View all notes |
Set NEW NOTE alert |
Company Profile |
SEC
News |
Chart |
Request a new note
C
A
S
I |
Symbol/Exchange
Company Name
Industry Group |
PRICE |
CHANGE
(%Change) |
Day High |
Volume
(% DAV)
(% 50 day avg vol) |
52 Wk Hi
% From Hi |
Featured
Date |
Price
Featured |
Pivot Featured |
|
Max Buy |
ENPH
-
NASDAQ
Enphase Energy Inc
Energy-Solar
|
$292.82
|
+13.75
4.93% |
$297.99
|
4,048,188
121.79% of 50 DAV
50 DAV is 3,324,000
|
$308.88
-5.20%
|
7/28/2022
|
$276.66
|
PP = $282.55
|
|
MB = $296.68
|
Most Recent Note - 9/6/2022 6:10:57 PM
Y - Posted a solid gain today with +21% above average volume. Volume totals cooled while hovering near its all-time high in recent weeks. The prior high in the $282 area has been noted as initial support to watch above its 50 DMA line ($252.77). Fundamentals remain strong.
>>> FEATURED STOCK ARTICLE : Enphase Energy Consolidating After Rallying to New Highs - 8/19/2022 |
View all notes |
Set NEW NOTE alert |
Company Profile |
SEC
News |
Chart |
Request a new note
C
A
S
I |
PWR
-
NYSE
Quanta Services Inc
MATERIALS and CONSTRUCTION - General Contractors
|
$140.26
|
-0.34
-0.24% |
$141.68
|
889,859
81.27% of 50 DAV
50 DAV is 1,095,000
|
$149.33
-6.07%
|
7/28/2022
|
$141.83
|
PP = $140.14
|
|
MB = $147.15
|
Most Recent Note - 9/2/2022 5:22:28 PM
Y - Posted a small gain today with light volume. Volume totals have been below average while recently wedging back above its pivot point since encountering some distributional pressure. Confirming volume-driven gains for new highs would be a reassuring sign of serious institutional buying demand. Its 50 DMA line ($135.50) defines important near-term support to watch. Fundamentals remain strong.
>>> FEATURED STOCK ARTICLE : Stalled After Breakout But Still Quietly Hovering Near High - 8/16/2022 |
View all notes |
Set NEW NOTE alert |
Company Profile |
SEC
News |
Chart |
Request a new note
C
A
S
I |
GFF
-
NYSE
Griffon Corporation
MATERIALS and CONSTRUCTION - General Building Materials
|
$30.42
|
-1.32
-4.16% |
$31.86
|
443,969
102.06% of 50 DAV
50 DAV is 435,000
|
$34.35
-11.44%
|
8/8/2022
|
$32.46
|
PP = $31.12
|
|
MB = $32.68
|
Most Recent Note - 9/6/2022 6:09:49 PM
Y - Suffered a big loss today with higher (near average) volume, undercutting prior highs in the $31 area and raising concerns. The next important support to watch is its 50 DMA line ($29.57).
>>> FEATURED STOCK ARTICLE : Best Ever Close With Gain on Lighter Volume - 8/25/2022 |
View all notes |
Set NEW NOTE alert |
Company Profile |
SEC
News |
Chart |
Request a new note
C
A
S
I |
CLH
-
NYSE
Clean Harbors Inc
Pollution Control
|
$116.32
|
-0.46
-0.39% |
$117.57
|
264,568
83.46% of 50 DAV
50 DAV is 317,000
|
$124.33
-6.44%
|
8/10/2022
|
$111.78
|
PP = $115.10
|
|
MB = $120.86
|
Most Recent Note - 9/1/2022 12:19:55 PM
Y - Color code was changed to yellow this week while quietly consolidating back below its "max buy" level. Noted gain and strong close above the pivot point backed by +116% above average volume on 8/12/22 triggered a technical buy signal. No resistance remains due to overhead supply. Fundamentals remain strong. Prior high in the $115 area defines important near-term support to watch on pullbacks.
>>> FEATURED STOCK ARTICLE : Quietly Consolidating Below "Max Buy" Level After Breakout - 8/29/2022 |
View all notes |
Set NEW NOTE alert |
Company Profile |
SEC
News |
Chart |
Request a new note
C
A
S
I |
|
|
|
THESE ARE NOT BUY RECOMMENDATIONS!
Comments contained in the body of this report are technical
opinions only. The material herein has been obtained
from sources believed to be reliable and accurate, however,
its accuracy and completeness cannot be guaranteed.
This site is not an investment advisor, hence it does
not endorse or recommend any securities or other investments.
Any recommendation contained in this report may not
be suitable for all investors and it is not to be deemed
an offer or solicitation on our part with respect to
the purchase or sale of any securities. All trademarks,
service marks and trade names appearing in this report
are the property of their respective owners, and are
likewise used for identification purposes only.
This report is a service available
only to active Paid Premium Members.
You may opt-out of receiving report notifications
at any time. Questions or comments may be submitted
by writing to Premium Membership Services 665 S.E. 10 Street, Suite 201 Deerfield Beach, FL 33441-5634 or by calling 1-800-965-8307
or 954-785-1121.
|
|
|